Abstract
During tumor progression, immune system phagocytes continually clear apoptotic cancer cells in a process known as efferocytosis. However, the impact of efferocytosis in metastatic tumor growth is unknown. In this study, we observed that macrophage-driven efferocytosis of prostate cancer cells in vitro induced the expression of proinflammatory cytokines such as CXCL5 by activating Stat3 and NF-κB(p65) signaling. Administration of a dimerizer ligand (AP20187) triggered apoptosis in 2 in vivo syngeneic models of bone tumor growth in which apoptosis-inducible prostate cancer cells were either coimplanted with vertebral bodies, or inoculated in the tibiae of immunocompetent mice. Induction of 2 pulses of apoptosis correlated with increased infiltration of inflammatory cells and accelerated tumor growth in the bone. Apoptosis-induced tumors displayed elevated expression of the proinflammatory cytokine CXCL5. Likewise, CXCL5-deficient mice had reduced tumor progression. Peripheral blood monocytes isolated from patients with bone metastasis of prostate cancer were more efferocytic compared with normal controls, and CXCL5 serum levels were higher in metastatic prostate cancer patients relative to patients with localized prostate cancer or controls. Altogether, these findings suggest that the myeloid phagocytic clearance of apoptotic cancer cells accelerates CXCL5-mediated inflammation and tumor growth in bone, pointing to CXCL5 as a potential target for cancer therapeutics.
Keywords: Inflammation, Oncology
Keywords: Innate immunity, Macrophages, Prostate cancer
Introduction
The most common site of prostate cancer metastasis is bone, with an incidence of 65%–80% in patients with advanced disease (1). Once cancer cells spread to bone, they significantly alter normal bone remodeling, resulting in bone fractures, nerve compression, pain, and hypercalcemia (2). In bone, cancer cells find a protective and supportive microenvironment that promotes metastatic outgrowth. Prevention of bone metastasis is a major goal of treatment, and elucidation of the crucial factors contributing to the development of skeletal metastasis is key. Some mechanisms have been proposed, and monocytic myeloid cell populations attracted to the tumor microenvironment have been identified as critical mediators of inflammation (3, 4). One study found that CD11b+ myeloid cells expressing integrin α4β1 were mobilized to the skeletal tumor microenvironment via interaction with VCAM-1 expressed in breast tumor cells (5). Similarly, another breast cancer study showed that macrophages expressing α4β1 promote cancer cell survival and lung metastasis (6), suggesting that this interaction may be essential for both cancer colonization and osseous progression.
The bone microenvironment is rich in factors that promote the mobilization, proliferation, and differentiation of proinflammatory cells, which interact with disseminated tumor cells, promoting survival and colonization. This occurs through multiple inflammation-mediated molecular mechanisms that originate feed-forward amplification loops between tumor cells, inflammatory cells, osteoblasts, osteoclasts, and bone marrow stromal cells to perpetuate a chronic inflammatory state (7).
A successful antiinflammatory therapy that targets tumor metastasis has been associated with reduced infiltration of bone marrow–derived myeloid cells and prometastatic macrophages (8). Recently a crucial role of bone macrophages in the progression of prostate cancer skeletal metastasis was demonstrated in vivo using models of conditional macrophage depletion (9). Furthermore, special attention has been dedicated to macrophage-directed cancer immunotherapy based on the transformation of macrophages from M2 to M1 type to elicit antitumor responses (10). These approaches have the potential to inhibit tumor progression and metastasis.
Persistent inflammation also exacerbates cell stress and tissue damage, causing apoptotic/necrotic cell death. The clearance of dying cells occurs mainly through phagocytosis by macrophages and other cells (11). Phagocytosis of apoptotic cancer cells (termed efferocytosis) is a process often underestimated during tumor progression due to rapid clearance by phagocytes (11). Tumor cell death, significantly amplified by chemotherapies or other targeted therapies, triggers extensive efferocytosis, which has been suggested to accelerate further tumor growth at least in part by inducing M2-like macrophage polarization and resultant protumoral functions (12, 13).
Using in vivo models of skeletal tumor growth and apoptosis-inducible prostate cancer cells, the role of apoptotic cancer cell clearance in skeletal tumor progression was investigated. A critical role of efferocytosis-induced inflammation mediated by macrophage-derived CXCL5 was discovered as a novel mechanism underlying skeletal metastasis and a viable target for cancer therapeutics.
Results
Proinflammatory cytokines are induced in macrophages upon apoptotic cancer cell efferocytosis.
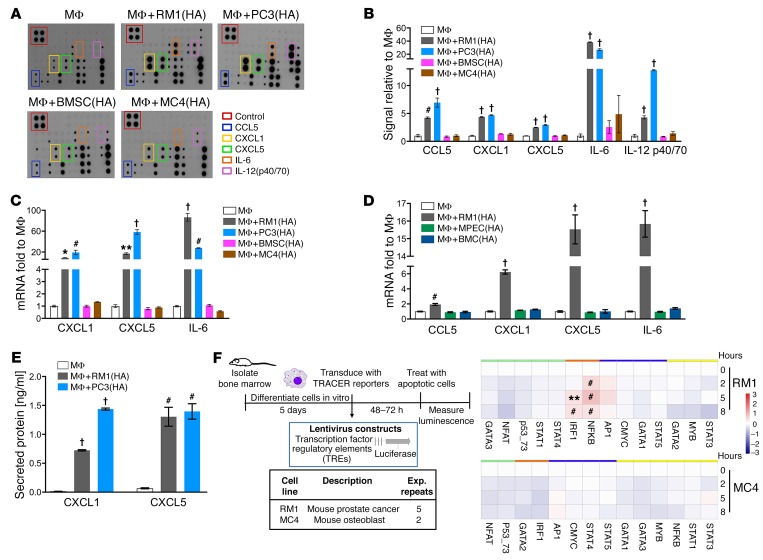
Immunofluorescence and flow cytometric studies show that bone marrow–derived macrophages (MΦs) effectively efferocytose apoptotic cells (12, 14). We hypothesized that macrophages discriminate between different types of apoptotic cells and orchestrate a distinctive response accordingly. To investigate the production of proinflammatory cytokines, cocultures of macrophages and different highly apoptotic (HA) cells were analyzed (Supplemental Figure 1A; supplemental material available online with this article; https://doi.org/10.1172/JCI92466DS1). Two prostate cancer cell types (murine RM1 and human PC3) and 2 noncancer cell types (murine osteoblastic MC4 and murine primary bone marrow stromal cells [BMSCs]) were used. RM1 cells, derived from C57BL/6J mice, represent a valuable model for investigations of prostate cancer interactions with bone marrow stroma as they promote osteolytic lesions accompanied by periosteal bone deposition in immunocompetent C57BL/6J mice (9, 15). Human PC3 cancer cells, originally isolated from prostate cancer bone metastasis (16), have been used extensively for their ability to metastasize to the bone when injected in immunocompromised mice via intracardiac inoculation (17). Secreted proteins from cocultures of macrophages and apoptotic cells were analyzed using inflammation arrays (Figure 1A), and results were quantified and normalized relative to macrophage-alone controls (Figure 1B). The cytokines expressed upon efferocytosis of apoptotic cancer cells differed from noncancer cells, suggesting that different pathways were activated in macrophages. Cytokine activation of CCL5, CXCL1, CXCL5, IL-6, and IL-12(p40/p70) was observed in macrophages cocultured with apoptotic cancer cells, but not apoptotic noncancer cells. Upon noncancer apoptotic cell engulfment, CCL2 was the only cytokine significantly upregulated in macrophages interacting with apoptotic MC4 cells (Supplemental Figure 1B). Other cytokines, like CCL2 and MIP-1α, were increased in cocultures with PC3(HA) but not in cocultures with RM1(HA) cells, and a small increase in the proinflammatory cytokines sTNFRI and sTNFRII (soluble TNF receptors I and II) was observed for both RM1 and PC3 (Supplemental Figure 1B). Apoptotic cells alone showed reduced levels of cytokines compared with macrophages alone (Supplemental Figure 1C). Intriguingly, the proinflammatory factors CCL5, CXCL1, CXCL5, and IL-6 have been shown to have tumor-promoting functions in different contexts (18, 19). To determine the transcriptional regulation in macrophages, quantitative PCR mRNA expression analyses were performed for CXCL1, CXCL5, and IL-6 to compare macrophage responses to the different apoptotic cells. Figure 1C indicates that these cytokines were transcriptionally upregulated in macrophages interacting with apoptotic cancer cells in contrast with noncancer cells, which correlates with the cytokine array results. Since prostate cancer cells are of epithelial origin, we investigated whether the inflammatory responses induced in macrophages were a result of their interaction with apoptotic epithelial cells. Similarly to the experiments above (Supplemental Figure 1A), we used apoptotic mouse primary prostate epithelial cells (MPECs), apoptotic total bone marrow cells (BMCs) (isolated from mouse tibiae), or apoptotic RM1 cells (all originated from C57BL/6J mice) in cocultures with bone macrophages to analyze changes in gene expression of the different inflammatory cytokines (CCL5, CXCL1, CXCL5, and IL-6). Only apoptotic RM1 cancer cells were capable of inducing an inflammatory response in bone marrow macrophages (Figure 1D). ELISA evaluation for CXCL1 and CXCL5 proteins in the coculture media for apoptotic cancer cells (Figure 1E) confirmed the cytokine array results and aligned with the mRNA analyses. Altogether, these results suggest that the clearance of apoptotic cells by macrophages induced a selective response dependent on the cell type engulfed and a common inflammatory expression pattern in macrophages efferocytosing apoptotic cancer cells.
Figure 1. Inflammatory cytokine and transcription factor activation in cocultures of macrophages and highly apoptotic (HA) cells.
(A and B) Supernatants were collected from macrophages (MΦs) alone or cocultured with RM1(HA), PC3(HA), BMSC(HA), or MC4(HA) cells for 18–20 hours and analyzed via inflammatory cytokine array. (A) Representative images. (B) Quantification of cytokines induced. (C) mRNAs isolated from cocultures described in A were analyzed by quantitative PCR (qPCR). (D) mRNAs isolated from MΦs alone or cocultured with RM1(HA), MPEC(HA), or BMC(HA) were analyzed by qPCR for indicated genes. (E) ELISA for total CXCL1 and CXCL5 levels in supernatants of MΦs alone or cocultured with RM1(HA) or PC3(HA). (F) Transcriptional activity cell arrays (TRACER). Analysis of bone marrow–derived MΦs transfected with transcription factor (TF) reporter constructs and cocultured with RM1(HA) or MC4(HA) cells. Data from experimental repeats (n = 5 and n = 2 independent experiments for RM1 for MC4, respectively) were combined. Measurements were log2-transformed and normalized to average intensity of control reporter and then to background. Finally, data were normalized to the initial reporter measurement for each treatment condition at 0 hours. Heatmaps show TF grouping according to cluster analysis for each cell line and the statistical significance, **P < 0.01, #P < 0.001, determined using limma package. Data in B–E are mean ± SEM, n = 3 per group; *P < 0.05, **P < 0.01, #P < 0.001, †P < 0.0001 (1-way ANOVA).
To investigate the transcription factor activity in macrophages in response to the apoptotic cells, we used TRACER (transcriptional activity cell array) technology (Figure 1F and ref. 20). The activity of 13 transcription factors was investigated in cocultures with apoptotic RM1 or MC4, 2 cell lines that induced a differential response in macrophages. Macrophages were transduced with a reporter luciferase construct containing the DNA binding site for each transcription factor or a control vector and the luciferase activity monitored over time in MΦ, MΦ+RM1(HA), and MΦ+MC4(HA). The results were normalized to macrophages alone and to the 0 hour (initial time) (Figure 1F). NF-κB and IRF1 were activated in MΦ+RM1(HA) but not in MΦ+MC4(HA) cocultures. Both transcription factors activate inflammatory responses and in some contexts cooperate with the activation of proinflammatory cytokines (21, 22). These findings correlate with the differential inflammatory response of macrophages in the cocultures with the apoptotic prostate cancer RM1 and the noncancer MC4 cells (Figure 1, A–C). Although Stat3 activation was not detected in the TRACER assays, other studies have suggested activation of this pathway by efferocytosis (12). It is possible that the specific Stat3 regulatory elements in the construct may require additional enhancer sequences to achieve activation upon efferocytosis.
Efferocytosis induces an inflammatory response via activation of Stat3 and NF-κB signaling.
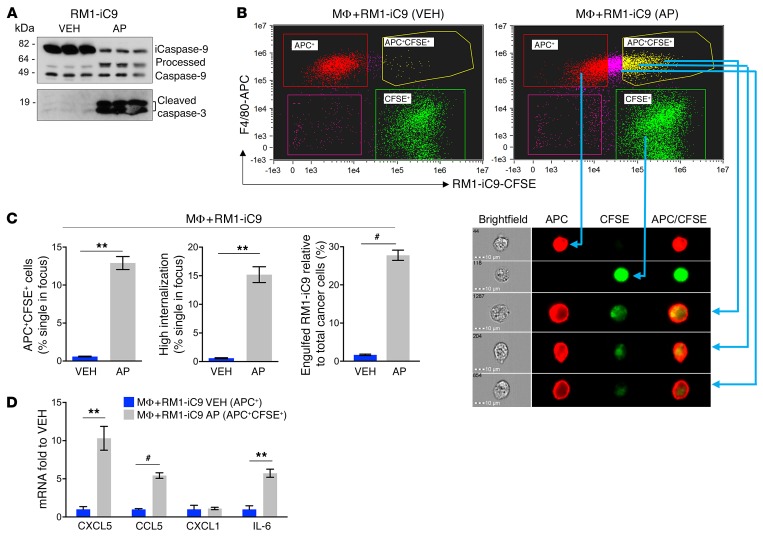
To better understand the role of efferocytosis, we generated apoptosis-inducible prostate cancer cells, RM1-iC9, from murine RM1 cells using the viral construct for inducible caspase-9 (iC9) (23). The induction of apoptosis and resultant caspase-3 activation were validated by treatment with the dimerizer drug AP20187 (AP) or control vehicle (VEH) followed by Western blot analysis of cell extracts (Figure 2A). Formation of processed caspase-9 and corresponding cleaved caspase-3 confirmed apoptosis activation in AP-treated cells. To verify that the inducible apoptotic RM1-iC9 cells were able to be efferocytosed, cells were prelabeled with CFSE dye, cocultured with macrophages, and treated with VEH or AP. After 16–18 hours the cells were collected, labeled with F4/80-APC antibody, and analyzed using the ImageStream flow cytometer (Abcam), which provides microscopic event images. Double-positive APC+CFSE+ cells indicate efferocytic macrophages (macrophages engulfing apoptotic RM1-iC9 cells) as depicted in Figure 2B (yellow gate). The APC+CFSE+ gate exhibited images with green apoptotic cancer cells engulfed by red F4/80+ macrophages (Figure 2B) with high internalization, indicating efferocytosis. In the APC+CFSE+ gate, efferocytosis was observed at different stages of digestion correlating to the position of the cell in the plot. The brightest cells in the CFSE axis showed less digested cancer cells inside macrophages (Figure 2B). As expected, the percentage of cells (gated from single cells in focus) with high internalization was strikingly higher in the samples treated with AP relative to VEH (Figure 2C). Furthermore, the percentages of highly internalized cells were similar to the percentages of cells gated as APC+CFSE+, validating that this gate demonstrates that efferocytosis increased with the induction of apoptosis in cancer cells. When apoptosis was induced with AP, the proportion of engulfed RM1-iC9 cells relative to total cancer cells was approximately 30%, compared with less than 5% when the cells were treated with VEH (Figure 2C). Macrophages from the APC+CFSE+ gate, which had been cocultured with apoptosis-induced RM1-iC9 (AP-treated) cells, were sorted by flow cytometry and compared with APC+-gated macrophages sorted from VEH samples. Quantitative PCR analyses revealed higher (5- to 10-fold) mRNA expression of the proinflammatory cytokines CXCL5, CCL5, and IL-6 in efferocytic macrophages (APC+CFSE+-sorted) as compared with nonefferocytic (APC+-sorted) macrophages (Figure 2D).
Figure 2. Efferocytosis of apoptosis-inducible prostate cancer RM1-iC9 cells.
(A) Apoptosis-inducible RM1-iC9 cells were treated with VEH or AP and analyzed by Western blot for the activation of inducible caspase-9 (iC9) and apoptosis-associated caspase-3. AP treatment increased processed caspase-9 and cleaved caspase-3, reflecting apoptosis (see complete unedited blots in the supplemental material). (B) Bone marrow MΦs were cocultured with RM1-iC9 cells stained with Cell Trace–CFSE (Invitrogen), and treated with VEH or AP for 18 hours. The cocultures were stained with F4/80-APC antibody and analyzed by flow cytometry. Representative FACS images from ImageStream showing MΦs alone (APC+, red gate), RM1-iC9 alone (CFSE+, green gate), and 3 different examples of MΦs engulfing RM1-iC9 (APC+CFSE+, yellow gate). (C) Bar graphs indicating the percentage of efferocytic MΦs (APC+CFSE+ cells), MΦs with high internalization of RM1-iC9, and engulfed RM1-iC9 (APC+CFSE+) relative to total cancer cells (CFSE+ plus APC+CFSE+) after treatment with VEH or AP. (D) mRNAs isolated from APC+CFSE+ gated cells (efferocytic MΦs) of MΦ+RM1-iC9(AP) and APC+ gated cells (nonefferocytic MΦs) of MΦ+RM1-iC9 (VEH) samples were analyzed by qPCR for selected genes. Fold changes were expressed relative to the nonefferocytic MΦ values (VEH). Data in C and D are mean ± SEM, n = 3 per group; **P < 0.01, #P < 0.001 (2-tailed Student’s t test).
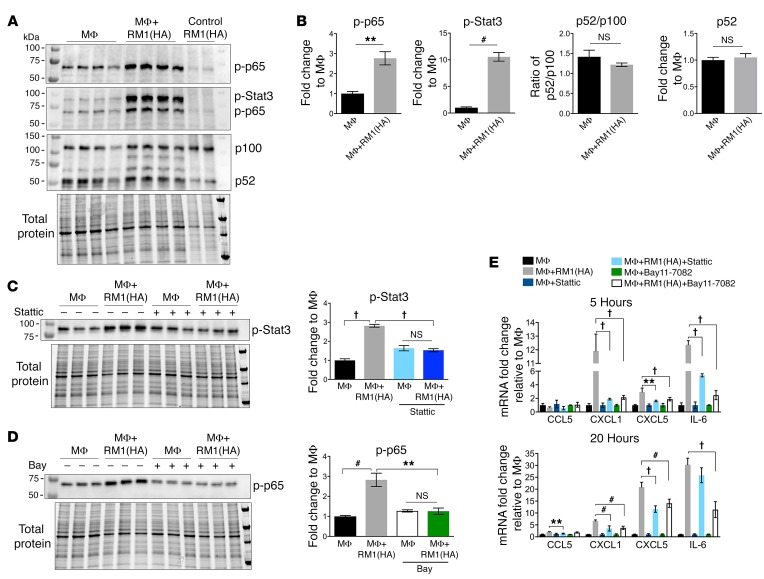
Simultaneous activation of Stat3 and NF-κB signaling in the tumor microenvironment has been identified as a critical element of inflammation-associated tumor progression (24, 25), and here, NF-κB was identified as a critical transcription factor induced in efferocytic macrophages (Figure 1F). Thus the increase in phosphorylation/activation of NF-κB(p65) and Stat3 occurring in macrophages via efferocytosis of apoptotic RM1 cells was further investigated. Protein lysates isolated from cocultures of macrophages and RM1(HA) cells were analyzed by Western blot and quantified. Figure 3A depicts consecutive blotting of the membrane with antibodies for phosphorylated (p) p65, p-Stat3, and NF-κB2(p100/p52), respectively. Quantification of Western bands normalized to total protein in each lane (bottom panel in Figure 3A) showed activation (phosphorylation) of both canonical NF-κB(p65) (p-p65) and Stat3 (p-Stat3) signaling in efferocytic macrophages (Figure 3B). No significant changes in the processing of NF-κB2(p100) precursor to produce p52 (noncanonical NF-κB signaling) were induced by efferocytosis (Figure 3B), which suggests the predominant role of canonical signaling in the efferocytic inflammatory response. The apoptotic RM1-only lysates demonstrated insignificant signals for p-Stat3 or p-p65, which is consistent with the apoptotic stage of these cells.
Figure 3. Efferocytosis-induced activation of Stat3 and NF-κB signaling mediates inflammatory response in macrophages.
(A) MΦs were cocultured 20 hours alone or with apoptotic RM1(HA) cells. Protein from cocultures was analyzed by Western blot for activation of NF-κB and Stat3 signaling using consecutively the following antibodies (panels from top): phospho–NF-κB(p65) [p–NF-κB(p65)], p-Stat3, and p100/p52. Bottom panel shows total protein for each sample. (B) Protein bands in the blots were quantified and normalized to total protein for each sample. Graphs depict the fold changes for p-p65, p-Stat3, p52/p100 ratio, and p52 relative to MΦ signal, respectively. (C) Stattic, a selective inhibitor of Stat3 activation, was incubated with MΦs (12.5 μM) for 1 hour, then removed before coculture with RM1(HA) for 5 hours. Protein was analyzed by Western blot using the p-Stat3 antibody. (D) Bay11-7082, an inhibitor of NF-κB signaling, was preincubated with MΦs (20 μM) for 1 hour before coculture with RM1(HA) for 5 hours. Protein was analyzed by Western blot using the p-p65 antibody. Graphs in C and D depict the quantification of p-Stat3 and p-p65 signals normalized to total protein (lower panel) relative to the average MΦ control (VEH), respectively. See complete unedited blots in the supplemental material. (E) mRNAs were isolated from cocultures at 5 and 20 hours of incubation as described in the experiments in C and D and analyzed by qPCR for indicated genes. Graphs show the fold change relative to MΦ control for each group. Data in B are mean ± SEM, n = 4 per group (2-tailed Student’s t test), or n = 3 per group in C–E (1-way ANOVA); **P < 0.01, #P < 0.001, †P < 0.0001.
To evaluate the dependence of Stat3 and NF-κB in inflammatory cytokine production, cocultures of macrophages and apoptotic RM1 cells were treated with the small-molecule inhibitors Stattic (Stat3 phosphorylation inhibitor; ref. 26) and Bay11-7082 (IκBα phosphorylation inhibitor; refs. 27, 28). Figure 3, C and D, demonstrates the inhibition of p-Stat3 and p-p65 after 5 hours of coculture pretreated with Stattic or Bay11-7082, respectively. Neither Stattic nor Bay11-7082 inhibited efferocytosis (Supplemental Figure 2A); however, both inhibitors significantly mitigated proinflammatory cytokine expression in macrophages at 5 and 20 hours of coculture (Figure 3E).
Treatment with emetine, an IκBα phosphorylation inhibitor (29), reduced efferocytosis in cocultures of macrophages with apoptosis-induced RM1-iC9 (Supplemental Figure 2B). This correlates with Supplemental Figure 2, C and D, which shows that emetine blocked the AP-induced increase of both p–NF-κB(p65) and p-Stat3 in the F4/80+ macrophage population. Furthermore, Ly6B (Ly6-B.2 or antigen 7/4), a bone marrow–derived inflammatory macrophage antigen (30), was increased when efferocytosis was activated with the AP dimerizer (Supplemental Figure 2E), while inhibition of efferocytosis with emetine reduced Ly6B, which is consistent with the inflammatory response of macrophages upon efferocytosis of apoptotic cancer cells. However, emetine inhibited not only p–NF-κB(p65) but also p-Stat3 and efferocytosis, differing from the Bay11-7082 inhibitor results. Therefore, the combined effect of Stattic and Bay11-7082 on efferocytosis was determined. Pretreatment of macrophages (1 hour) with the combination of these inhibitors (same concentrations used in Supplemental Figure 2A) resulted in a complete abrogation of efferocytosis (Supplemental Figure 2F). These findings suggest that the effect of emetine on efferocytosis may be due do a simultaneous blocking of Stat3 and NF-κB activation.
Altogether these findings correlate efferocytosis with persistent inflammation within the tumor microenvironment via activation of Stat3 and NF-κB signaling in macrophages.
Cancer cell death accelerates tumor progression and increases tumor CXCL5 levels.
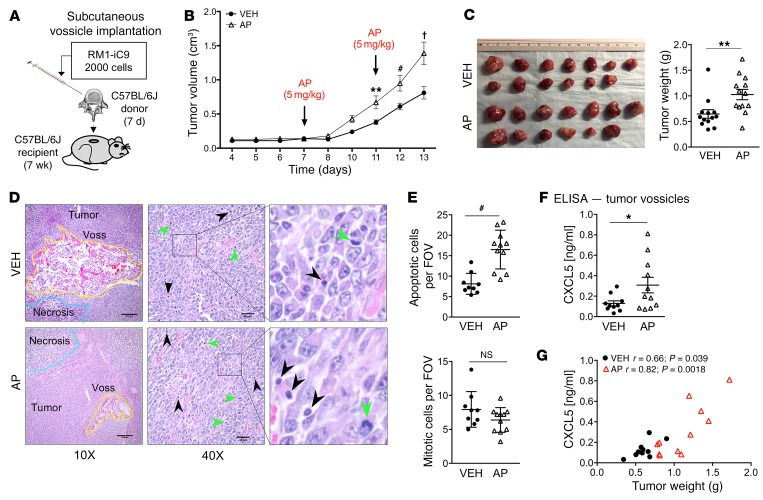
To investigate how efferocytosis of cancer cells affects prostate cancer tumor progression in bone, an osseous implant vossicle model was used (9, 17, 31). Apoptosis-inducible RM1-iC9 cells were coimplanted with vertebral bodies (vossicles) of 7-day-old C57BL/6J mice into the subcutaneous compartment of 7-week-old C57BL/6J mice (Figure 4A). Tumors were repeatedly measured, and in the first 7 days no significant change in tumor volume was observed (Figure 4B). At day 7 after implantation, mice were randomized into 2 groups that were injected i.p. with VEH or the AP dimerizer to induce apoptosis in the RM1-iC9 cancer cells and subsequent efferocytosis. Tumor measurements revealed that induction of cancer cell apoptosis accelerated tumor growth, which was significant 4 days after AP treatment (day 11; Figure 4B). Apoptosis was induced again at day 11, and tumor growth continued to accelerate (days 12 and 13). At study end (day 13), tumor vossicles were collected, and tumor weight was significantly increased in the AP group compared with VEH (Figure 4C). Representative images of H&E tumor vossicle sections show bone structures surrounded by tumor cells as well as the presence of necrotic areas and apoptotic and mitotic cells in both VEH and AP tumors (Figure 4D). Analysis of tumor sections showed significantly higher apoptotic cell numbers in the AP-treated tumors relative to VEH, while no significant changes were observed in mitotic cell numbers between groups (Figure 4E). Considering that mice were sacrificed 2 days after the last AP treatment, it was expected that a major proportion of apoptotic cells would be cleared. Nevertheless, this result validates the effectiveness of AP treatment for the induction of cancer cell apoptosis in vivo.
Figure 4. In vivo syngeneic osseous implant tumor model.
Vertebral bodies (vossicles) from C57BL/6J donor mice (7-day-old males) were inoculated with RM1-iC9 cells, and subcutaneously implanted in C57BL/6J recipient mice (7-week-old males). Mice were randomly divided in 2 groups and treated with VEH or AP to induce apoptosis in RM1-iC9 cells. (A) Experimental design for tumor vossicle model. (B) Tumor volumes were measured by caliper every 1–2 days starting at day 4. RM1-iC9 tumor vossicle volumes were compared between VEH and AP; n = 13 per group. Data are mean ± SEM; **P < 0.01, #P < 0.001, †P < 0.0001 vs. VEH (2-way ANOVA). (C) Images of RM1-iC9 VEH- and AP-treated tumor vossicles. Tumor weight (g) was measured at sacrifice, 13 days after implantation; n = 13 per group. (D) Representative H&E images of tumor vossicles showing vossicle fragments surrounded by tumor cells at ×10 (scale bars: 200 μm) and ×40 (scale bars: 40 μm) original magnifications. Areas of necrosis are highlighted by blue lines in the ×10 images. Apoptotic (black arrowheads) and mitotic cells (green arrowheads) are indicated at ×40 original magnification. (E) Apoptotic and mitotic cells were quantified (by a trained pathologist) inside non-necrotic tumor areas (5 fields at ×20 per tumor vossicle sample); VEH (n = 9) and AP (n = 11). (F) CXCL5 ELISA analysis of total protein lysates from VEH- (n = 10) and AP-treated (n = 11) tumor vossicles. (G) Graphs depicting the correlation between CXCL5 protein (determined by ELISA) and tumor weight. The Pearson correlation coefficient (r) and P values are indicated. Data in C, E, and F are mean ± SEM; *P < 0.05, **P < 0.01, #P < 0.001 (2-tailed Student’s t test).
As described above (Figure 1), in vitro results showed that CXCL5 was highly induced in macrophages upon efferocytosis of cancer cells. CXCL5 expression has been shown to correlate with prostate cancer progression and metastasis and is associated with stromal inflammation (32). To investigate whether expression of proinflammatory CXCL5 correlates with the induction of apoptosis in AP-treated mice, total protein from tumor vossicles was collected and analyzed by ELISA. As observed in Figure 4F, a significant increase in CXCL5 was detected in the AP-treated group, aligning with induction of apoptosis and consequent efferocytosis. A significant correlation between tumor weight and CXCL5 concentrations was found for both VEH- and AP-treated tumor vossicle groups (Figure 4G).
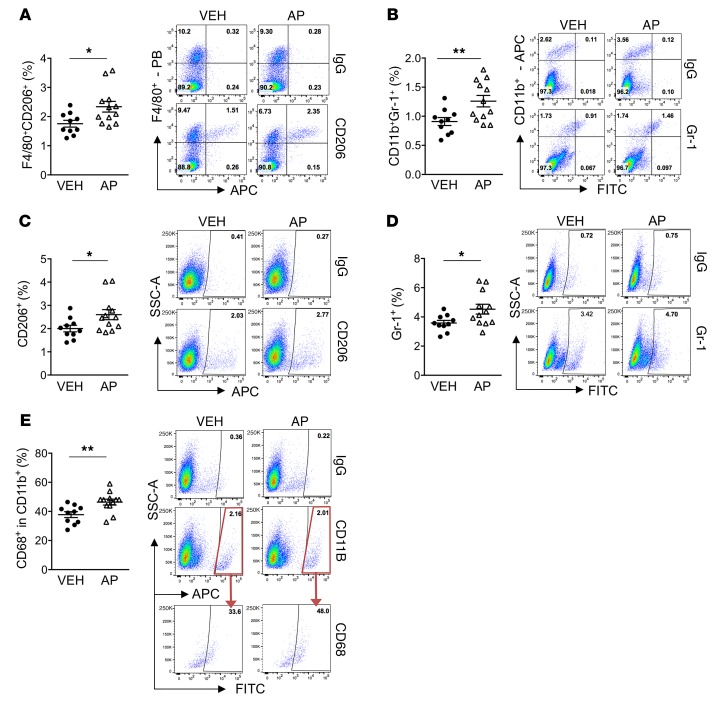
The immune cell composition of tumor vossicles was analyzed via flow cytometry. The AP-treated group (induced efferocytosis) showed significantly increased F4/80+CD206+ myeloid cells (Figure 5A), which characterizes M2-like macrophages (33). Other myeloid cells also showed increased infiltration in the AP-treated tumor vossicles, including: CD11b+Gr-1+ (monocytic/granulocytic cells associated with tumor progression and antitumor immunity) (34, 35) (Figure 5B), total CD206+ and Gr-1+ (characterizes inflammatory monocytes/granulocytes; ref. 36) (Figure 5, C and D), and CD68+ within the CD11b+ population (marker of phagocytic myeloid cells; aligns with higher efferocytosis induced by apoptosis) (Figure 5E). Other flow results are shown in Supplemental Figure 3A. Furthermore, whole blood count of VEH- and AP-treated mice revealed no significant differences (Supplemental Figure 3B), suggesting that the results observed in the tumor microenvironment are local and not related to general changes in the circulating monocytes/neutrophils.
Figure 5. Increased tumor-accelerating myeloid inflammatory cells in AP-treated tumor vossicles.
Thirteen days after vossicle implantation, tumor cell populations were analyzed by flow cytometry in VEH (n = 10) and AP (n = 12) groups. Gates were established according to IgG isotype controls for each antibody. Graphs and representative plots are shown for each group. (A–E) Tumor populations of F4/80+CD206+ cells (A), CD11b+Gr-1+ cells (B), CD206+ cells (C), Gr-1+ cells (D), and CD68+ fraction in CD11b+ cells (E). PB, Pacific Blue (Bio-Rad). Data represent the mean ± SEM; *P < 0.05, **P < 0.01 (2-tailed Student’s t test). Additional flow results are shown in Supplemental Figure 3A.
CXCL5, a crucial inflammatory-microenvironment cytokine that accelerates tumor progression.
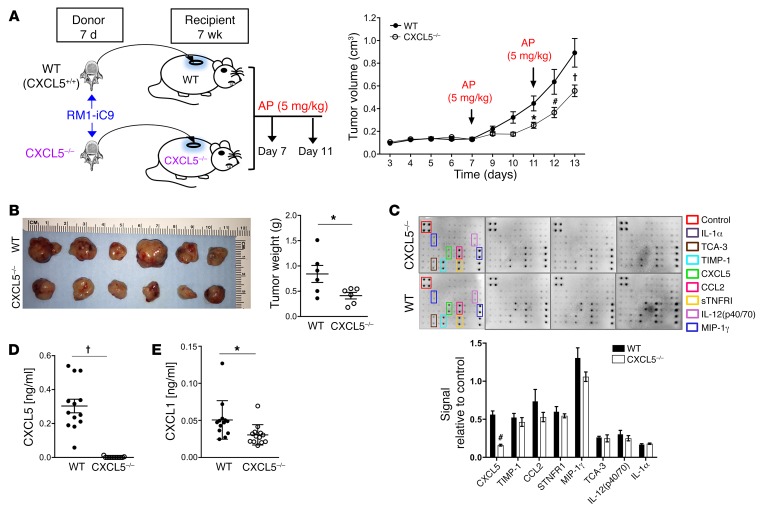
As CXCL5 was found to increase with cancer cell death and efferocytosis in the tumor microenvironment, the specific role of CXCL5 was addressed using CXCL5–/– mice in the vossicle implant model. To avoid any possible compensation with CXCL5 produced by immune cells, vossicles from CXCL5–/– mice were inoculated with the RM1-iC9 cells and implanted in CXCL5–/– mice. Similarly, WT (CXCL5+/+) vossicles were implanted in WT mice (Figure 6A). To induce apoptosis and efferocytosis and hence increase the expression of CXCL5 (in accordance with results in Figure 4), both groups were injected with AP at days 7 and 11 as described. Figure 6A and Supplemental Figure 4A demonstrate tumor growth deceleration in the CXCL5–/– mice compared with WT, and CXCL5–/– mouse tumors had significantly reduced weight at study end (Figure 6B).
Figure 6. Prostate cancer growth in bone vossicles is hindered in CXCL5–/– mice.
(A) WT (CXCL5+/+) and CXCL5–/– recipient mice (7wk males) were implanted subcutaneously with RM1-iC9 inoculated vossicles isolated from WT or CXCL5–/– donor mice (7d males), respectively. Recipient mice from both groups were treated with AP at days 7 and 11 to induce apoptosis. Tumor volumes were quantified. An independent experiment with similar results is shown in Supplemental Figure 4A. Data are mean ± SEM; *P < 0.05, #P < 0.001, †P < 0.0001 vs. WT controls (2-way ANOVA). (B) Gross image of tumors and graph of quantified tumor weights; n = 6 per group. (C) Total protein lysates of tumor vossicles from WT and CXCL5–/– mice were analyzed via inflammatory cytokine array. Quantification of cytokines expressed is represented as signal relative to the positive controls in the array; n = 4 independent arrays per group. (D and E) Protein lysates were analyzed by ELISA for the expression of CXCL5 (D) and CXCL1 (E) in the tumor vossicles of WT and CXCL5–/– mice; n = 13 per group. Data in B–E are mean ± SEM; *P < 0.05, #P < 0.001, †P < 0.0001 (2-tailed Student’s t test).
Proinflammatory cytokine profiling in tumors from WT and CXCL5–/– mice revealed that CXCL5 was the only cytokine that was significantly different with distinctively lower levels in the CXCL5–/– mice (Figure 6C). These results were confirmed by ELISA (Figure 6D) and demonstrate that the major contribution of CXCL5 in the tumor microenvironment originated from the host and not from the tumor. However, since the cytokine array has limited detection, a more sensitive ELISA revealed a significant decrease in CXCL1 levels (Figure 6E). This may be explained by reduced inflammation in CXCL5–/– mice as a consequence of strikingly lower CXCL5 levels. These findings suggest a crucial role of host-derived CXCL5 in prostate cancer tumor progression in the bone microenvironment.
Apoptotic cells were counted inside the non-necrotic tumor sections, and no differences were found (Supplemental Figure 4B), which confirmed that AP treatment induced apoptosis in WT and CXCL5–/– vossicles similarly. There were no differences in mitotic cell numbers even though tumor growth was reduced. This could be due to a temporal effect, since the analysis of the tumors was performed at the experimental endpoint (2 days after AP treatment), which does not account for earlier differential effects in tumor growth.
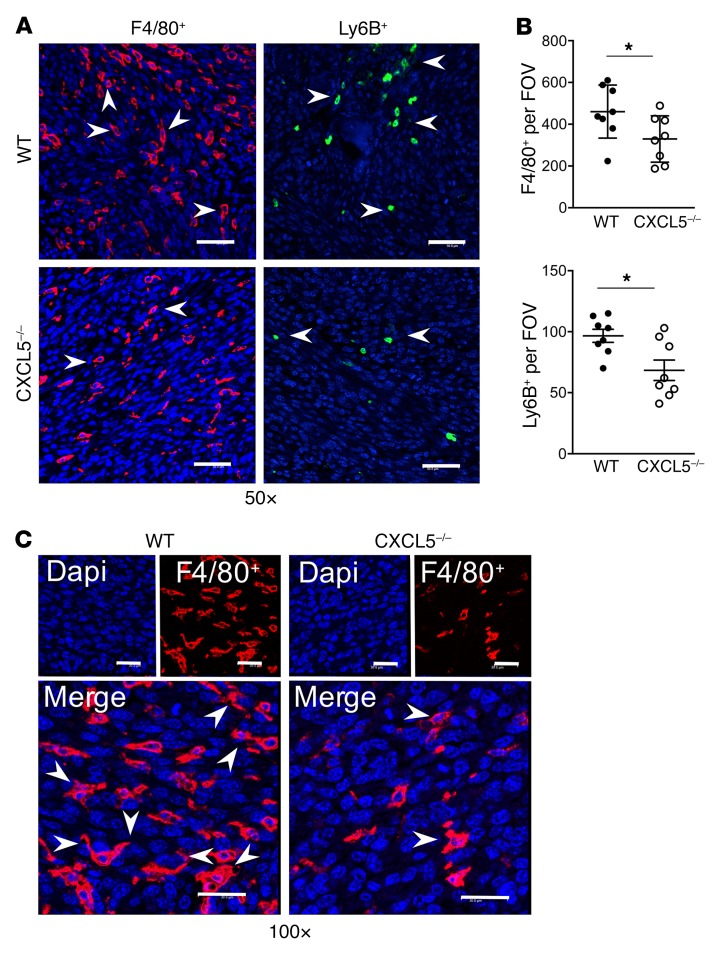
Fluorescence IHC of sections inside the tumor vossicles was performed. While areas inside the tumor vossicles were highly infiltrated by inflammatory F4/80+ macrophages (red) and Ly6B+ cells (green) (Figure 7A), quantitative analysis revealed that CXCL5–/– mice exhibited fewer F4/80+ macrophages and Ly6B+ inflammatory cells (Figure 7B). Figure 7C depicts the engulfing morphology observed in some macrophages when interacting with large nuclei, typical of tumor cells in comparison with the smaller nuclei of macrophages (37).
Figure 7. F4/80+ and Ly6B+ infiltration into tumor vossicles is hindered in CXCL5–/– mice.
(A) Representative fluorescence images of F4/80+ (Opal 570) and Ly6B+ (Opal 520) cells in tumor vossicle sections from WT and CXCL5–/– mice at ×50 original magnification (scale bars: 50 μm). (B) Quantification of F4/80+ and Ly6B+ staining (4 fields at ×10 per tumor vossicle sample); n = 8 per group. (C) Macrophage morphology at ×100 original magnification (scale bars: 30 μm) showing some MΦs with extended arms (engulfing-like shape) surrounding large nuclei (blue, DAPI) typical of cancer cells. Image depicts the WT and CXCL5–/– MΦs (red) infiltrating the tumor. Data in B are mean ± SEM; *P < 0.05 (2-tailed Student’s t test).
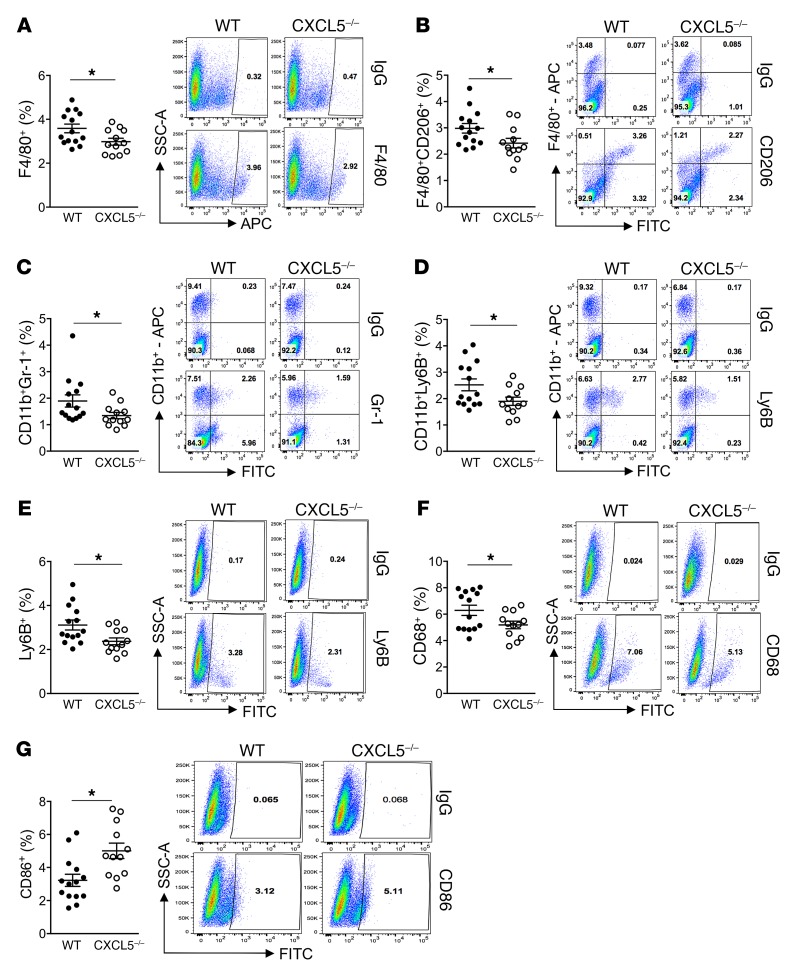
Cell analysis of tumor vossicles via flow cytometry revealed significantly reduced F4/80+ macrophages, F4/80+CD206+ M2-like macrophages, and CD11b+Gr-1+ myeloid cells in CXCL5–/– mice (Figure 8, A–C), as well as reduced CD11b+Ly6B+ and total Ly6B+ inflammatory cells (Figure 8, D and E). These results align with the IHC findings (Figure 7) and the in vitro data (Supplemental Figure 2E), in which Ly6B was increased via efferocytosis and in correlation with inflammation. Furthermore, a decrease in total CD68+ phagocytic macrophages (the majority also F4/80+) was observed (Figure 8F). In contrast, an increase in cells expressing the T lymphocyte–activating antigen CD86+ was detected in the CXCL5–/– tumor vossicles (Figure 8G). Additional flow results are shown in Supplemental Figure 4C. Interestingly, the blood count of mice bearing tumor vossicles revealed significantly lower concentrations of leukocytes, lymphocytes, and monocytes in WT versus CXCL5–/– mice, where CXCL5–/– mice demonstrated values within the normal range (Supplemental Figure 4D). These findings suggest that increased recruitment of inflammatory cells into the tumors of WT mice may be responsible for a reduction of these cells in circulation, an effect that was not observed in WT mice or alleviated in CXCL5–/– mice.
Figure 8. Flow cytometry analysis of WT and CXCL5–/– tumor vossicles.
Changes in tumor vossicle cell populations of F4/80+ cells (A), F4/80+CD206+ cells (B), CD11b+Gr-1+ cells (C), CD11b+Ly6B+ cells (D), Ly6B+ cells (E), CD68+ cells (F), and CD86+ cells (G) in WT (n = 14) and CXCL5–/– (n = 12) mice are represented. Gates were established according to IgG isotype controls for each antibody. Representative plots for each group are shown. Additional flow results are shown in Supplemental Figure 4C. Data are mean ± SEM; *P < 0.05 (2-tailed Student’s t test).
For more in-depth analyses, flow cytometric results were compared between tumor vossicles and bone marrow myeloid cells from tumor-free WT and CXCL5–/– mice. In the bone marrow of the CXCL5–/– mice the percentages of Gr-1, Ly6B, Ly6C, Ly6G, and CD11b myeloid cells were higher than in WT mice (Supplemental Figure 5A). These findings agree with the previously reported increase in Gr-1+ cells in CXCL5–/– mice and the suggested role of this cytokine in bone marrow neutrophil homeostasis (38). Increased numbers of neutrophils were also found in the blood of CXCL5–/– mice relative to WT, but no changes in other leukocytes were observed (Supplemental Figure 5B). In contrast, the bone marrow analysis of tumor-free mice showed a significantly lower percentage of CD86+ and no changes in total F4/80+ cells (Supplemental Figure 5A). Since the intratumoral changes in myeloid cell populations are skewed in the opposite direction relative to tumor-free bone marrow, the differences observed in the tumor infiltration are not likely related to overall changes in the normal bone marrow of these mice; instead these changes highlight tumor environment specificity.
Altogether these findings demonstrate the critical role of the CXCL5 produced by the efferocytic macrophage as an inducer of inflammation-accelerating tumor growth in the bone microenvironment.
Cancer cell death induces accelerated tumor growth and bone destruction, while CXCL5 deficiency hinders tumor progression.
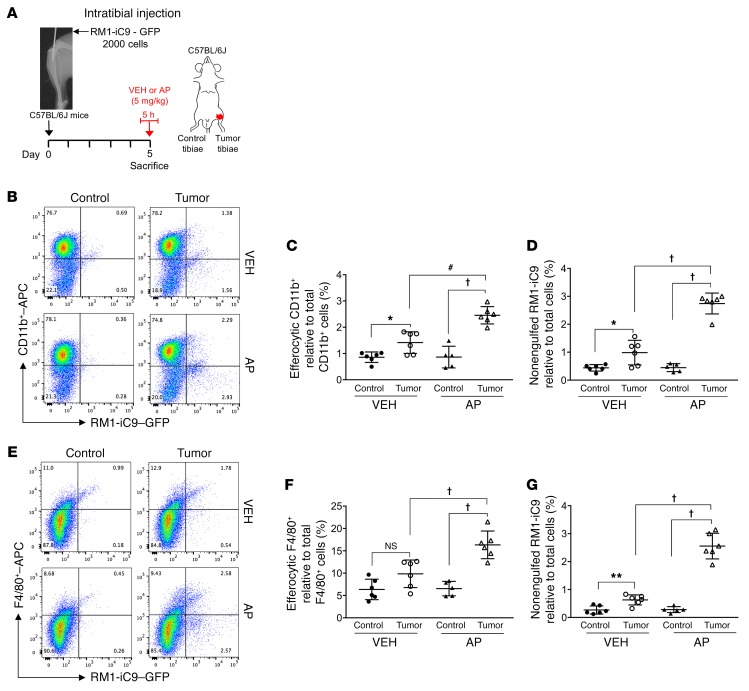
Since the accelerated growth of cancer RM1-iC9 cells in the osseous vossicle model resulted in a large proportion of cells growing outside the bone, the effect of cancer cell death in tumor progression was further analyzed in an intratibial inoculation model. Engulfment of cancer cells after apoptosis induction mediated by AP treatment was evaluated. RM1-iC9 cells were GFP-labeled upon transfection with a lentiviral reporter construct prior to their inoculation into the left tibia of mice. Mice were randomized into groups treated with AP or VEH for 5 hours at day 5 after cancer inoculation (Figure 9A). Following this treatment, the bone marrow cells of the left tibia (tumor-inoculated) and the contralateral right tibia (control) were isolated and analyzed by flow cytometry using APC-labeled CD11b or F4/80 antibodies. The CD11b+GFP+ or F4/80+GFP+ populations in Figure 9, B and E, indicate the CD11b+ or F4/80+ efferocytic cells (engulfing cancer cells), respectively. Representative VEH and AP (tumor-inoculated) and corresponding contralateral (control) bone marrow cell plots are shown (Figure 9, B and E). APC-labeled IgG isotype control antibodies for both CD11b and F4/80 were used to determine the gates and representative plots (Supplemental Figure 6, A and B). The percentages of engulfing CD11b+ or F4/80+ cells were calculated for tumor-inoculated and control tibiae relative to total CD11b+ or F4/80+ cells, respectively. Engulfing CD11b+ and F4/80+ cells increased in the bone marrow of AP-treated tumor tibiae (AP-Tumor) relative to VEH-treated tumor (VEH-Tumor) or their controls (Figure 9, C and F). Furthermore, increased CD11b+ engulfing cells were observed in the VEH-Tumor relative to VEH-Control (Figure 9C), while no significant difference was found in the F4/80+ engulfing population (Figure 9F). No differences were found in any bone marrow population between VEH-Control and AP-Control (contralateral) tibiae (Figure 9, C and F).
Figure 9. Engulfment of apoptosis-inducible RM1-iC9 cancer cells in the mouse model of intratibial inoculation.
(A) Experimental schematic. GFP-labeled RM1-iC9 cells (2 × 10³) were inoculated in the left tibiae of C57BL/6J mice. Mice were randomized at day 5 (postinjection), divided into 2 groups, VEH- or AP-treated, for 5 hours, then sacrificed. Bone marrow cells were isolated and analyzed by flow cytometry using APC-labeled CD11b or F4/80 antibodies. (B) Representative flow cytometry plots corresponding to bone marrow cells isolated from tumor-inoculated and contralateral control tibiae stained with CD11b-APC antibody. (C) Percentage of CD11b+GFP+ (efferocytic) cells relative to total CD11b+ cells in the bone marrow population isolated for each tibia. (D) Percentage of nonengulfed GFP+ RM1-iC9 cancer cells relative to total bone marrow population for each tibia. (E–G) Corresponding plots and analyses similar to B–D, respectively, but using the F4/80-APC antibody; n = 6 mice per group with the exception of AP-Control (n = 5). Gates were established according to APC-labeled IgG isotype controls (see Supplemental Figure 6, A and B, for gating scheme). Data are mean ± SEM; *P < 0.05, **P < 0.01, #P < 0.001, †P < 0.0001 (1-way ANOVA).
The percentage of nonengulfed GFP+ RM1-iC9 cells was calculated relative to total cells. While higher numbers of GFP+ RM1-iC9 cells were observed in the bone marrow of all tumor tibiae relative to control, AP treatment significantly increased this population when compared with VEH, indicating rapid growth of cancer cells after AP treatment (Figure 9, D and G).
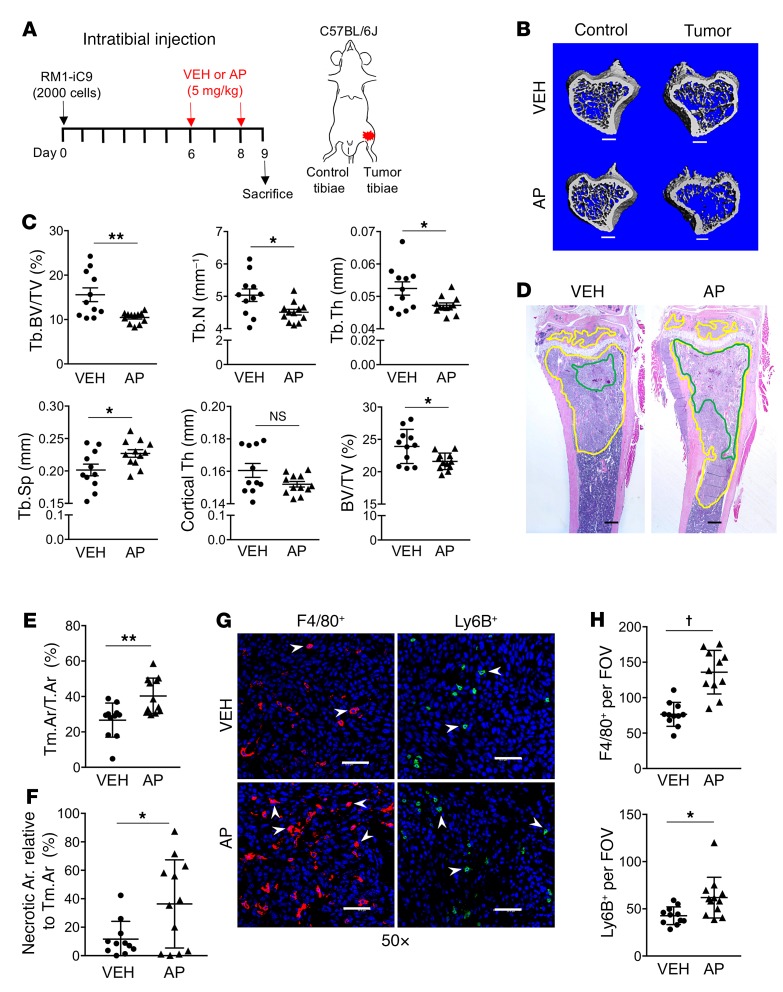
To further understand the effects of cancer cell apoptosis and subsequent efferocytosis on tumor progression and bone remodeling, the RM1-iC9 cells were inoculated via intratibial injection (day 0) and treated with VEH or AP at days 6 and 8 (Figure 10A). Tibiae (tumor-inoculated and control) were collected at day 9 and analyzed by micro–computed tomography (μCT). The analysis of AP-Tumor tibiae showed significant reduction in trabecular and total bone volume and reduced trabecular number and thickness with a corresponding increase in trabecular spacing relative to VEH-Tumor (Figure 10, B and C). No changes were observed in the cortical bone (Figure 10C). These results suggest that escalated bone osteolysis was induced by increased tumor growth via amplified efferocytosis and the predominant osteolytic nature of RM1 cells. However, to exclude the possibility that differences in bone volume could be due to an effect of AP in nontumor cells, μCT analysis revealed no differences in bone between VEH-Control and AP-Control contralateral tibiae (Supplemental Figure 7), confirming that the differences observed between AP and VEH in the tumor are a result of the tumor-induced osteolysis mediated by cancer cell apoptosis. Furthermore, osteoclast tartrate-resistant acid phosphatase–positive (TRAP+) staining measured in bone inside the tumors (regions of interest [ROIs] depicted in Supplemental Figure 8A) demonstrated no differences in either osteoclast surface per bone surface or osteoclast number per bone surface (Supplemental Figure 8B), suggesting that the changes in trabecular and total bone volume are concomitant with osteolytic activity but not with increased osteoclast numbers.
Figure 10. Cancer cell death induces accelerated tumor growth and bone osteolysis in the intratibial tumor model.
(A) Experimental schematic. Mice injected with RM1-iC9 cells were randomized before VEH or AP treatment. (B) Representative μCT images showing trabecular bone in VEH and AP cancer-inoculated tibiae and the corresponding contralateral controls (nontumor) (scale bars: 400 μm). (C) Bone parameters quantified by μCT: trabecular bone volume relative to total volume (Tb.BV/TV), trabecular number (Tb.N), trabecular thickness (Tb.Th), trabecular spacing (Tb.Sp), cortical thickness (Cortical Th), and total bone volume relative to total volume (BV/TV); VEH (n = 11) and AP (n = 12). (D) Representative images of H&E sections of tumor-inoculated VEH and AP tibiae. Tumor areas are highlighted in yellow and necrosis in green (scale bars: 400 μm). (E) Quantification of tumor area relative to total bone area (Tm.Ar/T.Ar). (F) Necrotic area relative to tumor area inside the bone. (G) Images inside the tumor areas of sections stained using F4/80 and Ly6B antibodies for VEH and AP (×50) (scale bars: 200 μm). (H) Quantification of F4/80+ (n = 11 per group) and Ly6B+ VEH (n = 11) and AP (n = 12) staining (3 fields inside tumor area at ×20 per sample). Data are mean ± SEM; *P < 0.05, **P < 0.01, †P < 0.0001 (2-tailed Student’s t test).
Changes in the bones of AP-Tumor tibiae relative to the VEH-Tumor were correlated with the increased tumor progression seen in the AP-treated vossicle model. Tumor areas normalized to total bone area demonstrated that tumors were larger in AP-treated mice compared with VEH (Figure 10, D and E). The percentage of necrosis calculated as the ratio of necrotic areas divided by the total tumor area inside the bone demonstrated that increased tumor necrosis is induced by AP (Figure 10, D and F). These results suggest that the induction of apoptosis, resulting in larger tumors, also induces necrosis, perhaps enhanced by the limited capacity of macrophages to effectively clear the large proportion of apoptotic cells at an advanced stage of tumor growth. Consistent with the induction of apoptosis by AP, IHC inside the tumor revealed increased numbers of F4/80+ and Ly6B+ cells suggesting increased inflammation in tumors where cell death was stimulated (Figure 10, G and H).
Altogether these experiments demonstrated that induction of apoptosis with AP increased efferocytosis, rapidly stimulated cancer growth in the bone, and increased bone osteolysis.
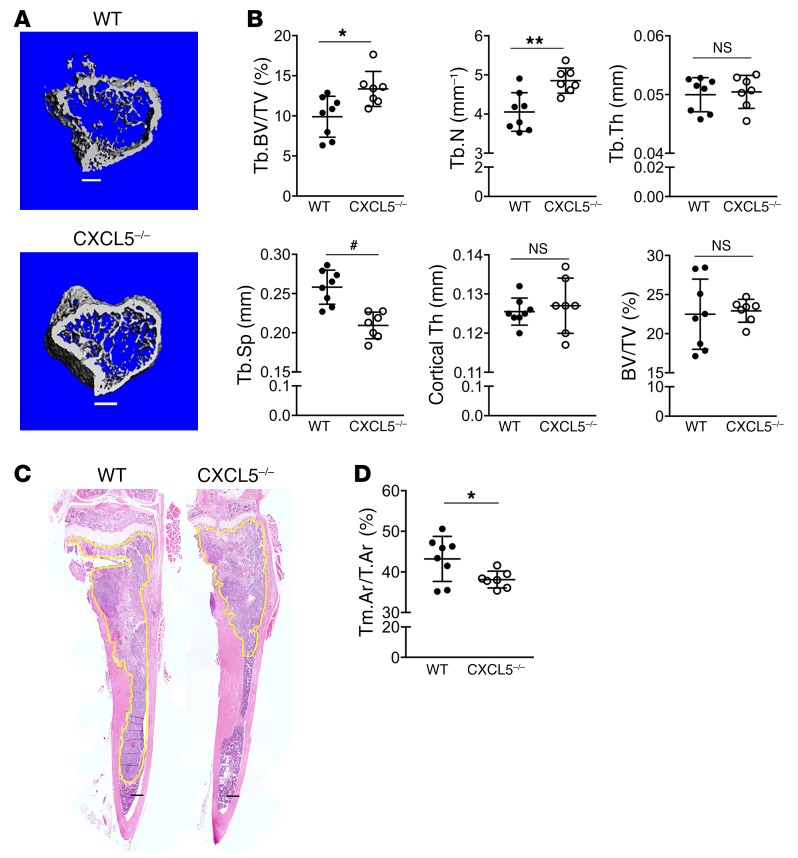
Next, the role of CXCL5 in inducing tumor acceleration was investigated. An experiment comparing tumor growth in the bones of WT (CXCL5+/+) and CXCL5–/– mice was performed. Using the same approach described above (Figure 10A), RM1-iC9 cells were inoculated via intratibial injection in 6-week-old mice. To maximize proinflammatory CXCL5 expression, WT and CXCL5–/– mice were treated with AP to induce cancer cell apoptosis. At endpoint, μCT analysis was performed on tumoral tibiae. CXCL5-deficient mice had significantly higher trabecular bone volumes relative to WT, increased trabecular numbers, and reduced trabecular spacing (Figure 11, A and B).
Figure 11. CXCL5 deficiency hinders tumor growth and bone osteolysis in the intratibial model.
Both WT (n = 8) and CXCL5–/– (n = 7) mice were inoculated with RM1-iC9 cells via intratibial injection and treated with AP, similarly to Figure 10A. (A) Representative μCT images showing trabecular bone in the tumor tibiae for WT and CXCL5–/– mice (scale bars: 400 μm). (B) Bone parameters were quantified by μCT in tumor-injected tibiae for WT and CXCL5–/–, similarly to Figure 10C. (C) Representative images of H&E sections for WT and CXCL5–/– tibiae. Tumors are highlighted in yellow (scale bars: 400 μm). (D) Quantification of tumor area relative to total bone area (Tm.Ar/T.Ar). Data are mean ± SEM; *P < 0.05, **P < 0.01, #P < 0.001 (2-tailed Student’s t test).
H&E-stained tumor sections showed reduced tumor areas in CXCL5–/– mice relative to WT (Figure 11, C and D), confirming the proinflammatory role of CXCL5 induced by efferocytosis of apoptotic cancer cells.
Nonclassical (CD16+) phagocytic peripheral blood mononuclear cells and CXCL5 serum levels associated with human prostate cancer skeletal metastasis.
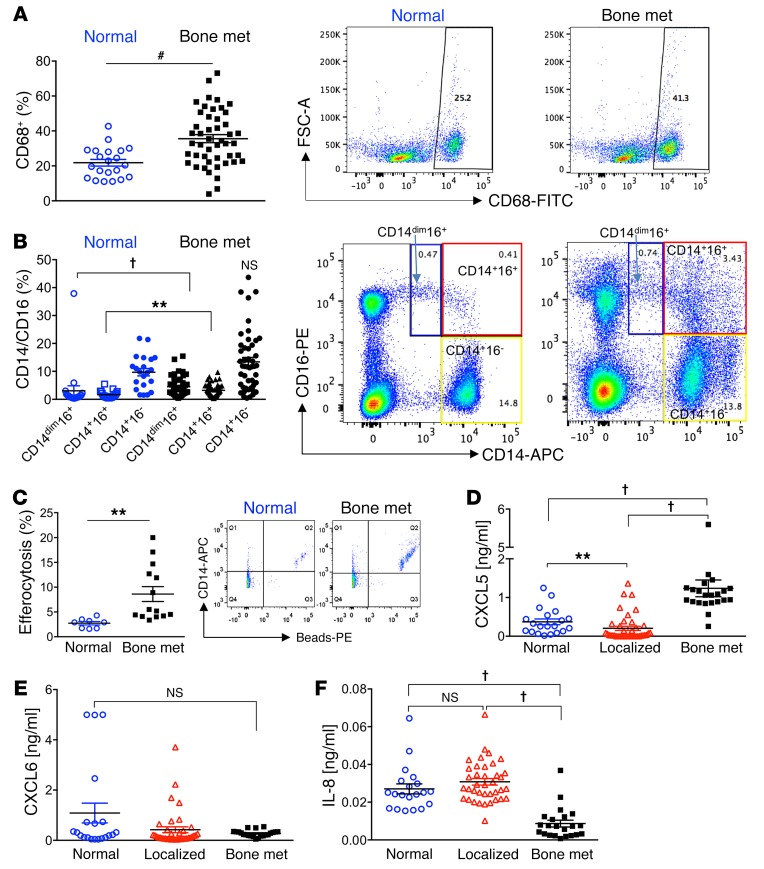
Peripheral mononuclear cells serve as circulating immune cells in the blood recruited to replenish tissue-resident cells. A previous study reported that CD16+ (nonclassical) monocytes presented a significant enrichment in genes involved in cytoskeletal arrangement and phagocytosis (39, 40). In response to the findings in the skeletal metastatic experimental model, we hypothesized that prostate cancer bone-metastatic patients would have increased circulating phagocytic monocytes compared with controls due to the presence of circulating tumor cells. Flow cytometric analysis of peripheral blood samples revealed that bone-metastatic patients (characteristics in Supplemental Table 1) harbored increased circulating CD68+ (a phagocytic marker) cells compared with healthy controls (Figure 12A). These patients also had increased mononuclear CD14+CD16+ and CD14dimCD16+ cells (a patrolling monocyte subset) (ref. 41 and Figure 12B). Both of these populations express CD68 (Supplemental Figure 9A). However, no significant differences were identified in the classical CD14+CD16– mononuclear population. The average age in male control (noncancer) patients was lower than in the bone-metastatic patients (Supplemental Figure 9B), but no significant correlation was found inside each group between the ages and the percentages of the different populations: CD68+, CD14dimCD16+, CD14+CD16+, and CD14+CD16– (Supplemental Figure 9C). Other studies have suggested that monocytes expressing both CD14 and CD16 are elevated in patients with cancer (42). To investigate the efferocytic capabilities of freshly isolated mononuclear cells from prostate cancer bone-metastatic patients compared with control, cells were cultured with phosphatidylserine-coated apoptotic-mimicry beads. Monocytes (CD14+) isolated from patients with prostate cancer skeletal metastases had significantly greater efferocytosis (double-positive for beads and CD14) compared with cells from normal (noncancer) patients (Figure 12C).
Figure 12. Nonclassical (CD16+) peripheral blood mononuclear cells and CXCL5 serum levels are associated with human prostate cancer skeletal metastasis.
(A–C) Mononuclear cells were isolated from whole peripheral blood of noncancer (Normal, n = 21) and prostate cancer bone-metastatic patients (Bone met., n = 47). Monocyte populations were assessed via flow cytometry. (A) CD68+ monocytes were assessed, and representative FACS images are displayed at right. (B) Subpopulations of CD14dimCD16+ (blue boxes), CD14+CD16+ (red boxes), and CD14+CD16– (yellow boxes) were gated from total cell populations and quantified for Normal and Bone met. samples. Representative FACS plots are shown. (C) Freshly isolated monocytes (CD14+) from normal (n = 8) and prostate cancer bone-metastatic (n = 14) patients were cultured with phosphatidylserine-coated fluorescently labeled apoptotic-mimicry beads (3:1) and efferocytosis assessed by flow cytometry for CD14+ (APC+) cells with ingested beads (representative FACS plots are shown). (D–F) Human serum isolated from normal (n = 20), localized (high-risk) prostate cancer (Localized, n = 40), and bone-metastatic prostate cancer (Bone met., n = 22) patients was analyzed by ELISA for CXCL5 (D), CXCL6 (E), and IL-8 (F). CXCL6 and IL-8 analysis included n = 38 for Localized. Data are mean ± SEM; **P < 0.01, #P < 0.001, †P < 0.0001 (Wilcoxon 2-sample test and Kruskal-Wallis test with Bonferroni’s correction).
Consistent with these results, we hypothesized that phagocytic monocytes/macrophages would increase serum levels of the inflammatory CXCL5 cytokine in bone metastasis patients because of tumor cell clearance both in circulation and in the bone marrow compartment. A cohort of serum samples from patients with progressive advanced castration-resistant prostate cancer metastatic to bone with multiple lesions (≥3 lesions), with no prior chemotherapy for metastatic disease and no signs of ongoing infection or another malignant disease, was analyzed (Supplemental Table 2). These samples were compared with cohorts of patients with either localized high-risk prostate cancer or noncancer patients. The age distribution from each group is shown in Supplemental Figure 10A. All samples were analyzed by ELISA to measure 3 closely related cytokines: CXCL5, CXCL6 (a human cytokine homologous to mouse CXCL5), and IL-8 (CXCL8). Human IL-8 is a proinflammatory cytokine with no direct murine homolog, suggested to be functionally homologous with murine CXCL1, CXCL5, and CXCL6 (43). Intriguingly, normal samples displayed significantly higher serum CXCL5 relative to localized cancer samples (Figure 12D). Importantly, considerably higher levels of CXCL5 were detected in the serum of bone-metastatic patients compared with other groups, while no significant differences were observed for CXCL6 (Figure 12E). Contrary to the CXCL5 results, serum samples from bone-metastatic patients showed significantly reduced IL-8 concentrations relative to normal and localized samples (Figure 12F). Furthermore, no significant correlation was found between the CXCL5 or IL-8 serum concentrations and the age of patients for each group, respectively (Supplemental Figure 10B). Altogether these findings suggest the predominant role of proinflammatory CXCL5 in prostate cancer bone metastasis in concert with the increased phagocytic circulating CD68+CD14+CD16+ monocytic cell population.
Discussion
Persistent inflammation in the tumor microenvironment is a common denominator of cancer progression characterized by the infiltration of myeloid cells that facilitate tumor expansion and metastasis (44). Chronic inflammation increases cell stress and tissue damage, which induces apoptotic/necrotic cell death. Consequently, several aggressive tumors are characterized by high apoptotic rates, which are often underestimated as a result of efficiency of clearance (efferocytosis) (11). Efferocytosis is a fundamental function of professional phagocytes (mainly macrophages) and an essential mechanism of normal tissue homeostasis that also prevents inflammation. However, here we present new evidence suggesting that the response of bone marrow macrophages when engaged in efferocytosis of prostate cancer cells differs from the response when engaged with cells that bone marrow macrophages would normally encounter, such as osteoblasts and stromal cells.
Cancer cell efferocytosis was found to induce an inflammatory response in macrophages characterized by the expression of CCL5, CXCL1, CXCL5, and IL-6, which have been correlated with tumor inflammation mechanisms and metastasis in several cancer types (45, 46). Accordingly, these findings suggest that the induction of efferocytosis leads to activation of NF-κB(p65) and Stat3 signaling and proinflammatory cytokine expression. Blocking NF-κB(p65) or Stat3 signaling mitigated the expression of inflammatory cytokines in macrophages, while simultaneous inactivation of these pathways blocked the efferocytic function of macrophages. Since neither Stattic nor Bay11-7082 inhibited efferocytosis when used alone, these findings further suggest that these two pathways are not only activated by efferocytosis, but are critical components of this mechanism, where at least one has to be fully active for this essential function of macrophages. In accordance, NF-κB(p65) and Stat3 are steadily activated in immune cells, where they selectively regulate each other to trigger amplification loops that stimulate the production of protumor inflammatory factors (7, 24, 25). It has been suggested that continuous activation of Stat3 is a prerequisite for these tumor-promoting immune responses (47). Furthermore, activation of Stat3 by efferocytosis mediates the M2-like polarization of bone marrow macrophages (12). In vivo studies in breast and colon cancer showed that efferocytosis induced M2 polarization and metastasis, while increased cell death correlated with poorer outcomes (13, 48). Moreover, the proinflammatory cytokine IL-6 induced M2-like macrophage polarization in human macrophages (49). Our findings suggest that efferocytosis induces tumor-promoting inflammation mediated by the persistent activation of Stat3 and NF-κB(p65) in macrophages.
The bone marrow is a myeloid-rich microenvironment for seeding and colonization of metastatic cells. Using apoptosis-inducible murine RM1 prostate cancer cells and bone vossicles as a syngeneic model of osseous environmental tumor growth, it was demonstrated that induced cancer death accelerated tumor progression. RM1 cells were chosen in this study as these cells are derived from prostate epithelium of C57BL/6J mice and overexpress the Ras and Myc oncogenes, which resembles the oncogene-specific gene expression signatures of prostate cancer patient samples and is associated with prostate cancer progression (50, 51). The vossicle model provides an osseous scaffold for tumor growth where cancer cells are implanted directly in the interacting bone niche. This interaction between tumor and bone is critical, especially at the early stages of tumor growth. The importance of bone in the vossicle serving as scaffold was demonstrated in previous experiments in which tumor growth was accelerated in the vossicles isolated from a Gas6–/– mouse relative to controls after implantation in the same host. In these experiments tumor growth was assessed in vossicles where tumors overgrew the bone scaffolds (31). Another example of the vossicle model highlighting the bone microenvironment in tumor progression revealed that ablation of the osteoblast niche hindered prostate cancer growth in tumor vossicles (17). Furthermore, it was recently reported that macrophage ablation decelerated tumor growth using the RM1/vossicle model (9).
Elevated numbers of apoptotic cells were observed in the tumor vossicles where apoptosis was induced, and cell death induced a higher percentage of F4/80+CD206+ (M2-like) macrophages in tumors, which correlates with increased polarization induced by efferocytosis (12). Furthermore, CD11b+Gr-1+ cells, expressing markers of myeloid-derived suppressor cells (MDSCs), were also increased in tumors where cell death was induced. Although overlapping values of different immune cell populations were detected by flow cytometry between VEH- and AP-treated groups, this could be explained by the significant level of apoptosis found in RM1-iC9 control tumors and/or the possibility that AP treatment did not equally reach all cancer cells because of the complexity of large tumors. For similar reasons, a high variability in the CXCL5 concentrations was detected in the tumors linked to the various levels of apoptosis, which would overlap in some cases with controls. While we cannot exclude the important role of other proinflammatory cytokines, the critical role of CXCL5 is further supported by the significant correlation found between CXCL5 levels and tumor weight.
Other studies have identified CXCL5 as a predictor for bone-metastatic prostate cancer (52), and in a breast cancer metastatic model it was shown that this cytokine is a factor secreted by tumor-associated osteoblasts to function as an inducer of epithelial-to-mesenchymal transition and metastasis (53). Furthermore, in a model of rhabdomyosarcoma, it was demonstrated that antibody-mediated neutralization of CXCR2 (a receptor for CXCL5) enhanced anti-PD1 effectiveness by preventing the tumor infiltration of the CD11b+Ly6Ghi suppressor cells (54). However, none of these works identified the proinflammatory efferocytic macrophage as a trigger of tumor growth in the bone microenvironment.
Using the CXCL5–/– mice in a syngeneic tumor vossicle model delineated the crucial role of host-derived CXCL5 in the mechanism of cell death–induced tumor progression. CXCL5 deficiency significantly inhibited tumor progression in bone vossicles. Although the cytokine array might have missed other cytokines represented at lower concentrations, CXCL5 was expressed at considerable levels, and the major contribution was from the host microenvironment and not the cancer cells. Intriguingly, ELISA analysis showed reduced levels of CXCL1 in CXCL5–/– vossicles versus WT. Although CXCL1, a cytokine that interacts with the same receptor (CXCR2) as CXCL5, was expressed at lower levels in the tumor in comparison with CXCL5, these results are consistent with reduced cell death–induced inflammation mediated by CXCL5 deficiency in the vossicles.
Analysis of CXCL5–/– tumor vossicles revealed reduced percentages of M2-like (F4/80+CD206+) and phagocytic (CD68+F4/80+) macrophages as well as inflammatory Ly6B+ cells and granulocytic CD11b+Gr-1+ cells that characterize MDSCs, all of which aligns with reduced inflammation and efferocytosis and the role of CXCL5 as a crucial chemoattractant of MDSCs. Importantly, and in contrast, increased influx of CD86+ cells was identified within CXCL5–/– tumors as compared with WT. Recent findings using a mouse model of lung carcinoma demonstrated the role of CD86+ myeloid cells in the tumor microenvironment as mediators of the antitumoral effects of carbon monoxide treatment (55), where depletion of CD86+ cells with neutralizing antibody accelerated tumor growth. These results suggest that the reduced tumor progression shown in CXCL5–/– mice is at least partially due to increased CD86+ cells with antitumor activity.
Flow cytometry and IHC results included overlapping values within the F4/80, Ly6B, and CD86 populations between WT and CXCL5–/– mice, suggesting that other proinflammatory cytokines may play a role and partially compensate for the CXCL5 deficiency to support tumor growth. Nevertheless, the osseous vossicle model presented valuable information about the changes in immune cell populations infiltrating the tumors associated with the activation of apoptosis and efferocytosis and in correlation with tumor progression.
Mixed osteoblastic and osteolytic lesions occur in patients with metastatic prostate cancer, all characterized by aberrant bone remodeling where osteoblastic bone formation and signaling are linked to osteolytic bone resorption (56). Previous findings using RM1 cells showed that macrophage depletion decelerated tumor growth but had differential effects on bone, dependent on mode of depletion, suggesting that in bone metastasis, macrophages may be more important for tumor progression than their effects in the bone (9). In the present study with RM1-iC9 cancer cells, the apoptosis inducer AP increased apoptotic cell engulfment, which was accompanied by accelerated growth of cancer cells. This rapid in vivo increase in cancer cells after AP treatment was not observed in vitro in cocultures of macrophages and RM1-iC9 cells (no change in nonengulfed cancer cells relative to VEH controls) (Supplemental Figure 6C). This result could be associated with the activation of inflammation-mediated immunosuppression within the bone microenvironment, allowing cancer cells to grow faster in a debilitated immune environment.
The accelerated tumor progression in the bone reported here resulted in increased osteolysis, necrotic cell death, and inflammation as detected by increased F4/80+ and Ly6B+ cell infiltration. Previous in vivo studies in prostate cancer models suggest that activation of CD11b+Gr-1+ cells in the bone marrow was mediated by IL-6 to accelerate tumor progression (34, 35). These findings suggest that increased bone marrow macrophage infiltration into the tumors results in CXCL5 and other proinflammatory cytokines that facilitate recruitment and activation of CD11b+Gr-1+, which enhances immunosuppression and tumor growth. Similarly, AP-treated tumors in CXCL5-deficient mice resulted in decelerated tumor progression and osteolysis, supporting the critical role of this cytokine; however, the overlap variability detected in some tumor areas and bone volumes suggests a potential role of other efferocytosis-induced proinflammatory cytokines in tumor progression. Furthermore, because osteolytic bone destruction was predominantly found in the in vivo models used in these studies, these findings may not be fully applicable to the osteoblastic lesions observed in human skeletal metastases.
CD14+CD16+ monocytes account for only 8% of all monocytes and exhibit a higher rate of phagocytosis, which is associated with acute and chronic inflammation (57). In metastatic gastrointestinal carcinoma, patients exhibited a significant elevation in a unique CD16+ blood-monocyte population, which did not correlate with sepsis or bacterial infection (58). The presence of this monocyte subset predicted tissue invasiveness of cholangiocarcinoma and was elevated in patients with solid tumors. In the present study we analyzed phagocytic circulating blood monocytes (CD68+) that were either classical (CD14+CD16–), nonclassical (CD14+CD16+), or patrolling (CD14dimCD16+) in patients with prostate cancer bone metastasis and noncancerous control patients. While no difference was found in total CD14+CD16– monocytes relative to normal (noncancer controls), a significant increase was identified in the CD14+CD16+ and the CD14dimCD16+ (low CD14) monocytes in bone-metastatic patients with overlap in populations observed compared with normal controls, which may be related to the bone-metastatic disease being at different stages of progression. It is likely that at early stages of metastatic disease these values may be closer to normal, while more advanced metastatic disease would exhibit the highest increase in these cell populations. Although the CD14dimCD16+ monocytes have been shown to respond poorly to bacterial signals, they also express high levels of selected inflammatory cytokines in response to viruses via TLR7 and TLR8 (41). Studies on human monocytes indicated that CD14+CD16+ cells play an important role in inflammatory diseases such as rheumatoid arthritis (42), and a recent report suggests that these nonclassical monocytes display inflammatory features (59), which correlates with our findings showing increased CD68+CD14+CD16+ nonclassical phagocytic monocytes and proinflammatory CXCL5 in blood serum of bone-metastatic compared with normal (noncancer) patients. Our results further suggest an important role of both CD14dimCD16+ and CD14+CD16+ monocytes in metastasis-promoting inflammatory responses.
In mice, CXCL5 exhibits a predominant role in the neutrophil influx to the lung as a result of inflammation induced by LPS inhalation, which aligns with its role in human inflammatory diseases as a neutrophil chemoattractant (38). The expression of CXCL6, a human homolog of mouse CXCL5 (60), was significantly upregulated in prostate cancer tissues and correlated with high Gleason scores (≥7) (61). However, analysis of blood serum from prostate cancer bone-metastatic patients revealed differences in CXCL5 when comparing with normal or high-risk localized cancer, while no significant differences were observed for CXCL6. Recently it has been proposed that murine CXCL5 is the functional homolog of human IL-8 (62); however, contrary to the findings with human CXCL5, the analysis of IL-8 serum levels in the same patient cohort showed higher IL-8 expression in the serum of noncancer and localized cancer relative to the bone-metastatic group. Further analysis with human macrophages will provide clues and help clarify the production of such cytokines induced by efferocytosis.
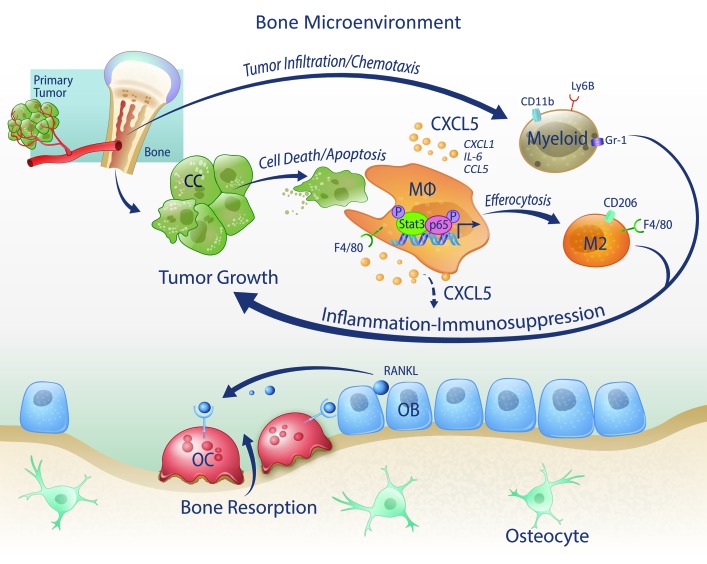
In summary, these findings reveal a new mechanism by which the clearance of dying tumor cells by macrophages induces persistent inflammation in the tumor bone microenvironment via expression of CXCL5 and other proinflammatory cytokines to facilitate cancer progression (Figure 13). Since enhanced cell death and efferocytosis are produced by cancer therapies, the identification of CXCL5 as a crucial factor in this mechanism provides an important clue for designing additional successful therapies.
Figure 13. Model of efferocytosis-induced prostate cancer tumor growth in the bone microenvironment.
Bone macrophages (MΦs) engage and efferocytose apoptotic cancer cells to induce the activation of Stat3 and NF-κB(p65), which stimulate the production of proinflammatory cytokines including CCL5, CXCL1, IL-6, and CXCL5. CXCL5 is a crucial chemoattractant of inflammatory myeloid cells, including CD11b+Gr-1+, Ly6B+ cells, and increases M2 (F4/80+CD206+ cells) polarization, all resulting in perpetual inflammation and immunosuppression that stimulate tumor growth. OC, osteoclast; OB, osteoblast.
Methods
Cell lines and animals.
Murine prostate cancer RM1 cells were originally a gift from Timothy C. Thompson (Baylor College of Medicine, Houston, Texas, USA) (63, 64). Apoptosis-inducible RM1-iC9 cells were developed by transduction of murine RM1 with the viral construct for inducible caspase-9 (iC9) as previously described (23). The newly constructed RM1-iC9 cells were characterized by an independent laboratory (IDEXX BioResearch), which confirmed origination from the C57BL/6J mouse strain, the same profile as the parent RM1, and no contamination was detected. PC3 cells (also tested by IDEXX BioResearch) were obtained from the American Type Culture Collection (ATCC). MC3T3-E1 subclone 4 (MC4) cells (ATCC CRL2593) were provided by Renny T. Franceschi (University of Michigan). C57BL/6J mouse primary prostate epithelial cells (MPECs) were obtained from Cell Biologics (C57-6038).
All animal experiments were performed with approval from the University of Michigan Institutional Animal Care and Use Committee. Control WT mice (C57BL/6J) were purchased from the Jackson Laboratory. CXCL5–/– knockout mice on a C57BL/6J background were donated by George Scott Worthen and Junjie Mei (Division of Neonatology, Children’s Hospital of Philadelphia, University of Pennsylvania, Philadelphia, Pennsylvania, USA) (38).
Vossicle (vertebral body) subcutaneous RM1-iC9 tumors.
The vossicle model, which provides an osseous scaffold for tumor growth in a bone microenvironment, has been previously described (9, 31). Detailed description is provided in Supplemental Methods.
Intratibial injection model.
Apoptosis-inducible RM1-iC9 murine prostate cancer cells (2 × 10³) or RM1-iC9–GFP (RM1-iC9 cells transduced with GFP-reporter lentiviral construct; Lenti-GFP, University of Michigan Vector Core) were injected in the left tibiae of C57BL/6J mice under anesthesia as previously described (9). Detailed description is provided in Supplemental Methods.
Human mononuclear cell isolation.
Human peripheral blood mononuclear cells were isolated from 7.5 ml of venous blood collected in EDTA-coated vacutainer tubes (Becton Dickinson). Samples were collected at the University of Michigan Comprehensive Cancer Center from patients with prostate cancer bone metastases as well as from healthy donors without any cancer history. Complete description is provided in Supplemental Methods.
Statistics.
Statistical analyses were performed in GraphPad Prism 6 (GraphPad Software Inc.) using unpaired 2-tailed Student’s t test to compare differences between 2 groups with significance of P less than 0.05. One-way ANOVA with multiple-comparisons tests was used to compare 3 or more groups with significance of P less than 0.05. The in vivo tumor progression was analyzed using 2-way ANOVA with multiple comparisons. Human peripheral blood mononuclear cell populations and human ELISA data were analyzed using nonparametric rank tests; 2-group comparisons were tested with a Wilcoxon rank test, and when more than 2 groups were tested the Kruskal-Wallis rank test was used at significance of P less than 0.0083 (using the Bonferroni multiple-comparisons adjustment).
TRACER data from multiple experimental repeats were combined. Measurements were log2-transformed and normalized to the average intensity of the control reporter, which contained only the minimal TATA-box promoter. The data were further normalized to background, defined as cells transfected with reporter virus but not administered apoptotic cells. Finally, data were normalized to the initial reporter measurement for each treatment condition at 0 hours. Statistical significance among background and experimental groups was determined using the R package limma (65). To generate heatmaps, the log2 fold change for each condition and time point was averaged among replicates. Reporters were grouped into 4 clusters using k-means clustering.
Study approval.
All participating patients were enrolled in our prospective study (HUM0052405), which was approved by the University of Michigan Medical School Institutional Review Board (Ann Arbor, Michigan, USA). All patients provided their written informed consent prior to their participation in the study.
Additional methods and extended descriptions are provided in Supplemental Methods.
Author contributions
HR, JDJ, and LKM conceived and designed the study. YW, KJP, TMM, and ETK provided human samples, and JEN provided the apoptosis-inducible construct and expertise. HR, MCP, JDJ, SW, AJK, and RK performed experiments. HR, JDJ, MCP, SW, AJK, RK, LDS, and LKM contributed to experimental design and data analysis. JEW contributed to tissue data analysis, images and expertise. SDN performed statistical analysis. MCP, SW, and HR created figures. HR, LKM, AJK, JDJ, MCP, SW, RK, and LDS contributed to manuscript writing. All authors revised and edited the manuscript.
Supplementary Material
Acknowledgments
We are indebted to George Scott Worthen and Junjie Mei for providing CXCL5–/– mice. We thank Fabiana Soki, Megan Michalski, and Benjamin Sinder for technical assistance, and thoughtful discussions. We also thank Sasha Meshinchi for confocal microscopy assistance (University of Michigan Microscopy Facility), David Adams for assistance with Amnis Imaging flow cytometer, Michelle Lynch for μCT assistance, and Chris Strayhorn and Theresa Cody for histology sectioning. We are very grateful to Victoria Zakrzewski, Kenneth Rieger, and Serk In Park for artistic contributions. This work was supported by NIH awards P01-CA093900 to LKM, KJP, and ETK, R01-CA173745 to LDS, R01-DK053904 to LKM, R01-DE21139 and R01-DE23220 to JEN, and R01GM093183 to LDS; and Department of Defense awards W81XWH-14-1-0408 to JDJ, W81XWH-14-1-0287 to TMM, and Prostate Cancer Foundation (PCF) Young Investigator Award to TMM.
Version 1. 11/27/2017
Electronic publication
Version 2. 01/02/2018
Print issue publication
Footnotes
Conflict of interest: The authors have declared that no conflict of interest exists.
Reference information: J Clin Invest. 2018;128(1):248–266.https://doi.org/10.1172/JCI92466.
Contributor Information
Hernan Roca, Email: rocach@umich.edu.
Savannah Weidner, Email: sweidner@umich.edu.
Robert Kuo, Email: robrtkuo@umich.edu.
Yugang Wang, Email: yugawang@med.umich.edu.
References
- 1.Weilbaecher KN, Guise TA, McCauley LK. Cancer to bone: a fatal attraction. Nat Rev Cancer. 2011;11(6):411–425. doi: 10.1038/nrc3055. [DOI] [PMC free article] [PubMed] [Google Scholar]
- 2.Roodman GD. Mechanisms of bone metastasis. N Engl J Med. 2004;350(16):1655–1664. doi: 10.1056/NEJMra030831. [DOI] [PubMed] [Google Scholar]
- 3.Mantovani A. La mala educación of tumor-associated macrophages: diverse pathways and new players. Cancer Cell. 2010;17(2):111–112. doi: 10.1016/j.ccr.2010.01.019. [DOI] [PubMed] [Google Scholar]
- 4.Mantovani A, Allavena P, Sica A, Balkwill F. Cancer-related inflammation. Nature. 2008;454(7203):436–444. doi: 10.1038/nature07205. [DOI] [PubMed] [Google Scholar]
- 5.Lu X, et al. VCAM-1 promotes osteolytic expansion of indolent bone micrometastasis of breast cancer by engaging α4β1-positive osteoclast progenitors. Cancer Cell. 2011;20(6):701–714. doi: 10.1016/j.ccr.2011.11.002. [DOI] [PMC free article] [PubMed] [Google Scholar]
- 6.Chen Q, Zhang XH, Massagué J. Macrophage binding to receptor VCAM-1 transmits survival signals in breast cancer cells that invade the lungs. Cancer Cell. 2011;20(4):538–549. doi: 10.1016/j.ccr.2011.08.025. [DOI] [PMC free article] [PubMed] [Google Scholar]
- 7.Roca H, McCauley LK. Inflammation and skeletal metastasis. Bonekey Rep. 2015;4:706. doi: 10.1038/bonekey.2015.75. [DOI] [PMC free article] [PubMed] [Google Scholar]
- 8.Germano G, Mantovani A, Allavena P. Targeting of the innate immunity/inflammation as complementary anti-tumor therapies. Ann Med. 2011;43(8):581–593. doi: 10.3109/07853890.2011.595732. [DOI] [PubMed] [Google Scholar]
- 9.Soki FN, et al. Bone marrow macrophages support prostate cancer growth in bone. Oncotarget. 2015;6(34):35782–35796. doi: 10.18632/oncotarget.6042. [DOI] [PMC free article] [PubMed] [Google Scholar]
- 10.Mills CD, Lenz LL, Harris RA. A breakthrough: macrophage-directed cancer immunotherapy. Cancer Res. 2016;76(3):513–516. doi: 10.1158/0008-5472.CAN-15-1737. [DOI] [PMC free article] [PubMed] [Google Scholar]
- 11.Gregory CD, Pound JD. Cell death in the neighbourhood: direct microenvironmental effects of apoptosis in normal and neoplastic tissues. J Pathol. 2011;223(2):177–194. doi: 10.1002/path.2792. [DOI] [PubMed] [Google Scholar]
- 12.Soki FN, et al. Polarization of prostate cancer-associated macrophages is induced by milk fat globule-EGF factor 8 (MFG-E8)-mediated efferocytosis. J Biol Chem. 2014;289(35):24560–24572. doi: 10.1074/jbc.M114.571620. [DOI] [PMC free article] [PubMed] [Google Scholar]
- 13.Stanford JC, et al. Efferocytosis produces a prometastatic landscape during postpartum mammary gland involution. J Clin Invest. 2014;124(11):4737–4752. doi: 10.1172/JCI76375. [DOI] [PMC free article] [PubMed] [Google Scholar]
- 14.Michalski MN, Koh AJ, Weidner S, Roca H, McCauley LK. Modulation of osteoblastic cell efferocytosis by bone marrow macrophages. J Cell Biochem. 2016;117(12):2697–2706. doi: 10.1002/jcb.25567. [DOI] [PMC free article] [PubMed] [Google Scholar]
- 15.McCabe NP, Madajka M, Vasanji A, Byzova TV. Intraosseous injection of RM1 murine prostate cancer cells promotes rapid osteolysis and periosteal bone deposition. Clin Exp Metastasis. 2008;25(5):581–590. doi: 10.1007/s10585-008-9175-1. [DOI] [PMC free article] [PubMed] [Google Scholar]
- 16.Kaighn ME, Narayan KS, Ohnuki Y, Lechner JF, Jones LW. Establishment and characterization of a human prostatic carcinoma cell line (PC-3) Invest Urol. 1979;17(1):16–23. [PubMed] [Google Scholar]
- 17.Shiozawa Y, et al. Human prostate cancer metastases target the hematopoietic stem cell niche to establish footholds in mouse bone marrow. J Clin Invest. 2011;121(4):1298–1312. doi: 10.1172/JCI43414. [DOI] [PMC free article] [PubMed] [Google Scholar]
- 18.Acharyya S, et al. A CXCL1 paracrine network links cancer chemoresistance and metastasis. Cell. 2012;150(1):165–178. doi: 10.1016/j.cell.2012.04.042. [DOI] [PMC free article] [PubMed] [Google Scholar]
- 19.Erez N, Truitt M, Olson P, Arron ST, Hanahan D. Cancer-associated fibroblasts are activated in incipient neoplasia to orchestrate tumor-promoting inflammation in an NF-κB-dependent manner. Cancer Cell. 2010;17(2):135–147. doi: 10.1016/j.ccr.2009.12.041. [DOI] [PubMed] [Google Scholar]
- 20.Weiss MS, et al. Dynamic transcription factor activity and networks during ErbB2 breast oncogenesis and targeted therapy. Integr Biol (Camb) 2014;6(12):1170–1182. doi: 10.1039/C4IB00086B. [DOI] [PMC free article] [PubMed] [Google Scholar]
- 21.Iwanaszko M, Kimmel M. NF-κB and IRF pathways: cross-regulation on target genes promoter level. BMC Genomics. 2015;16:307. doi: 10.1186/s12864-015-1511-7. [DOI] [PMC free article] [PubMed] [Google Scholar]
- 22.Moschonas A, Ioannou M, Eliopoulos AG. CD40 stimulates a “feed-forward” NF-κB-driven molecular pathway that regulates IFN-β expression in carcinoma cells. J Immunol. 2012;188(11):5521–5527. doi: 10.4049/jimmunol.1200133. [DOI] [PubMed] [Google Scholar]
- 23.Nör JE, Hu Y, Song W, Spencer DM, Núñez G. Ablation of microvessels in vivo upon dimerization of iCaspase-9. Gene Ther. 2002;9(7):444–451. doi: 10.1038/sj.gt.3301671. [DOI] [PubMed] [Google Scholar]
- 24.Yu H, Lee H, Herrmann A, Buettner R, Jove R. Revisiting STAT3 signalling in cancer: new and unexpected biological functions. Nat Rev Cancer. 2014;14(11):736–746. doi: 10.1038/nrc3818. [DOI] [PubMed] [Google Scholar]
- 25.Yu H, Pardoll D, Jove R. STATs in cancer inflammation and immunity: a leading role for STAT3. Nat Rev Cancer. 2009;9(11):798–809. doi: 10.1038/nrc2734. [DOI] [PMC free article] [PubMed] [Google Scholar]
- 26.Schust J, Sperl B, Hollis A, Mayer TU, Berg T. Stattic: a small-molecule inhibitor of STAT3 activation and dimerization. Chem Biol. 2006;13(11):1235–1242. doi: 10.1016/j.chembiol.2006.09.018. [DOI] [PubMed] [Google Scholar]
- 27.Jeong JH, Park SJ, Dickinson SI, Luo JL. A constitutive intrinsic inflammatory signaling circuit composed of miR-196b, Meis2, PPP3CC, and p65 drives prostate cancer castration resistance. Mol Cell. 2017;65(1):154–167. doi: 10.1016/j.molcel.2016.11.034. [DOI] [PMC free article] [PubMed] [Google Scholar]
- 28.Pierce JW, et al. Novel inhibitors of cytokine-induced IkappaBalpha phosphorylation and endothelial cell adhesion molecule expression show anti-inflammatory effects in vivo. J Biol Chem. 1997;272(34):21096–21103. doi: 10.1074/jbc.272.34.21096. [DOI] [PubMed] [Google Scholar]
- 29.Miller SC, et al. Identification of known drugs that act as inhibitors of NF-κB signaling and their mechanism of action. Biochem Pharmacol. 2010;79(9):1272–1280. doi: 10.1016/j.bcp.2009.12.021. [DOI] [PMC free article] [PubMed] [Google Scholar]
- 30.Davies LC, et al. Distinct bone marrow-derived and tissue-resident macrophage lineages proliferate at key stages during inflammation. Nat Commun. 2013;4:1886. doi: 10.1038/ncomms2877. [DOI] [PMC free article] [PubMed] [Google Scholar]
- 31.Jung Y, et al. Prevalence of prostate cancer metastases after intravenous inoculation provides clues into the molecular basis of dormancy in the bone marrow microenvironment. Neoplasia. 2012;14(5):429–439. doi: 10.1596/neo.111740. [DOI] [PMC free article] [PubMed] [Google Scholar]
- 32.Begley LA, et al. CXCL5 promotes prostate cancer progression. Neoplasia. 2008;10(3):244–254. doi: 10.1593/neo.07976. [DOI] [PMC free article] [PubMed] [Google Scholar]
- 33.Biswas SK, Mantovani A. Macrophage plasticity and interaction with lymphocyte subsets: cancer as a paradigm. Nat Immunol. 2010;11(10):889–896. doi: 10.1038/ni.1937. [DOI] [PubMed] [Google Scholar]
- 34.Yang L, et al. Expansion of myeloid immune suppressor Gr+CD11b+ cells in tumor-bearing host directly promotes tumor angiogenesis. Cancer Cell. 2004;6(4):409–421. doi: 10.1016/j.ccr.2004.08.031. [DOI] [PubMed] [Google Scholar]
- 35.Park SI, et al. Parathyroid hormone-related protein drives a CD11b+Gr1+ cell-mediated positive feedback loop to support prostate cancer growth. Cancer Res. 2013;73(22):6574–6583. doi: 10.1158/0008-5472.CAN-12-4692. [DOI] [PMC free article] [PubMed] [Google Scholar]
- 36.Geissmann F, Jung S, Littman DR. Blood monocytes consist of two principal subsets with distinct migratory properties. Immunity. 2003;19(1):71–82. doi: 10.1016/S1074-7613(03)00174-2. [DOI] [PubMed] [Google Scholar]
- 37.Caillou B, et al. Tumor-associated macrophages (TAMs) form an interconnected cellular supportive network in anaplastic thyroid carcinoma. PLoS One. 2011;6(7):e22567. doi: 10.1371/journal.pone.0022567. [DOI] [PMC free article] [PubMed] [Google Scholar]
- 38.Mei J, et al. CXCL5 regulates chemokine scavenging and pulmonary host defense to bacterial infection. Immunity. 2010;33(1):106–117. doi: 10.1016/j.immuni.2010.07.009. [DOI] [PMC free article] [PubMed] [Google Scholar]
- 39.Wong KL, et al. Gene expression profiling reveals the defining features of the classical, intermediate, and nonclassical human monocyte subsets. Blood. 2011;118(5):e16–e31. doi: 10.1182/blood-2010-12-326355. [DOI] [PubMed] [Google Scholar]
- 40.Frankenberger M, et al. Transcript profiling of CD16-positive monocytes reveals a unique molecular fingerprint. Eur J Immunol. 2012;42(4):957–974. doi: 10.1002/eji.201141907. [DOI] [PubMed] [Google Scholar]
- 41.Cros J, et al. Human CD14dim monocytes patrol and sense nucleic acids and viruses via TLR7 and TLR8 receptors. Immunity. 2010;33(3):375–386. doi: 10.1016/j.immuni.2010.08.012. [DOI] [PMC free article] [PubMed] [Google Scholar]
- 42.van de Veerdonk FL, Netea MG. Diversity: a hallmark of monocyte society. Immunity. 2010;33(3):289–291. doi: 10.1016/j.immuni.2010.09.007. [DOI] [PubMed] [Google Scholar]
- 43.Hol J, Wilhelmsen L, Haraldsen G. The murine IL-8 homologues KC, MIP-2, and LIX are found in endothelial cytoplasmic granules but not in Weibel-Palade bodies. J Leukoc Biol. 2010;87(3):501–508. doi: 10.1189/jlb.0809532. [DOI] [PubMed] [Google Scholar]
- 44.Hiratsuka S, Watanabe A, Aburatani H, Maru Y. Tumour-mediated upregulation of chemoattractants and recruitment of myeloid cells predetermines lung metastasis. Nat Cell Biol. 2006;8(12):1369–1375. doi: 10.1038/ncb1507. [DOI] [PubMed] [Google Scholar]
- 45.Sottnik JL, Dai J, Zhang H, Campbell B, Keller ET. Tumor-induced pressure in the bone microenvironment causes osteocytes to promote the growth of prostate cancer bone metastases. Cancer Res. 2015;75(11):2151–2158. doi: 10.1158/0008-5472.CAN-14-2493. [DOI] [PMC free article] [PubMed] [Google Scholar]
- 46.Rutkowski MR, et al. Microbially driven TLR5-dependent signaling governs distal malignant progression through tumor-promoting inflammation. Cancer Cell. 2015;27(1):27–40. doi: 10.1016/j.ccell.2014.11.009. [DOI] [PMC free article] [PubMed] [Google Scholar]
- 47.Lee H, Deng J, Xin H, Liu Y, Pardoll D, Yu H. A requirement of STAT3 DNA binding precludes Th-1 immunostimulatory gene expression by NF-κB in tumors. Cancer Res. 2011;71(11):3772–3780. doi: 10.1158/0008-5472.CAN-10-3304. [DOI] [PMC free article] [PubMed] [Google Scholar]
- 48.Yang M, Liu J, Piao C, Shao J, Du J. ICAM-1 suppresses tumor metastasis by inhibiting macrophage M2 polarization through blockade of efferocytosis. Cell Death Dis. 2015;6:e1780. doi: 10.1038/cddis.2015.144. [DOI] [PMC free article] [PubMed] [Google Scholar]
- 49.Roca H, Varsos ZS, Sud S, Craig MJ, Ying C, Pienta KJ. CCL2 and interleukin-6 promote survival of human CD11b+ peripheral blood mononuclear cells and induce M2-type macrophage polarization. J Biol Chem. 2009;284(49):34342–34354. doi: 10.1074/jbc.M109.042671. [DOI] [PMC free article] [PubMed] [Google Scholar]
- 50.Ju X, et al. Novel oncogene-induced metastatic prostate cancer cell lines define human prostate cancer progression signatures. Cancer Res. 2013;73(2):978–989. doi: 10.1158/0008-5472.CAN-12-2133. [DOI] [PMC free article] [PubMed] [Google Scholar]
- 51.Koh CM, Bieberich CJ, Dang CV, Nelson WG, Yegnasubramanian S, De Marzo AM. MYC and prostate cancer. Genes Cancer. 2010;1(6):617–628. doi: 10.1177/1947601910379132. [DOI] [PMC free article] [PubMed] [Google Scholar]
- 52.Sung SY, et al. Coevolution of prostate cancer and bone stroma in three-dimensional coculture: implications for cancer growth and metastasis. Cancer Res. 2008;68(23):9996–10003. doi: 10.1158/0008-5472.CAN-08-2492. [DOI] [PMC free article] [PubMed] [Google Scholar]
- 53.Hsu YL, Hou MF, Kuo PL, Huang YF, Tsai EM. Breast tumor-associated osteoblast-derived CXCL5 increases cancer progression by ERK/MSK1/Elk-1/snail signaling pathway. Oncogene. 2013;32(37):4436–4447. doi: 10.1038/onc.2012.444. [DOI] [PubMed] [Google Scholar]
- 54.Highfill SL, et al. Disruption of CXCR2-mediated MDSC tumor trafficking enhances anti-PD1 efficacy. Sci Transl Med. 2014;6(237):237ra67. doi: 10.1126/scitranslmed.3007974. [DOI] [PMC free article] [PubMed] [Google Scholar]
- 55.Nemeth Z, et al. Alterations of tumor microenvironment by carbon monoxide impedes lung cancer growth. Oncotarget. 2016;7(17):23919–23932. doi: 10.18632/oncotarget.8081. [DOI] [PMC free article] [PubMed] [Google Scholar]
- 56.Larson SR, et al. Characterization of osteoblastic and osteolytic proteins in prostate cancer bone metastases. Prostate. 2013;73(9):932–940. doi: 10.1002/pros.22639. [DOI] [PMC free article] [PubMed] [Google Scholar]
- 57.Scherberich JE, Nockher WA. CD14++ monocytes, CD14+/CD16+ subset and soluble CD14 as biological markers of inflammatory systemic diseases and monitoring immunosuppressive therapy. Clin Chem Lab Med. 1999;37(3):209–213. doi: 10.1515/CCLM.1999.039. [DOI] [PubMed] [Google Scholar]
- 58.Subimerb C, et al. Circulating CD14(+) CD16(+) monocyte levels predict tissue invasive character of cholangiocarcinoma. Clin Exp Immunol. 2010;161(3):471–479. doi: 10.1111/j.1365-2249.2010.04200.x. [DOI] [PMC free article] [PubMed] [Google Scholar]
- 59.Mukherjee R, Kanti Barman P, Kumar Thatoi P, Tripathy R, Kumar Das B, Ravindran B. Non-classical monocytes display inflammatory features: validation in sepsis and systemic lupus erythematous. Sci Rep. 2015;5:13886. doi: 10.1038/srep13886. [DOI] [PMC free article] [PubMed] [Google Scholar]
- 60.Zlotnik A, Yoshie O. The chemokine superfamily revisited. Immunity. 2012;36(5):705–716. doi: 10.1016/j.immuni.2012.05.008. [DOI] [PMC free article] [PubMed] [Google Scholar]
- 61.Liu Q, et al. Interleukin-1β promotes skeletal colonization and progression of metastatic prostate cancer cells with neuroendocrine features. Cancer Res. 2013;73(11):3297–3305. doi: 10.1158/0008-5472.CAN-12-3970. [DOI] [PubMed] [Google Scholar]
- 62.Yang YH, et al. Semaphorin 4D promotes skeletal metastasis in breast cancer. PLoS One. 2016;11(2):e0150151. doi: 10.1371/journal.pone.0150151. [DOI] [PMC free article] [PubMed] [Google Scholar]
- 63.Baley PA, Yoshida K, Qian W, Sehgal I, Thompson TC. Progression to androgen insensitivity in a novel in vitro mouse model for prostate cancer. J Steroid Biochem Mol Biol. 1995;52(5):403–413. doi: 10.1016/0960-0760(95)00001-G. [DOI] [PubMed] [Google Scholar]
- 64.Thompson TC, Southgate J, Kitchener G, Land H. Multistage carcinogenesis induced by ras and myc oncogenes in a reconstituted organ. Cell. 1989;56(6):917–930. doi: 10.1016/0092-8674(89)90625-9. [DOI] [PubMed] [Google Scholar]
- 65. doi: 10.2202/1544-6115.1027. Smyth GK. Linear models and empirical Bayes methods for assessing differential expression in microarray experiments. Stat Appl Genet Mol Biol. 2004;3(1): https://doi.org/10.2202/1544-6115.1027. [DOI] [PubMed]
Associated Data
This section collects any data citations, data availability statements, or supplementary materials included in this article.


