The first-pass analysis technique was retrospectively validated in a swine model and has the potential to be used for accurate, low-dose vessel-specific morphologic and physiologic assessment of coronary artery disease.
Abstract
Purpose
To retrospectively validate a first-pass analysis (FPA) technique that combines computed tomographic (CT) angiography and dynamic CT perfusion measurement into one low-dose examination.
Materials and Methods
The study was approved by the animal care committee. The FPA technique was retrospectively validated in six swine (mean weight, 37.3 kg ± 7.5 [standard deviation]) between April 2015 and October 2016. Four to five intermediate-severity stenoses were generated in the left anterior descending artery (LAD), and 20 contrast material–enhanced volume scans were acquired per stenosis. All volume scans were used for maximum slope model (MSM) perfusion measurement, but only two volume scans were used for FPA perfusion measurement. Perfusion measurements in the LAD, left circumflex artery (LCx), right coronary artery, and all three coronary arteries combined were compared with microsphere perfusion measurements by using regression, root-mean-square error, root-mean-square deviation, Lin concordance correlation, and diagnostic outcomes analysis. The CT dose index and size-specific dose estimate per two-volume FPA perfusion measurement were also determined.
Results
FPA and MSM perfusion measurements (PFPA and PMSM) in all three coronary arteries combined were related to reference standard microsphere perfusion measurements (PMICRO), as follows: PFPA_COMBINED = 1.02 PMICRO_COMBINED + 0.11 (r = 0.96) and PMSM_COMBINED = 0.28 PMICRO_COMBINED + 0.23 (r = 0.89). The CT dose index and size-specific dose estimate per two-volume FPA perfusion measurement were 10.8 and 17.8 mGy, respectively.
Conclusion
The FPA technique was retrospectively validated in a swine model and has the potential to be used for accurate, low-dose vessel-specific morphologic and physiologic assessment of coronary artery disease.
© RSNA, 2017
Introduction
Coronary artery disease (CAD) is a global health concern. Fortunately, when CAD risk is accurately assessed with coronary or computed tomographic (CT) angiography and is managed appropriately with medical therapy or surgical intervention, long-term outcomes are improved (1). Unfortunately, morphologic assessment often correlates poorly with the physiologic significance of intermediate-severity disease (30%–70% luminal narrowing) (2). Hence, guidelines recommend further physiologic assessment with fractional flow reserve (FFR) (3), cardiac magnetic resonance (MR) imaging (4), single-photon emission CT (SPECT) (5), or static positron emission tomography (PET) (6). Nevertheless, discordance often exists between FFR and perfusion (7), as FFR enables evaluation of only focal epicardial disease, while MR imaging, SPECT, and static PET enable estimation of only relative perfusion (ie, they cannot be used to accurately assess multivessel, diffuse, or microvascular disease) (8,9). Only quantitative perfusion measurement can overcome such deficiencies, where hyperemic perfusion less than 1.0 mL/min/g indicates significant disease (10).
Quantitative perfusion measurement is possible with dynamic PET (11) and dynamic CT (12). However, dynamic CT perfusion techniques are known to underestimate perfusion (13–15). Specifically, such techniques rely on small tissue volumes of interest (VOIs) to derive perfusion. When coupled with the rapid 3–5-second hyperemic transit of contrast material from the coronary artery to the sinus (16), such VOIs are subject to contrast material exit over the measurement duration, resulting in perfusion underestimation (13–15). Small VOI measurements also have poor signal-to-noise ratio; hence, multiple cardiac cycles are imaged to improve measurement reliability, leading to estimated effective radiation doses of up to 10–15 mSv (17,18). Dynamic CT perfusion techniques also do not simultaneously acquire angiographic data; therefore, additional contrast material and radiation dose are necessary for separate CT angiography. Thus, the purpose of this study was to retrospectively validate a first-pass analysis (FPA) technique that combines CT angiography and dynamic CT perfusion into one low-dose examination. The hypothesis was that combined acquisition of CT angiography and dynamic CT perfusion data by using only two whole-heart volume scans and one contrast material injection would enable accurate, low-dose vessel-specific morphologic and physiologic assessment of CAD.
Materials and Methods
General Methods
This study was approved by the animal care committee. The FPA technique was retrospectively validated in six male Yorkshire swine (mean weight, 37.3 kg ± 7.5 [standard deviation]) by using microsphere perfusion measurement as the reference standard (19,20), with the maximum slope model (MSM) technique implemented for comparison. All data were prospectively acquired between April and June 2015, and all experiments were successfully completed. All data from all experiments were combined and retrospectively analyzed between June 2015 and October 2016. All of the authors conducted the experiments and data acquisition. Five authors (L.H., J.L., B.Z., S. Malkasian, and B.D.) conducted data analysis and generated the information for publication. Three authors (B.S., H.J., E.G.) were physicians in general surgery, internal medicine, and interventional cardiology, respectively, with more than 5 years of clinical experience. Two authors (L.H., B.Z.) were research associates in medical physics with more than 3 years of medical imaging research experience. Three authors (J.L., S. Malkasian, B.D.) were research assistants in medical physics with more than 2 years of medical imaging research experience.
FPA Technique
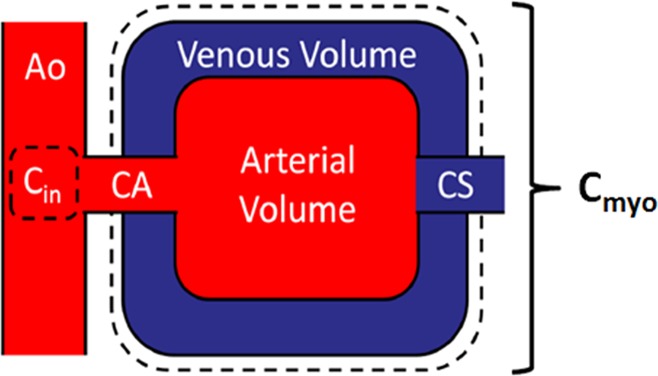
FPA and conservation of mass (21) state that the average perfusion (PAVE) within a tissue compartment of interest is proportional to the first-pass entry of contrast material mass into that compartment over time (dMC/dt), normalized by the incoming contrast material concentration (Cin) and compartment tissue mass (MT), assuming no contrast material exits over the measurement duration. Given such a theory, the FPA technique models the entire myocardium as one compartment; therefore, the vascular, interstitial, and cellular compartments are lumped together, as described in Figure 1. As a result, partial diffusion of contrast material (22) from the vascular space into the interstitial and cellular compartments does not affect the FPA technique. Hence, as contrast material mass enters the compartment, the first-pass entry of contrast material mass into that compartment over time is derived from the integrated change in myocardial attenuation over time, while the contrast material concentration is approximated from the aortic input function (AIF) (23,24), as described in equation 1:
Figure 1:
Myocardial perfusion compartment model used for quantitative FPA perfusion measurement, indicating the aortic input (Ao) and input concentration (Cin ), coronary arterial input (CA), whole-heart myocardial tissue compartment (Cmyo ), and coronary sinus (CS). The compartment tissue mass is defined as MT in Equation 1.
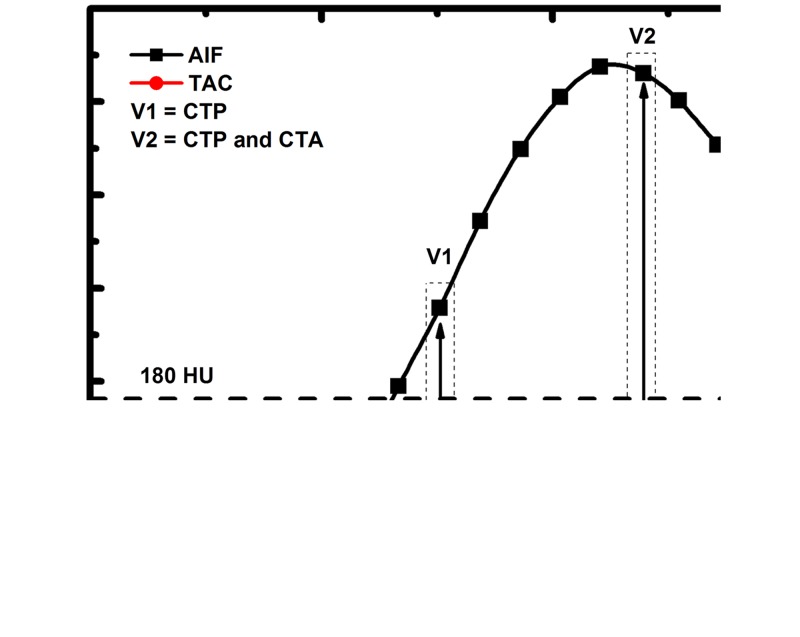
Such FPA perfusion measurements are also derived by using only two volume scans, which are labeled V1 and V2 in Figure 2 and which occur during the upslope of myocardial attenuation. V1 is the first volume scan after the AIF exceeds 180 HU, while V2 is the first volume scan after the AIF reaches its peak. Both V1 and V2 are used for perfusion measurement, while only V2 is also used for CT angiography (23,24). Moreover, as PAVE is also proportional to the rate of contrast material concentration change within the compartment (ie, the average change in myocardial attenuation [ΔHUAVE] over time), the voxel-by-voxel concentration change (ΔHU) is used to derive voxel-by-voxel perfusion (PFPA), as described in Equation 2:
Figure 2:
To emulate a low-dose prospective acquisition protocol, two first-pass volume scans ( V1 and V2) are used for FPA perfusion measurement. The integrated change in myocardial attenuation (dMC/dt) is derived from the tissue time-attenuation curve ( TAC), and the average input concentration is estimated from the AIF. Both V1 and V2 are used for dynamic CT perfusion (CTP), while the volume scan after maximal attenuation ( V2) is also used for CT angiography (CTA).
MSM Technique
The MSM technique uses small tissue VOIs (∼1.0 cm3) to generate myocardial time-attenuation curves (TACs) and assumes no contrast material exits those VOIs over the measurement duration. Perfusion (PMSM) is defined as the maximum upslope of those time-attenuation curves (dTAC/dtMAX), divided by the maximum of the AIF (AIFMAX) and tissue density (ρT). However, because of poor measurement signal-to-noise ratio, the average upslope (dTAC/dtAVE) is more commonly used (13,17), as described in Equation 3:
Animal Model
For each swine, anesthesia was induced with telazol (4.4 mg per kilogram of body weight) (Zoetis, Parsippany, NJ), ketamine (2.2 mg/kg) (Vedco, St Joseph, Mo), and xylazine (2.2 mg/kg) (Akorn, Lake Forest, Ill) and was maintained with 1.5%–2.5% isoflurane (Piramal Critical Care, Bethlehem, Pa). Sheaths (Avanti; Cordis, Miami Lakes, Fla) were placed in the femoral arteries and veins, the right jugular vein, and the right carotid artery. The femoral artery sheaths were used to pass a pigtail catheter into the left ventricle for microsphere injection and to pass a multipurpose catheter into the aorta for blood sample withdrawal. The femoral vein sheaths were used for drug and fluid administration, and the jugular sheath was used for contrast material injection.
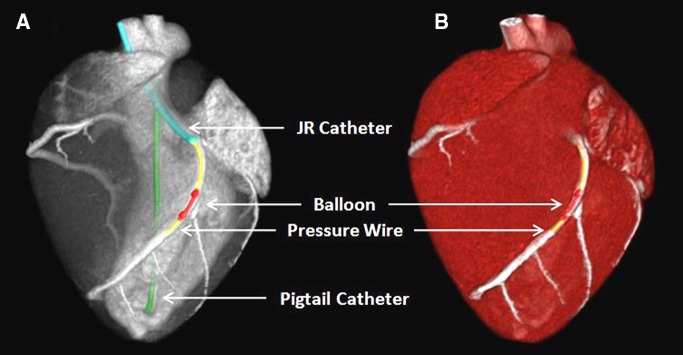
When using the carotid sheath, the left coronary ostium was engaged with a Judkins right catheter (Cordis), and a pressure wire (PrimeWire PRESTIGE Pressure Guide Wire; Volcano, Rancho Cordova, Calif) was advanced into the distal left anterior descending artery (LAD). A balloon was passed over the wire into the proximal LAD and was used to generate four to five intermediate-severity stenoses (30–70% luminal narrowing) in each swine during maximal intracoronary hyperemia (administration of 240 µg adenosine per minute via a syringe pump, model 55–2222; Harvard Apparatus, Holliston, Mass). Stenosis severity was determined with FFR measurement (ComboMap; Volcano). The interventional set-up is shown in Figure 3.
Figure 3:
A, Contrast-enhanced CT projection and, B, CT angiogram of the interventional set-up in the swine model shows the Judkins right (JR) catheter (blue), balloon (red), pressure wire (yellow), and pigtail catheter (green).
CT Imaging Protocol
For each stenosis, contrast material (1 mL/kg, Isovue 370; Bracco Diagnostics, Princeton, NJ) and saline (0.5 mL/kg) were injected (7 mL/sec, Empower CTA; Acist Medical Systems, Eden Prairie, Minn), and 20 whole-heart volume scans were prospectively acquired (Aquilion One; Toshiba America Medical Systems, Tustin, Calif) at 100 kVp and 200 mA with 320 × 0.5 mm collimation and 16 cm of craniocaudal coverage. All volume scans were reconstructed from full projection data at 75% of the R-R interval. The CT dose index per retrospective two-volume FPA perfusion measurement was also recorded, and a size-specific dose estimate was computed to account for the approximately 22-cm effective chest diameter of the swine (25).
Microsphere Perfusion Measurement
The 15.5-µm-diameter NuFlow Hydro-Coat fluorescent microspheres (IMT Laboratories, Irvine, Calif) were used as the reference standard for perfusion measurement (19,20). For each stenosis, microspheres were injected into the left ventricle, and blood samples were withdrawn from the aorta at a rate of 10 mL/min over 2 minutes (GenieTouch; Kent Scientific, Torrington, Conn). Each animal was then euthanized, and tissue samples were excised from the distal LAD, left circumflex artery (LCx), and right coronary artery (RCA) perfusion territories. All tissue and blood samples were analyzed independently (IMT Laboratories).
FPA Image Processing
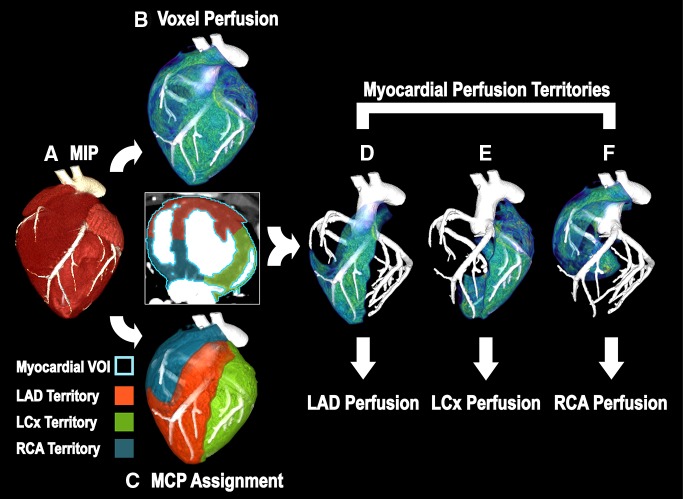
For each acquisition, two volume scans were systematically selected for retrospective FPA perfusion measurement. Specifically, to emulate a low-dose prospective acquisition protocol, V1 was selected as the first volume scan after the AIF exceeded 180 HU, while V2 was selected as the first volume scan after the AIF reached its peak. The two volume scans were then registered, combined into a maximum intensity projection, and segmented semiautomatically to produce a myocardial mask (ie, a whole-heart perfusion compartment). Given the compartment mass, the average of the AIF, and the integrated and average change in myocardial attenuation between the two volume scans, voxel-by-voxel perfusion measurement was computed. The centerlines of the LAD, LCx, and RCA were then extracted (Vitrea fX, version 6.0; Vital Images, Minnetonka, Minn) and were used along with the mask for minimum-cost-path myocardial assignment (26), yielding three coronary perfusion territories, with the LAD territory further partitioned past the stenosis. Voxel-by-voxel perfusion measurements were then averaged within each territory and were compared with the microsphere perfusion measurements. The FPA image processing scheme is summarized in Figure 4.
Figure 4:
Image processing scheme for FPA perfusion measurement. A, The entire heart is segmented from the V1 and V2 maximum-intensity projection (MIP), resulting in a whole-heart VOI (axial view; light blue outline = whole-heart VOI). B, Voxel-by-voxel perfusion is computed within the whole-heart VOI. C, Minimum-cost-path (MCP) myocardial assignment is performed, yielding three vessel-specific sub-VOIs (red = LAD sub-VOI, green = LCx sub-VOI, blue = RCA sub-VOI). D–F, Vessel-specific perfusion is derived by averaging the voxel-by-voxel perfusion within each sub-VOI.
MSM Image Processing
For each acquisition, all 20 volume scans were used for retrospective MSM perfusion measurement. VOIs measuring 1.0 cm3 were placed in the anterior wall of the left ventricle, the lateral wall of the left ventricle, and the inferior septal wall between ventricles. Given the dynamic attenuation within each VOI, the maximum of the AIF, and the myocardial tissue density, vessel-specific perfusion measurements were derived and compared with microsphere perfusion measurements.
Statistical Analyses
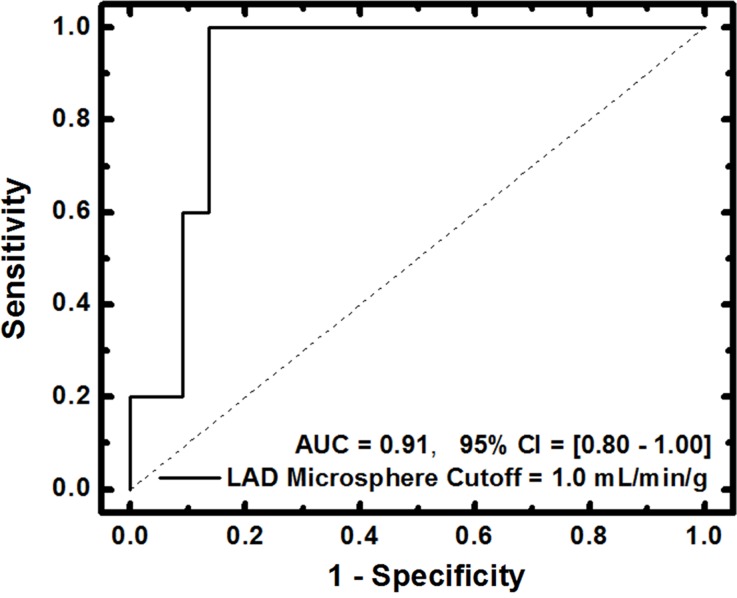
Power analysis was performed to appropriately demonstrate improved agreement of FPA over MSM perfusion measurement as compared with microsphere perfusion measurement (27). In a similar study (19), a slope of 0.25 and a correlation of 0.67 was found between MSM perfusion measurement and microsphere perfusion measurement, with a microsphere standard deviation of 1.25 mL/min/g. However, the FPA technique has been shown to improve the slope, with a correlation similar to that of the MSM technique (23,24). Hence, 20 independent microsphere perfusion measurements were deemed necessary to reject the null hypothesis of equal slopes, assuming a conservative FPA slope improvement of at least 0.25 over the MSM slope, a microsphere standard deviation of 1.25 mL/min/g, a type 1 error probability of 0.05, and a power of 0.80. The combined variance of microsphere perfusion measurements (LAD, LCx, and RCA for all stenoses) within each animal was also compared with the combined variance of microsphere perfusion measurements between each animal with intracluster correlation (28). The intracluster correlation was found to be ρ = 0.12, indicating negligible correlation between intra-animal measurements; hence, all measurements were assumed to be independent. For the primary outcome measure, the accuracy and precision of FPA and MSM perfusion measurement in the LAD, LCx, RCA, and in all three coronary arteries combined was assessed by using regression, root-mean-square error, and root-mean-square deviation. The Lin concordance correlation coefficient (29) was also computed as a measure of true agreement with the reference standard. For the secondary outcome measure, the performance of FPA- and MSM-based detection of significant stenoses in the LAD was assessed. Sensitivity, specificity, positive and negative predictive values, and area under the receiver operator characteristic curve (AUC) were computed, with LAD microsphere perfusion measurements less than 1.0 mL/min/g at maximal hyperemia classified as significant (10). Statistical software (PS, version 3.0, Vanderbilt University, Nashville, Tenn; SPSS, version 22, IBM, Armonk, NY) was used for analyses.
Results
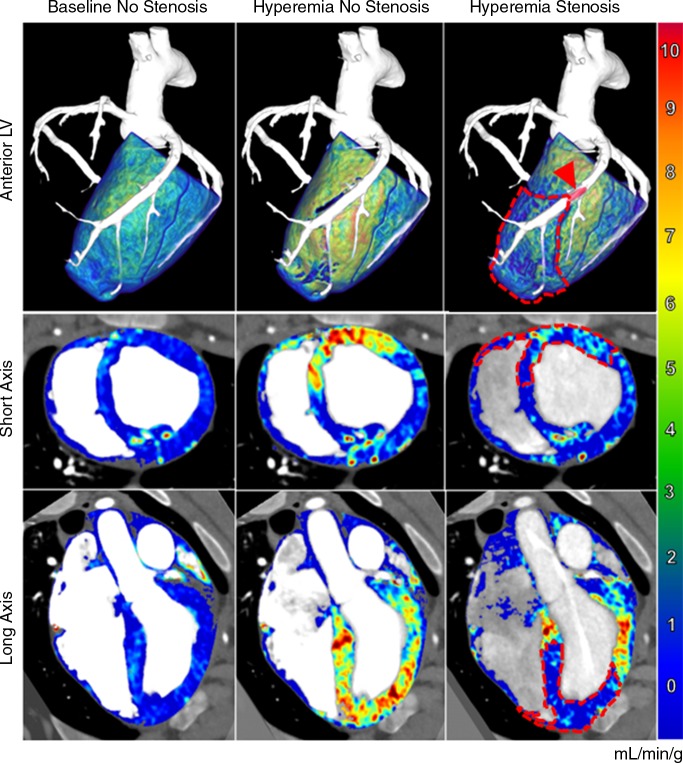
Mean heart rate and mean arterial pressure were 78.6 beats per minute ± 5.3 and 73.4 mmHg ± 9.9, respectively. The CT dose index and size-specific dose estimate per two-volume FPA perfusion measurement were 10.8 mGy and 17.8 mGy, respectively. On the basis of the result of minimum-cost path assignment, the LAD, LCx, and RCA perfused 43.0% ± 3.4, 38.2% ± 2.2, and 18.8% ± 5.3 of the left ventricular mass, respectively, and 39.9% ± 8.8, 0.1% ± 0.3, and 60.0% ± 8.7 of the right ventricular mass, respectively. Additionally, combined angiography and perfusion maps were generated with the FPA technique for baseline, hyperemic, and stenotic perfusion conditions in the LAD and are shown in Figure 5.
Figure 5:
Combined angiography and perfusion maps generated with the FPA technique. Several perfusion conditions were induced in the LAD coronary artery, including baseline perfusion with no stenosis (left), hyperemic perfusion with no stenosis (middle), and hyperemic perfusion in the presence of significant stenosis (right). Top: Anterior volumetric views of the left ventricle (LV ) are shown for three-dimensional visualization of the balloon stenosis position (arrowhead) and distal perfusion deficit (dashed line). Axial (middle row) and coronal (bottom row) views of both ventricles are also displayed. The color bar indicates quantitative perfusion in milliliters per minute per gram.
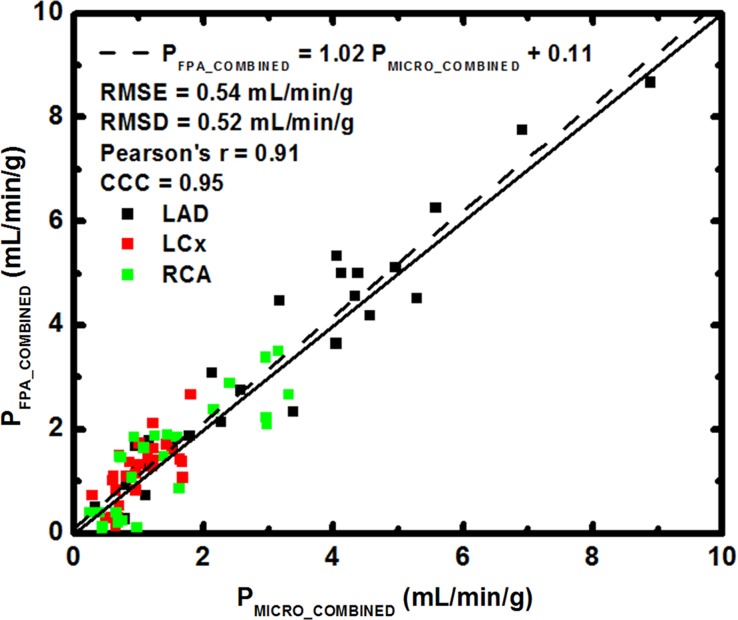
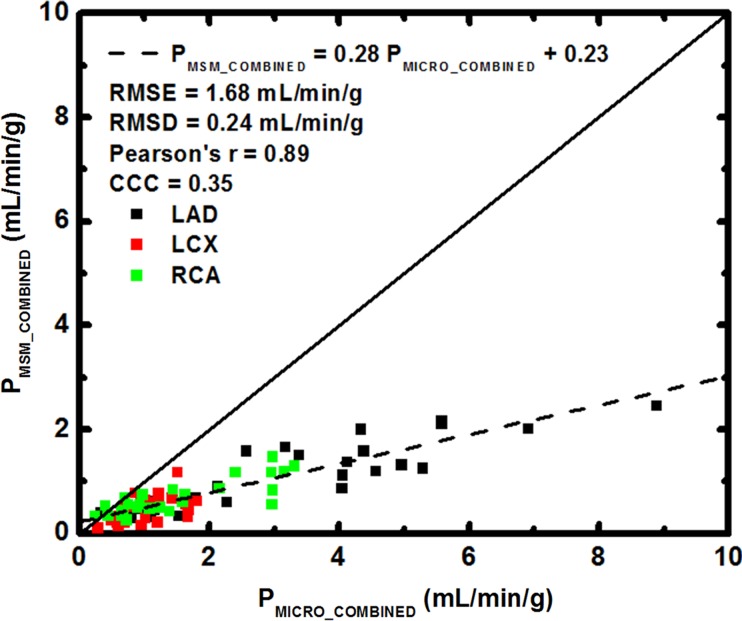
FPA perfusion measurement in all three coronary arteries combined was related to microsphere perfusion measurement by PFPA_COMBINED = 1.02 PMICRO_COMBINED + 0.11, with a Pearson correlation coefficient of 0.96, a Lin concordance correlation coefficient of 0.95, a root-mean-square error of 0.54 mL/min/g, and a root-mean-square deviation of 0.52 mL/min/g, as shown in Figure 6a, with the individual LAD, LCx, and RCA perfusion measurements shown in Table 1. MSM perfusion measurement in all three coronary arteries combined was related to microsphere perfusion measurement by PMSM_COMBINED = 0.28 PMICRO_COMBINED + 0.23, with a Pearson correlation coefficient of 0.89, a Lin concordance correlation coefficient of 0.35, a root-mean-square error of 1.69 mL/min/g, and a root-mean-square deviation of 0.24 mL/min/g, as shown in Figure 6b, with the individual LAD, LCx, and RCA measurements shown in Table 1.
Figure 6a:
Regression of (a) FPA and (b) MSM perfusion measurement in all three coronary arteries combined (PFPA_COMBINED and PMSM_COMBINED, respectively) compared with the reference standard, microsphere perfusion measurement (PMICRO_COMBINED). CCC = Lin concordance correlation coefficient, RMSD = root-mean-square deviation, RMSE = root-mean-square error.
Table 1.
FPA and MSM Perfusion Compared with Microsphere Perfusion

Note.—Data in parentheses are 95% confidence intervals. CCC = concordance correlation coefficient, RMSD = root-mean-square deviation, RMSE = root-mean-square error.
*There was nonoverlap of the 95% confidence intervals (ie, significant differences between corresponding FPA and MSM parameters).
Figure 6b:
Regression of (a) FPA and (b) MSM perfusion measurement in all three coronary arteries combined (PFPA_COMBINED and PMSM_COMBINED, respectively) compared with the reference standard, microsphere perfusion measurement (PMICRO_COMBINED). CCC = Lin concordance correlation coefficient, RMSD = root-mean-square deviation, RMSE = root-mean-square error.
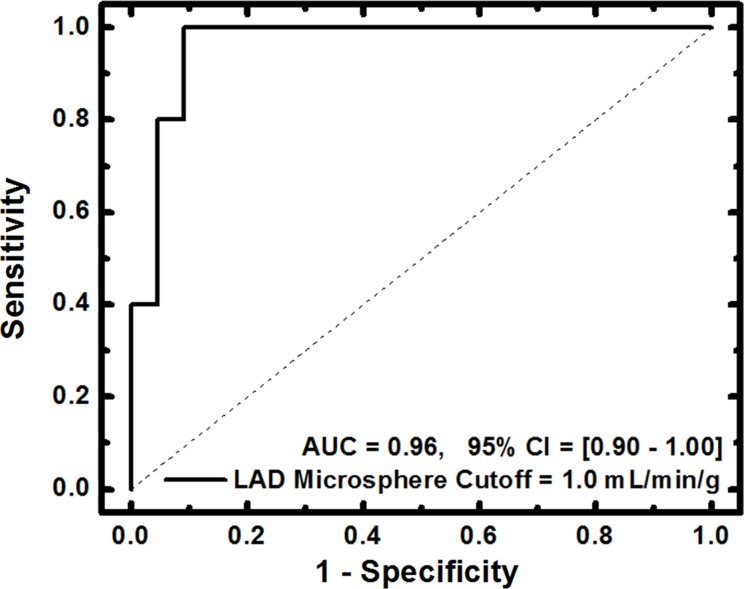
For FPA-based detection of significant stenoses, AUC was 0.96, as shown in Table 2 and Figure 7a. For MSM-based detection of significant stenoses, AUC was 0.91, as shown in Table 2 and Figure 7b. The diagnostic sensitivity, specificity, and positive and negative predictive values of both techniques are shown in Table 2. A general comparison between FPA, MSM, microsphere, and dynamic PET perfusion measurements is shown in Table 3, with previously reported dynamic PET perfusion measurements (11) also shown.
Table 2.
FPA- and MSM-based Detection of Significant LAD Stenosis

Note.—Data in parentheses are the fractional representation of measurements. Data in brackets are 95% confidence intervals. NPV = negative predictive value, PPV = positive predictive value.
Figure 7a:
(a) FPA-based detection of significant stenoses in the LAD coronary artery at maximal hyperemia. (b) MSM-based detection of significant stenoses in the LAD at maximal hyperemia. Significant stenoses in the LAD were classified as having reference standard microsphere perfusion values less than 1.0 mL/min/g. CI = confidence interval.
Figure 7b:
(a) FPA-based detection of significant stenoses in the LAD coronary artery at maximal hyperemia. (b) MSM-based detection of significant stenoses in the LAD at maximal hyperemia. Significant stenoses in the LAD were classified as having reference standard microsphere perfusion values less than 1.0 mL/min/g. CI = confidence interval.
Table 3.
FPA, MSM, and Microsphere Perfusion in the LAD Compared with Dynamic PET

Note.—Data are mean ± standard deviation. FPA, MSM, and microsphere perfusion data were generated in the current study; however, PET data were previously reported (11).
*Hyperemia was induced with an intracoronary stress agent.
†Hyperemia was induced with an intravenous stress agent.
Discussion
The FPA technique performed better than the MSM technique in perfusion measurement, demonstrating higher slope of agreement and higher concordance correlation (29) as compared with microsphere perfusion measurement. The FPA technique also performed better than the MSM technique in detection of significant stenoses (LAD microsphere perfusion <1.0 mL/min/g at maximal hyperemia), with increases in accuracy, specificity, and positive predictive value, although the MSM technique demonstrated higher sensitivity and negative predictive value. However, such high sensitivity and negative predictive value is attributed to a high rate of false-positive findings, as indicated by the poor specificity, low positive predictive value, and underestimation of perfusion (13–15).
Baseline and hyperemic perfusion measurement with the FPA technique also agreed with previously reported PET perfusion measurement (11), while the MSM technique underestimated perfusion. However, perfusion measured with the FPA technique was higher than that measured with dynamic PET (11) due to contrast material–induced vasodilation (30) and intracoronary adenosine use. Specifically, intracoronary adenosine was used to reduce hypotension and reflex tachycardia, but it enabled full coronary vasodilation with high mean systemic pressure. Thus, if intravenous adenosine were used instead, hyperemic perfusion measured with the FPA technique would likely be more comparable to that of dynamic PET (11), though additional validation studies are still necessary and are currently underway.
Regardless, prospective implementation of the FPA technique will depend on proper volume scan timing and acquisition. Specifically, in this study, only two first-pass volume scans were systematically selected for retrospective FPA perfusion measurement, emulating a low-dose prospective acquisition protocol and corresponding to a CT dose index of 10.8 mGy and a size-specific dose estimate of 17.8 mGy. To implement such a protocol prospectively while also accounting for patient-specific variations in cardiac output, a diluted test contrast bolus acquisition (31) can first be used to determine the time delay between V1 and V2. Automatic dynamic bolus tracking (32) can then be performed to trigger and acquire V1, followed by acquisition of V2 using the previously determined test-bolus-based time delay. Given such a protocol, prospective implementation of the FPA technique is feasible, with only minor increases in contrast material dose and radiation dose per examination, though additional validation studies are still necessary and are currently underway.
Hence, if using an adult chest conversion factor of 0.014, prospective implementation of the FPA technique at 100 kVp and 200–500 mA may yield an estimated effective radiation dose of 2.4–6.0 mSv for combined CT angiography and dynamic CT perfusion. This effective radiation dose is comparable to that attained with current CT angiography techniques, but it is much lower than that attained with current dynamic CT perfusion techniques (17,18). Nevertheless, feasibility of the FPA technique also depends on the accessibility of 320-section CT technology with 16 cm of craniocaudal coverage (33), as simultaneous acquisition of whole-heart CT angiography and dynamic CT perfusion data is not possible with 64-section CT units. Fortunately, such technology is becoming more prevalent. A report also suggests that whole-heart imaging is possible with 128- and 256-section CT technology if systolic-phase data are acquired at end expiration (34). Hence, the FPA technique could be implemented with 128- and 256-section CT technology, but additional validation is still necessary.
In regard to other limitations of the study, contrast material was injected centrally at a high rate, which is not realistic in clinical practice. Hence, additional validation studies that use peripheral injection of contrast material at a lower rate are still necessary and are currently underway. Furthermore, only proximal vessel disease was assessed in the LAD; this means multivessel, distal, branch, diffuse, and microvascular disease were not considered. Fortunately, the FPA technique can spatially resolve perfusion on a voxel-by-voxel and vessel-specific basis; hence, detection of focal, gradient, and global perfusion deficits is still feasible. Nevertheless, the accuracy of voxel-by-voxel perfusion measurement depends on image noise. Fortunately, as a clinically relevant volume of ischemic myocardium is on the order of 1 cm3, moderate binning of voxel-by-voxel perfusion measurements can suppress image noise while maintaining adequate spatial resolution. Accurate vessel-specific perfusion measurement also depends on minimum-cost-path assignment (26). Fortunately, the preliminary results of this study agree well with prior work by Carlsson and Saeed (35), indicating accurate assignment performance. However, the minimum vessel sparseness necessary for minimum-cost-path assignment, as well as the performance of minimum-cost-path assignment in the presence of collaterals, requires additional validation.
Practical application: The FPA technique uses 320-section CT technology for whole-heart imaging within one cardiac cycle, with improved measurement of signal-to-noise ratio. By defining the entire myocardium as one VOI and obtaining measurements prior to hyperemic transit, the problem of perfusion underestimation (13–15) is solved. Hence, the FPA technique enables CT angiography and dynamic CT perfusion data to be acquired simultaneously by using only two volume scans and one contrast material injection. Such a reduction in volume scan number also results in lower radiation exposure. Thus, the FPA technique has the potential to reduce the radiation dose and contrast material dose associated with CT-based CAD work-up, making comprehensive assessment of CAD more accessible to and effective in patients in need. In summary, the FPA technique was retrospectively validated in a swine model and has the potential to be used for accurate, low-dose vessel-specific morphologic and physiologic assessment of CAD.
Advances in Knowledge
■ The first-pass analysis (FPA) technique can be used to accurately measure quantitative perfusion in the left anterior descending artery (LAD), left circumflex artery, and right coronary artery, as well as in all three coronary arteries combined, as indicated by good agreement with the reference standard, microsphere perfusion.
■ The FPA technique can be used to accurately diagnose significant stenoses, as indicated by good detection of microsphere perfusion values less than 1.0 mL/min/g at maximal hyperemia in the LAD (area under the receiver operator characteristic curve = 0.96; 95% confidence interval: 0.90, 1.00).
■ The FPA technique enables simultaneous acquisition of CT angiography data and dynamic CT perfusion data with only two first-pass volume scans and one contrast material injection; thus, comprehensive morphologic and physiologic assessment of coronary artery disease may be feasible with low radiation dose (CT dose index, 10.8 mGy; size-specific dose estimate, 17.8 mGy) and low contrast material dose.
Acknowledgments
Acknowledgments
The authors thank Erin Angel, PhD, and Di Zhang, PhD, from Toshiba America Medical Systems for their technical support in this work.
Received December 12, 2016; revision requested February 14, 2017; revision received April 17; accepted May 17; final version accepted July 28.
Supported by the Department of Radiological Sciences at the University of California, Irvine, and the National Heart, Lung, and Blood Institute (T32-HL116270).
Disclosures of Conflicts of Interest: L.H. disclosed no relevant relationships. J.L. disclosed no relevant relationships. B.Z. disclosed no relevant relationships. S. Malkasian disclosed no relevant relationships. B.S. disclosed no relevant relationships. H.J. disclosed no relevant relationships. E.M.G. disclosed no relevant relationships. B.D. disclosed no relevant relationships. S. Molloi Activities related to the present article: disclosed no relevant relationships. Activities not related to the present article: received grants from Toshiba America Medical Systems and Philips Medical Systems. Other relationships: has a patent pending.
Abbreviations:
- AIF
- aortic input function
- AUC
- area under the receiver operator characteristic curve
- CAD
- coronary artery disease
- FFR
- fractional flow reserve
- FPA
- first-pass analysis
- LAD
- left anterior descending artery
- LCx
- left circumflex artery
- MSM
- maximum slope model
- RCA
- right coronary artery
- VOI
- volume of interest
References
- 1.Hadamitzky M, Freissmuth B, Meyer T, et al. Prognostic value of coronary computed tomographic angiography for prediction of cardiac events in patients with suspected coronary artery disease. JACC Cardiovasc Imaging 2009;2(4):404–411. [DOI] [PubMed] [Google Scholar]
- 2.Meijboom WB, Van Mieghem CA, van Pelt N, et al. Comprehensive assessment of coronary artery stenoses: computed tomography coronary angiography versus conventional coronary angiography and correlation with fractional flow reserve in patients with stable angina. J Am Coll Cardiol 2008;52(8):636–643. [DOI] [PubMed] [Google Scholar]
- 3.Tonino PA, De Bruyne B, Pijls NH, et al. Fractional flow reserve versus angiography for guiding percutaneous coronary intervention. N Engl J Med 2009;360(3):213–224. [DOI] [PubMed] [Google Scholar]
- 4.Rieber J, Huber A, Erhard I, et al. Cardiac magnetic resonance perfusion imaging for the functional assessment of coronary artery disease: a comparison with coronary angiography and fractional flow reserve. Eur Heart J 2006;27(12):1465–1471. [DOI] [PubMed] [Google Scholar]
- 5.Doukky R, Hayes K, Frogge N, et al. Impact of appropriate use on the prognostic value of single-photon emission computed tomography myocardial perfusion imaging. Circulation 2013;128(15):1634–1643. [DOI] [PubMed] [Google Scholar]
- 6.Ziadi MC, Dekemp RA, Williams KA, et al. Impaired myocardial flow reserve on rubidium-82 positron emission tomography imaging predicts adverse outcomes in patients assessed for myocardial ischemia. J Am Coll Cardiol 2011;58(7):740–748. [DOI] [PubMed] [Google Scholar]
- 7.Johnson NP, Kirkeeide RL, Gould KL. Is discordance of coronary flow reserve and fractional flow reserve due to methodology or clinically relevant coronary pathophysiology? JACC Cardiovasc Imaging 2012;5(2):193–202. [DOI] [PubMed] [Google Scholar]
- 8.Hagemann CE, Ghotbi AA, Kjær A, Hasbak P. Quantitative myocardial blood flow with Rubidium-82 PET: a clinical perspective. Am J Nucl Med Mol Imaging 2015;5(5):457–468. [PMC free article] [PubMed] [Google Scholar]
- 9.Hajjiri MM, Leavitt MB, Zheng H, Spooner AE, Fischman AJ, Gewirtz H. Comparison of positron emission tomography measurement of adenosine-stimulated absolute myocardial blood flow versus relative myocardial tracer content for physiological assessment of coronary artery stenosis severity and location. JACC Cardiovasc Imaging 2009;2(6):751–758. [DOI] [PubMed] [Google Scholar]
- 10.Johnson NP, Gould KL, Di Carli MF, Taqueti VR. Invasive FFR and noninvasive CFR in the evaluation of ischemia: what is the future? J Am Coll Cardiol 2016;67(23):2772–2788. [DOI] [PubMed] [Google Scholar]
- 11.Schwaiger M. Myocardial perfusion imaging with PET. J Nucl Med 1994;35(4):693–698. [PubMed] [Google Scholar]
- 12.Bamberg F, Becker A, Schwarz F, et al. Detection of hemodynamically significant coronary artery stenosis: incremental diagnostic value of dynamic CT-based myocardial perfusion imaging. Radiology 2011;260(3):689–698. [DOI] [PubMed] [Google Scholar]
- 13.Bindschadler M, Modgil D, Branch KR, La Riviere PJ, Alessio AM. Comparison of blood flow models and acquisitions for quantitative myocardial perfusion estimation from dynamic CT. Phys Med Biol 2014;59(7):1533–1556. [DOI] [PMC free article] [PubMed] [Google Scholar]
- 14.Schwarz F, Hinkel R, Baloch E, et al. Myocardial CT perfusion imaging in a large animal model: comparison of dynamic versus single-phase acquisitions. JACC Cardiovasc Imaging 2013;6(12):1229–1238. [DOI] [PubMed] [Google Scholar]
- 15.Ishida M, Kitagawa K, Ichihara T, et al. Underestimation of myocardial blood flow by dynamic perfusion CT: explanations by two-compartment model analysis and limited temporal sampling of dynamic CT. J Cardiovasc Comput Tomogr 2016;10(3):207–214. [DOI] [PubMed] [Google Scholar]
- 16.Pijls NH, Uijen GJ, Hoevelaken A, et al. Mean transit time for the assessment of myocardial perfusion by videodensitometry. Circulation 1990;81(4):1331–1340. [DOI] [PubMed] [Google Scholar]
- 17.Rossi A, Merkus D, Klotz E, Mollet N, de Feyter PJ, Krestin GP. Stress myocardial perfusion: imaging with multidetector CT. Radiology 2014;270(1):25–46. [DOI] [PubMed] [Google Scholar]
- 18.Ho KT, Chua KC, Klotz E, Panknin C. Stress and rest dynamic myocardial perfusion imaging by evaluation of complete time-attenuation curves with dual-source CT. JACC Cardiovasc Imaging 2010;3(8):811–820. [DOI] [PubMed] [Google Scholar]
- 19.Bamberg F, Hinkel R, Schwarz F, et al. Accuracy of dynamic computed tomography adenosine stress myocardial perfusion imaging in estimating myocardial blood flow at various degrees of coronary artery stenosis using a porcine animal model. Invest Radiol 2012;47(1):71–77. [DOI] [PubMed] [Google Scholar]
- 20.Bartoli CR, Okabe K, Akiyama I, Coull B, Godleski JJ. Repeat microsphere delivery for serial measurement of regional blood perfusion in the chronically instrumented, conscious canine. J Surg Res 2008;145(1):135–141. [DOI] [PMC free article] [PubMed] [Google Scholar]
- 21.Molloi S, Zhou Y, Kassab GS. Regional volumetric coronary blood flow measurement by digital angiography: in vivo validation. Acad Radiol 2004;11(7):757–766. [DOI] [PubMed] [Google Scholar]
- 22.Canty JM, Jr, Judd RM, Brody AS, Klocke FJ. First-pass entry of nonionic contrast agent into the myocardial extravascular space. effects on radiographic estimates of transit time and blood volume. Circulation 1991;84(5):2071–2078. [DOI] [PubMed] [Google Scholar]
- 23.Ziemer BP, Hubbard L, Lipinski J, Molloi S. Dynamic CT perfusion measurement in a cardiac phantom. Int J Cardiovasc Imaging 2015;31(7):1451–1459. [DOI] [PMC free article] [PubMed] [Google Scholar]
- 24.Hubbard L, Ziemer B, Lipinski J, et al. Functional assessment of coronary artery disease using whole-heart dynamic computed tomographic perfusion. Circ Cardiovasc Imaging 2016;9(12):1–8. [DOI] [PMC free article] [PubMed] [Google Scholar]
- 25.Boone J, Strauss K, Cody D, et al. Size-specific dose estimates (SSDE) in pediatric and adult body CT examinations: report of AAPM task group 204. College Park, Md: American Association of Physicists in Medicine, 2011. [Google Scholar]
- 26.Le H, Wong JT, Molloi S. Estimation of regional myocardial mass at risk based on distal arterial lumen volume and length using 3D micro-CT images. Comput Med Imaging Graph 2008;32(6):488–501. [DOI] [PMC free article] [PubMed] [Google Scholar]
- 27.Dupont WD, Plummer WD, Jr. Power and sample size calculations for studies involving linear regression. Control Clin Trials 1998;19(6):589–601. [DOI] [PubMed] [Google Scholar]
- 28.Eldridge SM, Ukoumunne OC, Carlin JB. The intra-cluster correlation coefficient in cluster randomized trials: a review of definitions. Int Stat Rev 2009;77(3):378–394. [Google Scholar]
- 29.Lin LI. A concordance correlation coefficient to evaluate reproducibility. Biometrics 1989;45(1):255–268. [PubMed] [Google Scholar]
- 30.Baile EM, Paré PD, D’yachkova Y, Carere RG. Effect of contrast media on coronary vascular resistance: contrast-induced coronary vasodilation. Chest 1999;116(4):1039–1045. [DOI] [PubMed] [Google Scholar]
- 31.Cademartiri F, van der Lugt A, Luccichenti G, Pavone P, Krestin GP. Parameters affecting bolus geometry in CTA: a review. J Comput Assist Tomogr 2002;26(4):598–607. [DOI] [PubMed] [Google Scholar]
- 32.Schweiger GD, Chang PJ, Brown BP. Optimizing contrast enhancement during helical CT of the liver: a comparison of two bolus tracking techniques. AJR Am J Roentgenol 1998;171(6):1551–1558. [DOI] [PubMed] [Google Scholar]
- 33.Chen MY, Shanbhag SM, Arai AE. Submillisievert median radiation dose for coronary angiography with a second-generation 320-detector row CT scanner in 107 consecutive patients. Radiology 2013;267(1):76–85. [DOI] [PMC free article] [PubMed] [Google Scholar]
- 34.Kurata A, Kawaguchi N, Kido T, et al. Qualitative and quantitative assessment of adenosine triphosphate stress whole-heart dynamic myocardial perfusion imaging using 256-slice computed tomography. PLoS One 2013;8(12):e83950. [DOI] [PMC free article] [PubMed] [Google Scholar]
- 35.Carlsson M, Saeed M. Intracoronary injection of contrast media maps the territory of the coronary artery: an MRI technique for assessing the effects of locally delivered angiogenic therapies. Acad Radiol 2008;15(11):1354–1359. [DOI] [PubMed] [Google Scholar]


