Multiparametric MR imaging has high sensitivity in the detection of clinically important prostate cancer on a per-patient basis; however, on a per-lesion basis, a considerable number of clinically important lesions are missed.
Abstract
Purpose
To characterize clinically important prostate cancers missed at multiparametric (MP) magnetic resonance (MR) imaging.
Materials and Methods
The local institutional review board approved this HIPAA-compliant retrospective single-center study, which included 100 consecutive patients who had undergone MP MR imaging and subsequent radical prostatectomy. A genitourinary pathologist blinded to MP MR findings outlined prostate cancers on whole-mount pathology slices. Two readers correlated mapped lesions with reports of prospectively read MP MR images. Readers were blinded to histopathology results during prospective reading. At histopathologic examination, 80 clinically unimportant lesions (<5 mm; Gleason score, 3+3) were excluded. The same two readers, who were not blinded to histopathologic findings, retrospectively reviewed cancers missed at MP MR imaging and assigned a Prostate Imaging Reporting and Data System (PI-RADS) version 2 score to better understand false-negative lesion characteristics. Descriptive statistics were used to define patient characteristics, including age, prostate-specific antigen (PSA) level, PSA density, race, digital rectal examination results, and biopsy results before MR imaging. Student t test was used to determine any demographic differences between patients with false-negative MP MR imaging findings and those with correct prospective identification of all lesions.
Results
Of the 162 lesions, 136 (84%) were correctly identified with MP MR imaging. Size of eight lesions was underestimated. Among the 26 (16%) lesions missed at MP MR imaging, Gleason score was 3+4 in 17 (65%), 4+3 in one (4%), 4+4 in seven (27%), and 4+5 in one (4%). Retrospective PI-RADS version 2 scores were assigned (PI-RADS 1, n = 8; PI-RADS 2, n = 7; PI-RADS 3, n = 6; and PI-RADS 4, n = 5). On a per-patient basis, MP MR imaging depicted clinically important prostate cancer in 99 of 100 patients. At least one clinically important tumor was missed in 26 (26%) patients, and lesion size was underestimated in eight (8%).
Conclusion
Clinically important lesions can be missed or their size can be underestimated at MP MR imaging. Of missed lesions, 58% were not seen or were characterized as benign findings at second-look analysis. Recognition of the limitations of MP MR imaging is important, and new approaches to reduce this false-negative rate are needed.
© RSNA, 2017
Online supplemental material is available for this article.
Introduction
Prostate cancer is the most frequently diagnosed cancer in men, with the third highest mortality rate among all malignancies (1,2). The current standard of diagnosis relies on measurement of the prostate-specific antigen (PSA) level, digital rectal examination, and systematic transrectal ultrasonography (US)-guided 12-core biopsy. This has resulted in overdiagnosis of indolent cancers, which provides no benefit to the patient, and underdiagnosis of clinically important tumors, which potentially harms patients. The introduction of multiparametric (MP) magnetic resonance (MR) imaging and MR imaging/US fusion–guided biopsy has improved the detection of clinically important prostate cancers and reduced the detection of indolent cancers (3–10). Thus, MP MR imaging is increasingly used to diagnose prostate cancer.
Although the use of MP MR imaging has been validated in numerous studies, there remains a subset of patients in whom MR imaging fails to depict clinically important cancer (5,11–13). Recent studies correlating whole-mount pathology with MP MR imaging have shown that while MR imaging has excellent sensitivity on a per-patient basis, it is less accurate in the detection of all clinically important prostate tumors in a given patient (14–16). Since such studies, by necessity, occur in patients who received appropriate treatment and who incurred no penalty for these misses, there has not been much attention given to this phenomenon. However, it is apparent that as MP MR imaging is used more widely there is potential for underestimation of clinically important disease. A recent meta-analysis of seven studies including 526 patients showed a pooled sensitivity of 74% for MP MR imaging in the detection of clinically important cancers (13). When compared with the current paradigm of PSA measurement and transrectal US biopsy, the introduction of MP MR imaging is clearly an improvement; however, it shows that there is a small but important subset of the population in whom imaging fails to depict clinically important cancer (17,18). These missed cancers demand our attention if we hope to continually improve upon the existing imaging paradigm.
In addition to missing cancers, studies have also shown that MR imaging can lead to underestimation of the volume of prostate cancer. In an era in which patients increasingly opt for active surveillance protocols or focal therapy, the precision of MR imaging in the prediction of disease burden or tumor margins is essential, as underestimation of lesion volume could lead to inappropriate risk stratification, inadequate therapy, and a consequently unacceptable oncologic outcome (19–22).
The purpose of this study was to identify and characterize false-negative clinically important prostate cancers missed at MP MR imaging.
Materials and Methods
Study Design and Patient Population
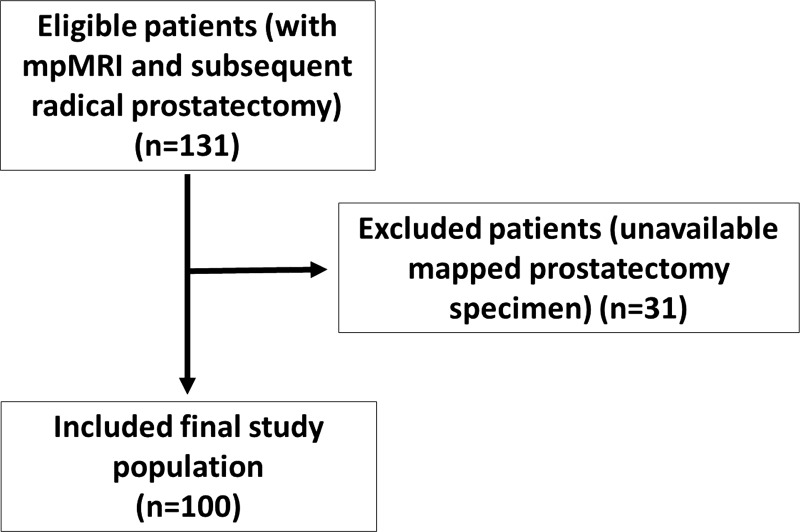
This retrospective study was approved by the local institutional review board (National Institutes of Health) and was compliant with the Health Insurance Portability and Accountability Act. Inclusion criteria included patients who underwent MP prostate MR imaging and robotic-assisted radical prostatectomy and pelvic lymph node dissection, with subsequent mapping of all lesions at whole-mount pathology between August 2011 and July 2014; 131 consecutive patients were eligible for this study. Patients were excluded if whole-mount pathology images were unavailable (n = 31) or if MP MR imaging findings were nondiagnostic (n = 0). A total of 100 patients met the inclusion criteria (Fig 1). Indications for MP MR imaging were staging after cancer-positive 12-core systematic transrectal US-guided and fused transrectal US and MR imaging–guided biopsy (n = 69), cancer-negative 12-core systematic transrectal US-guided biopsy with elevated PSA level (n = 15), and positive screening status prior to biopsy (biopsy naïve) (n = 16).
Figure 1:
Flowchart shows inclusion and exclusion criteria and the selection process used in this study.
Whole-Mount Pathology
After robotic-assisted radical prostatectomy, formalin-fixed whole-mount tissue specimens were placed in a patient-specific MR imaging–based mold that was three-dimensional printed prior to surgery and were cut into 6-mm slices, ensuring that tissue blocks corresponded to in vivo MR images (6). Tissue slices were stained with hematoxylin-eosin. A genitourinary pathologist (M.J.M., over 25 years of experience) interpreted pathologic specimens and demarcated all tumors with associated Gleason scores.
MR Examination and Image Interpretation
All patients underwent MP MR imaging performed with a 3.0-T MR imager (Achieva; Philips Healthcare, Best, the Netherlands) with three pulse sequences—triplanar T2-weighted, diffusion-weighted (DW), and dynamic contrast material–enhanced MR imaging (6). Images were acquired with a 16-channel surface coil (SENSE; Philips Healthcare) and an endorectal coil (BPX-30; Medrad, Pittsburgh, Pa) in all patients. MP MR imaging protocol parameters are detailed in Table 1. The studies underwent blinded centralized radiologic evaluation, and lesions were prospectively interpreted by two highly experienced genitourinary radiologists (P.L.C., B.T.; 15 and 8 years of experience, respectively). For MR image interpretation, a previously described in-house prostate MR imaging interpretation system was used (6). At the time of prospective read out, the Prostate Imaging Reporting and Data System (PI-RADS) version 2 system was not available; therefore, it could not be used. After pathologic assessment, each prostate MP MR imaging study was retrospectively reviewed, and each clinically important lesion (>5 mm, Gleason score >3+3) was assigned a PI-RADS version 2 score. The two largest important lesions (when present) per patient were included in the analysis.
Table 1.
MP MR Imaging Pulse Sequence Parameters

*For ADC map calculation, five evenly spaced b values (0–750 sec/mm2) were used.
†The b value was 2000 sec/mm2.
‡Dynamic contrast-enhanced (DCE) images were obtained before, during, and after gadopentetate dimeglumine administration (0.1 mmol/kg, 3 mL/sec). Each sequence was performed at a 5.6-second interval.
§There were no section gaps.
Correlation of MR Imaging and Pathology Findings
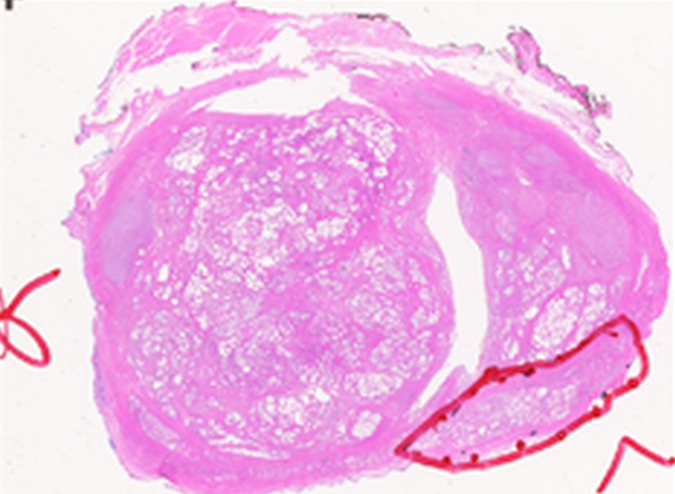
All MR imaging studies were evaluated as to the accuracy of initial prospective MR image interpretation. The concordance of MR image interpretation and whole-mount mapped prostatectomy maps was evaluated on a combined lesion and patient basis. Lesions were assigned to one of four categories: category 1, all clinically important lesions were prospectively identified at MP MR imaging; category 2, all important lesions were missed at MP MR imaging; category 3, at least one important lesion was prospectively identified but another important lesion was missed; category 4, lesion was correctly identified but with substantial underestimation of tumor size (Figs 2–5, Movies 1–6 [online]).
Figure 2a:
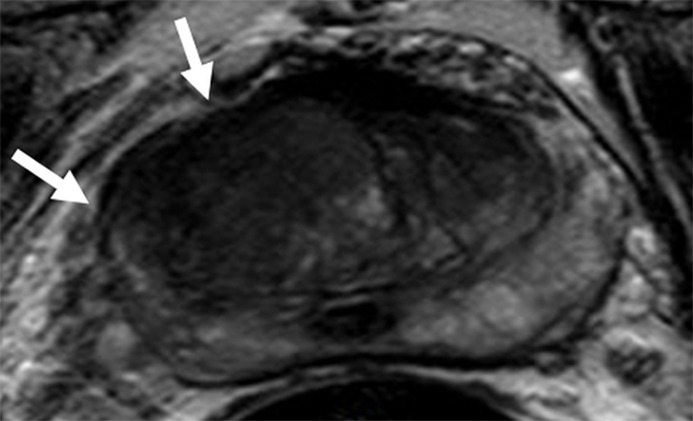
Images in a 71-year-old patient with a history of previous negative transrectal US-guided biopsy and a serum PSA level of 16.09 ng/mL. (a) Axial T2-weighted MR image shows an area of low signal intensity in the right anterior transition zone (arrows). (b) Axial apparent diffusion coefficient (ADC) map obtained with DW MR imaging shows a hypointense lesion in this same location (arrows). (c) DW (b = 2000 sec/mm2 ) MR image shows this lesion (arrows) as a hyperintense focus. (d) Whole-mount pathologic specimen obtained at robotic-assisted prostatectomy shows Gleason 4+4 disease (red outline) in the same location. MP MR imaging correctly depicted the tumor and enabled us to estimate the tumor burden in this patient.
Figure 5a:
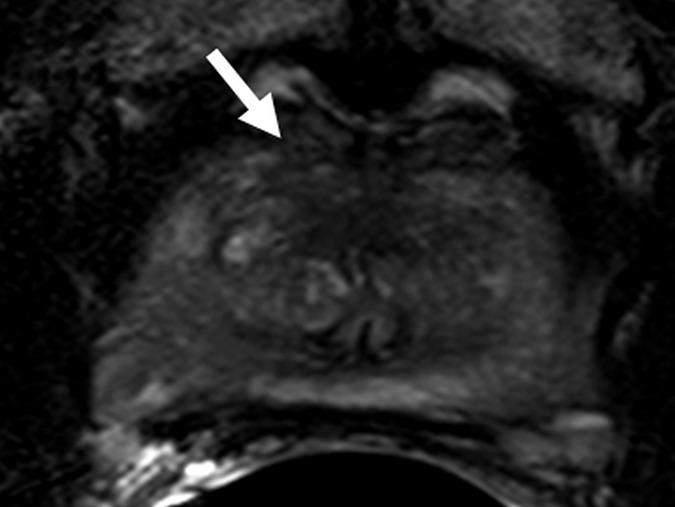
Images in a 63-year-old biopsy-naïve patient with a PSA level of 6.25 ng/mL. (a) Axial T2-weighted MR image shows an area of low signal intensity (arrow) in the midline anterior transition zone. (b) Axial ADC map obtained with DW imaging reveals a hypointense lesion (arrow) in the same location. (c) DW MR image (b = 2000 sec/mm2 ) shows the lesion (arrow) as a mildly hyperintense focus. (d) Dynamic contrast-enhanced MR image shows corresponding mild focal hyperenhancement (arrow). (e) Whole-mount pathologic specimen obtained at robotic-assisted prostatectomy shows Gleason 4+4 disease corresponding to the identified lesion (red outline). However, the extent of the lesion was underestimated with MR imaging, particularly in the left transition zone. In addition, a Gleason 3+4 lesion was seen in the right peripheral zone (red outline). This lesion was not apparent at prospective or retrospective review (PI-RADS category 1). See also Movies E4–E6 (online).
Movie 1.
Cine T2-weighted magnetic resonance (MR) images in a 55-year-old patient with a history of previous transrectal ultrasonography (US)-guided prostate biopsy, Gleason 3+3 disease, and a prostate-specific antigen (PSA) level of 3.75 ng/mL (same patient as in Figure 3) show benign prostatic hyperplasia-related changes within the transition zone, without evidence of a focal lesion in the prostate. This patient underwent robotic-assisted prostatectomy. Whole-mount pathologic specimens showed Gleason 3+4 disease in the left midperipheral zone (Fig 4e). Multiparametric MR imaging failed to depict left midperipheral zone prostate cancer.
Figure 3a:
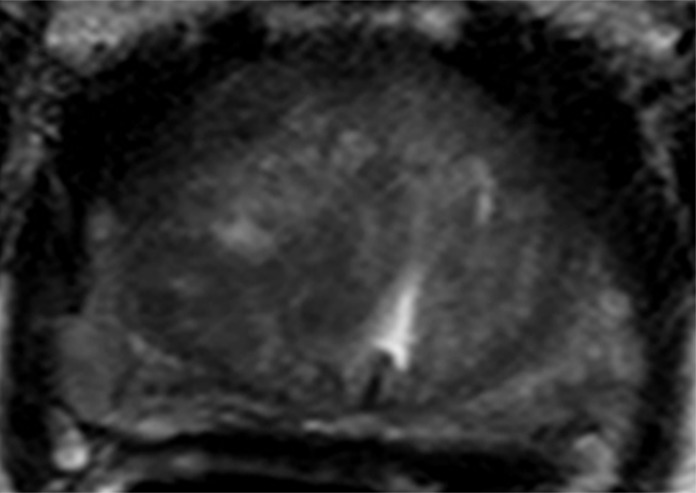
Images in a 55-year-old patient with a history of previous transrectal US-guided prostate biopsy with Gleason 3+3 disease and a PSA level of 3.75 ng/mL. (a) Axial T2-weighted MR image, (b) axial ADC map obtained with DW MR imaging (b = 2000 sec/mm2 ), and (c, d) dynamic contrast-enhanced MR images do not show any clinically important abnormality. (e) Whole-mount pathologic specimen obtained at robotic-assisted prostatectomy shows Gleason 3+4 disease (red outline) in the left midperipheral zone. See also Movies 1–3 (online).
Figure 4e:
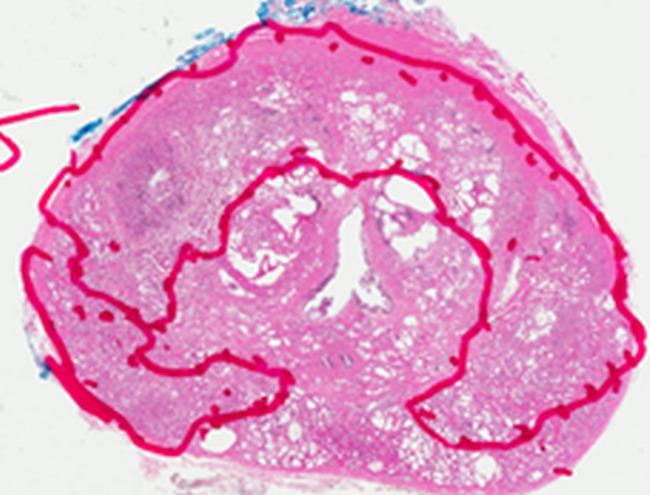
Images in a 55-year-old biopsy-naïve patient with a PSA level of 7.07 ng/mL. (a) Axial T2-weighted MR image shows an area of low signal intensity (arrow) in the right anterior transition zone. (b) Axial ADC map obtained reveals a hypointense lesion (arrow) in the same location. (c) DW MR image (b = 2000 sec/mm2 ) shows the lesion (arrow) as a hyperintense focus. (d) Dynamic contrast-enhanced MR image shows an early focal hyperenhancing lesion (arrow) in the right anterior transition zone. (e) Whole-mount pathologic specimen obtained at robotic-assisted prostatectomy shows Gleason 3+4 disease (red outline). The extent of the lesion is considerably larger than what was predicted at initial MR imaging.
Movie 2.
Apparent diffusion coefficient map of diffusion-weighted MR images in a 55-year-old patient with a history of previous transrectal US-guided prostate biopsy, Gleason 3+3 disease, and a PSA level of 3.75 ng/mL (same patient as in Figure 3) shows benign prostatic hyperplasia-related changes within the transition zone, without evidence of a focal lesion in the prostate. This patient underwent robotic-assisted prostatectomy. Whole-mount pathologic specimens showed Gleason 3+4 disease in the left midperipheral zone (Fig 4e). Multiparametric MR imaging failed to depict left midperipheral zone prostate cancer.
Movie 3.
Cine diffusion-weighted MR images (b = 2000 sec/mm2) in a 55-year-old patient with a history of previous transrectal US-guided prostate biopsy, Gleason 3+3 disease, and a PSA level of 3.75 ng/mL (same patient as in Figure 3) show benign prostatic hyperplasia-related changes within the transition zone, without evidence of a focal lesion in the prostate. This patient underwent robotic-assisted prostatectomy. Whole-mount pathologic specimens showed Gleason 3+4 disease in the left midperipheral zone (Fig 4e). Multiparametric MR imaging did not depict left midperipheral zone prostate cancer.
Movie 4.
Cine T2-weighted MR images in a 63-year-old biopsy-naïve patient with a PSA level of 6.25 ng/mL (same patient as in Figure 5) show an area of low signal intensity in the midline anterior transition zone. This patient underwent robotic-assisted prostatectomy. Whole-mount pathology specimens showed Gleason 4+4 disease corresponding to the identified lesion (Fig 5e). However, MR imaging, particularly in the left transition zone, resulted in underestimation of the extent of the lesion. In addition, a Gleason 3+4 lesion was present in the right peripheral zone (Fig 5e). MP MR imaging did not depict right midperipheral zone prostate cancer lesion.
Figure 5e:
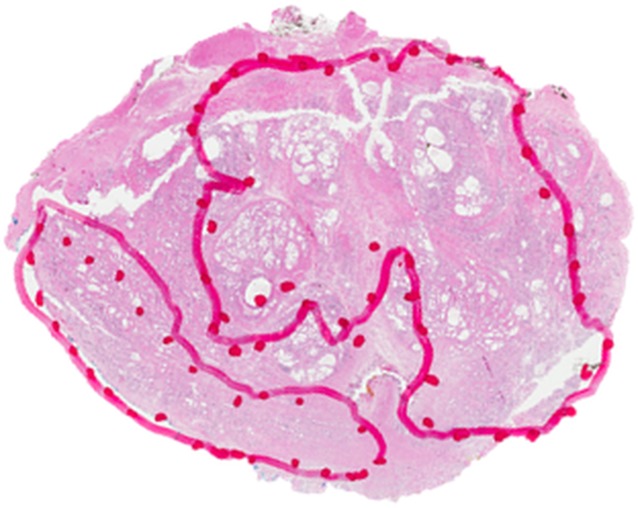
Images in a 63-year-old biopsy-naïve patient with a PSA level of 6.25 ng/mL. (a) Axial T2-weighted MR image shows an area of low signal intensity (arrow) in the midline anterior transition zone. (b) Axial ADC map obtained with DW imaging reveals a hypointense lesion (arrow) in the same location. (c) DW MR image (b = 2000 sec/mm2 ) shows the lesion (arrow) as a mildly hyperintense focus. (d) Dynamic contrast-enhanced MR image shows corresponding mild focal hyperenhancement (arrow). (e) Whole-mount pathologic specimen obtained at robotic-assisted prostatectomy shows Gleason 4+4 disease corresponding to the identified lesion (red outline). However, the extent of the lesion was underestimated with MR imaging, particularly in the left transition zone. In addition, a Gleason 3+4 lesion was seen in the right peripheral zone (red outline). This lesion was not apparent at prospective or retrospective review (PI-RADS category 1). See also Movies E4–E6 (online).
Movie 5.
Apparent diffusion coefficient map of diffusion-weighted images in a 63-year-old biopsy-naïve patient with a PSA level of 6.25 ng/mL (same patient as in Figure 5) shows a hypointense lesion in the same location as in Movie 4. This patient underwent robotic-assisted prostatectomy. Whole-mount pathology specimens showed Gleason 4+4 disease corresponding to the identified lesion (Fig 5e). However, MR imaging, particularly in the left transition zone, resulted in underestimation of the extent of the lesion. In addition, a Gleason 3+4 lesion was present in the right peripheral zone (Fig 5e). MP MR imaging did not depict right midperipheral zone prostate cancer lesion.
Movie 6.
Cine DW images (b = 2000 sec/mm2) in a 63-year-old biopsy-naïve patient with a PSA level of 6.25 ng/mL (same patient as in Figure 5) show the lesion is mildly hyperintense. The patient underwent robotic-assisted prostatectomy. Whole-mount pathology specimens showed Gleason 4+4 disease corresponding to the identified lesion (Fig 5e). However, MR imaging, particularly in the left transition zone, resulted in underestimation of the extent of the lesion. In addition, a Gleason 3+4 lesion was present in the right peripheral zone (Fig 5e). MP MR imaging did not depict right midperipheral zone prostate cancer lesion.
Figure 2b:
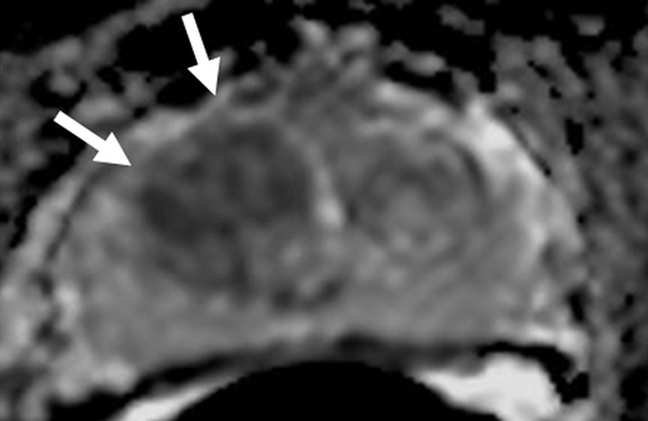
Images in a 71-year-old patient with a history of previous negative transrectal US-guided biopsy and a serum PSA level of 16.09 ng/mL. (a) Axial T2-weighted MR image shows an area of low signal intensity in the right anterior transition zone (arrows). (b) Axial apparent diffusion coefficient (ADC) map obtained with DW MR imaging shows a hypointense lesion in this same location (arrows). (c) DW (b = 2000 sec/mm2 ) MR image shows this lesion (arrows) as a hyperintense focus. (d) Whole-mount pathologic specimen obtained at robotic-assisted prostatectomy shows Gleason 4+4 disease (red outline) in the same location. MP MR imaging correctly depicted the tumor and enabled us to estimate the tumor burden in this patient.
Figure 2c:
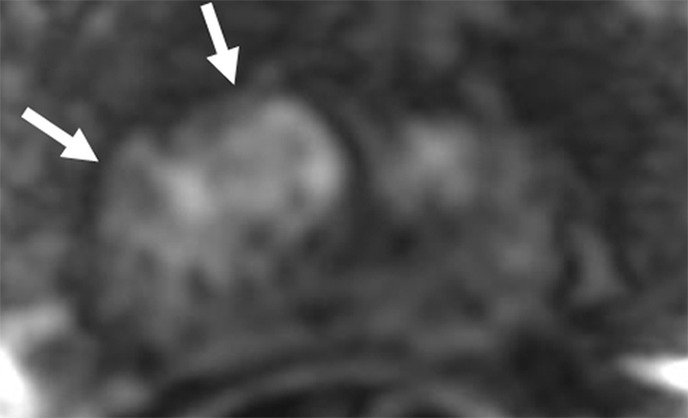
Images in a 71-year-old patient with a history of previous negative transrectal US-guided biopsy and a serum PSA level of 16.09 ng/mL. (a) Axial T2-weighted MR image shows an area of low signal intensity in the right anterior transition zone (arrows). (b) Axial apparent diffusion coefficient (ADC) map obtained with DW MR imaging shows a hypointense lesion in this same location (arrows). (c) DW (b = 2000 sec/mm2 ) MR image shows this lesion (arrows) as a hyperintense focus. (d) Whole-mount pathologic specimen obtained at robotic-assisted prostatectomy shows Gleason 4+4 disease (red outline) in the same location. MP MR imaging correctly depicted the tumor and enabled us to estimate the tumor burden in this patient.
Figure 2d:
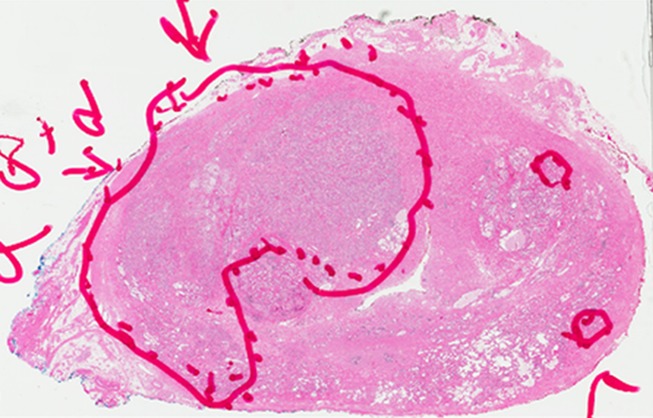
Images in a 71-year-old patient with a history of previous negative transrectal US-guided biopsy and a serum PSA level of 16.09 ng/mL. (a) Axial T2-weighted MR image shows an area of low signal intensity in the right anterior transition zone (arrows). (b) Axial apparent diffusion coefficient (ADC) map obtained with DW MR imaging shows a hypointense lesion in this same location (arrows). (c) DW (b = 2000 sec/mm2 ) MR image shows this lesion (arrows) as a hyperintense focus. (d) Whole-mount pathologic specimen obtained at robotic-assisted prostatectomy shows Gleason 4+4 disease (red outline) in the same location. MP MR imaging correctly depicted the tumor and enabled us to estimate the tumor burden in this patient.
Figure 3b:
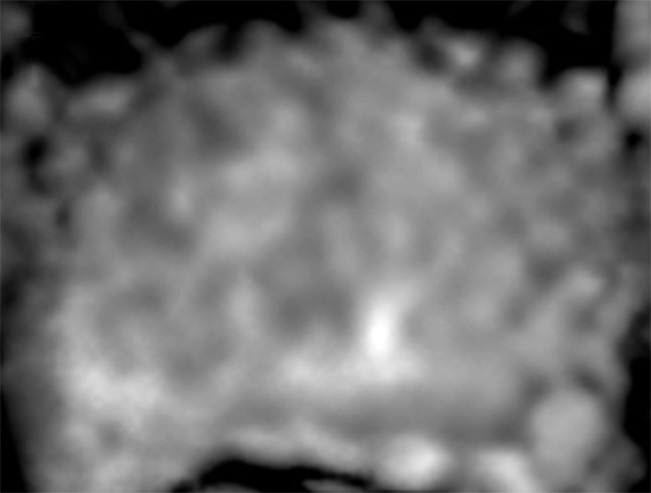
Images in a 55-year-old patient with a history of previous transrectal US-guided prostate biopsy with Gleason 3+3 disease and a PSA level of 3.75 ng/mL. (a) Axial T2-weighted MR image, (b) axial ADC map obtained with DW MR imaging (b = 2000 sec/mm2 ), and (c, d) dynamic contrast-enhanced MR images do not show any clinically important abnormality. (e) Whole-mount pathologic specimen obtained at robotic-assisted prostatectomy shows Gleason 3+4 disease (red outline) in the left midperipheral zone. See also Movies 1–3 (online).
Figure 3c:

Images in a 55-year-old patient with a history of previous transrectal US-guided prostate biopsy with Gleason 3+3 disease and a PSA level of 3.75 ng/mL. (a) Axial T2-weighted MR image, (b) axial ADC map obtained with DW MR imaging (b = 2000 sec/mm2 ), and (c, d) dynamic contrast-enhanced MR images do not show any clinically important abnormality. (e) Whole-mount pathologic specimen obtained at robotic-assisted prostatectomy shows Gleason 3+4 disease (red outline) in the left midperipheral zone. See also Movies 1–3 (online).
Figure 3d:
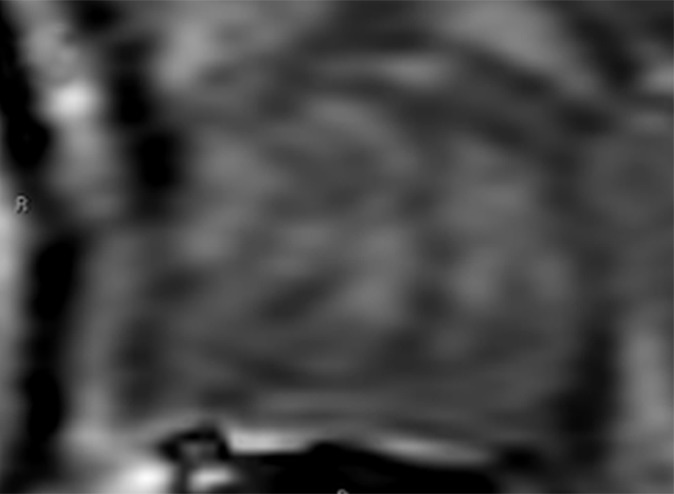
Images in a 55-year-old patient with a history of previous transrectal US-guided prostate biopsy with Gleason 3+3 disease and a PSA level of 3.75 ng/mL. (a) Axial T2-weighted MR image, (b) axial ADC map obtained with DW MR imaging (b = 2000 sec/mm2 ), and (c, d) dynamic contrast-enhanced MR images do not show any clinically important abnormality. (e) Whole-mount pathologic specimen obtained at robotic-assisted prostatectomy shows Gleason 3+4 disease (red outline) in the left midperipheral zone. See also Movies 1–3 (online).
Figure 3e:
Images in a 55-year-old patient with a history of previous transrectal US-guided prostate biopsy with Gleason 3+3 disease and a PSA level of 3.75 ng/mL. (a) Axial T2-weighted MR image, (b) axial ADC map obtained with DW MR imaging (b = 2000 sec/mm2 ), and (c, d) dynamic contrast-enhanced MR images do not show any clinically important abnormality. (e) Whole-mount pathologic specimen obtained at robotic-assisted prostatectomy shows Gleason 3+4 disease (red outline) in the left midperipheral zone. See also Movies 1–3 (online).
Figure 4a:
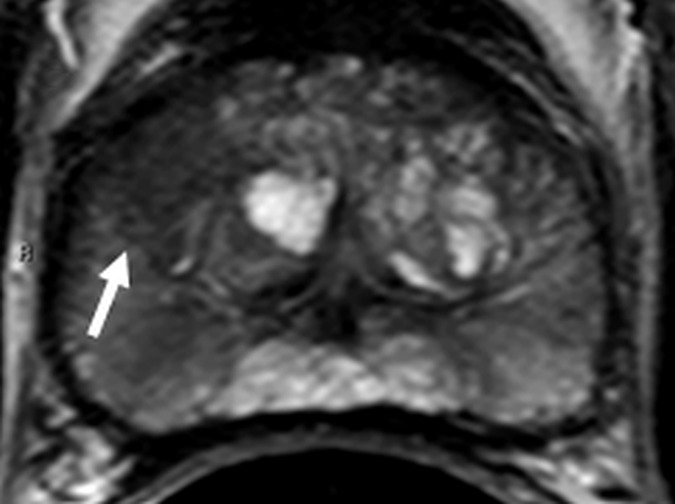
Images in a 55-year-old biopsy-naïve patient with a PSA level of 7.07 ng/mL. (a) Axial T2-weighted MR image shows an area of low signal intensity (arrow) in the right anterior transition zone. (b) Axial ADC map obtained reveals a hypointense lesion (arrow) in the same location. (c) DW MR image (b = 2000 sec/mm2 ) shows the lesion (arrow) as a hyperintense focus. (d) Dynamic contrast-enhanced MR image shows an early focal hyperenhancing lesion (arrow) in the right anterior transition zone. (e) Whole-mount pathologic specimen obtained at robotic-assisted prostatectomy shows Gleason 3+4 disease (red outline). The extent of the lesion is considerably larger than what was predicted at initial MR imaging.
Figure 4b:
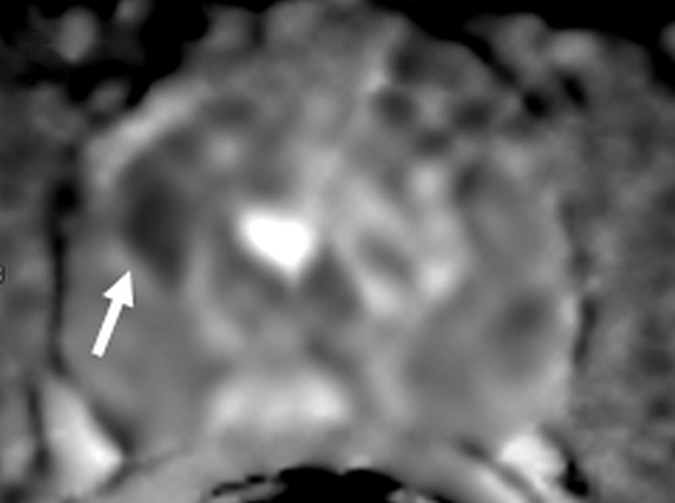
Images in a 55-year-old biopsy-naïve patient with a PSA level of 7.07 ng/mL. (a) Axial T2-weighted MR image shows an area of low signal intensity (arrow) in the right anterior transition zone. (b) Axial ADC map obtained reveals a hypointense lesion (arrow) in the same location. (c) DW MR image (b = 2000 sec/mm2 ) shows the lesion (arrow) as a hyperintense focus. (d) Dynamic contrast-enhanced MR image shows an early focal hyperenhancing lesion (arrow) in the right anterior transition zone. (e) Whole-mount pathologic specimen obtained at robotic-assisted prostatectomy shows Gleason 3+4 disease (red outline). The extent of the lesion is considerably larger than what was predicted at initial MR imaging.
Figure 4c:
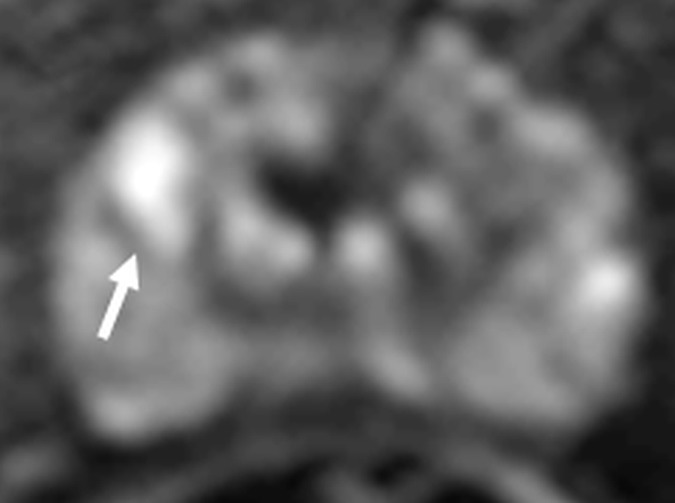
Images in a 55-year-old biopsy-naïve patient with a PSA level of 7.07 ng/mL. (a) Axial T2-weighted MR image shows an area of low signal intensity (arrow) in the right anterior transition zone. (b) Axial ADC map obtained reveals a hypointense lesion (arrow) in the same location. (c) DW MR image (b = 2000 sec/mm2 ) shows the lesion (arrow) as a hyperintense focus. (d) Dynamic contrast-enhanced MR image shows an early focal hyperenhancing lesion (arrow) in the right anterior transition zone. (e) Whole-mount pathologic specimen obtained at robotic-assisted prostatectomy shows Gleason 3+4 disease (red outline). The extent of the lesion is considerably larger than what was predicted at initial MR imaging.
Figure 4d:
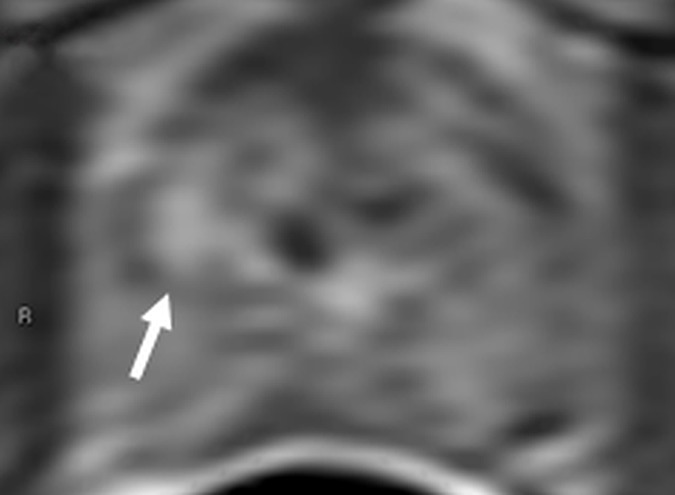
Images in a 55-year-old biopsy-naïve patient with a PSA level of 7.07 ng/mL. (a) Axial T2-weighted MR image shows an area of low signal intensity (arrow) in the right anterior transition zone. (b) Axial ADC map obtained reveals a hypointense lesion (arrow) in the same location. (c) DW MR image (b = 2000 sec/mm2 ) shows the lesion (arrow) as a hyperintense focus. (d) Dynamic contrast-enhanced MR image shows an early focal hyperenhancing lesion (arrow) in the right anterior transition zone. (e) Whole-mount pathologic specimen obtained at robotic-assisted prostatectomy shows Gleason 3+4 disease (red outline). The extent of the lesion is considerably larger than what was predicted at initial MR imaging.
Figure 5b:

Images in a 63-year-old biopsy-naïve patient with a PSA level of 6.25 ng/mL. (a) Axial T2-weighted MR image shows an area of low signal intensity (arrow) in the midline anterior transition zone. (b) Axial ADC map obtained with DW imaging reveals a hypointense lesion (arrow) in the same location. (c) DW MR image (b = 2000 sec/mm2 ) shows the lesion (arrow) as a mildly hyperintense focus. (d) Dynamic contrast-enhanced MR image shows corresponding mild focal hyperenhancement (arrow). (e) Whole-mount pathologic specimen obtained at robotic-assisted prostatectomy shows Gleason 4+4 disease corresponding to the identified lesion (red outline). However, the extent of the lesion was underestimated with MR imaging, particularly in the left transition zone. In addition, a Gleason 3+4 lesion was seen in the right peripheral zone (red outline). This lesion was not apparent at prospective or retrospective review (PI-RADS category 1). See also Movies E4–E6 (online).
Figure 5c:

Images in a 63-year-old biopsy-naïve patient with a PSA level of 6.25 ng/mL. (a) Axial T2-weighted MR image shows an area of low signal intensity (arrow) in the midline anterior transition zone. (b) Axial ADC map obtained with DW imaging reveals a hypointense lesion (arrow) in the same location. (c) DW MR image (b = 2000 sec/mm2 ) shows the lesion (arrow) as a mildly hyperintense focus. (d) Dynamic contrast-enhanced MR image shows corresponding mild focal hyperenhancement (arrow). (e) Whole-mount pathologic specimen obtained at robotic-assisted prostatectomy shows Gleason 4+4 disease corresponding to the identified lesion (red outline). However, the extent of the lesion was underestimated with MR imaging, particularly in the left transition zone. In addition, a Gleason 3+4 lesion was seen in the right peripheral zone (red outline). This lesion was not apparent at prospective or retrospective review (PI-RADS category 1). See also Movies E4–E6 (online).
Figure 5d:
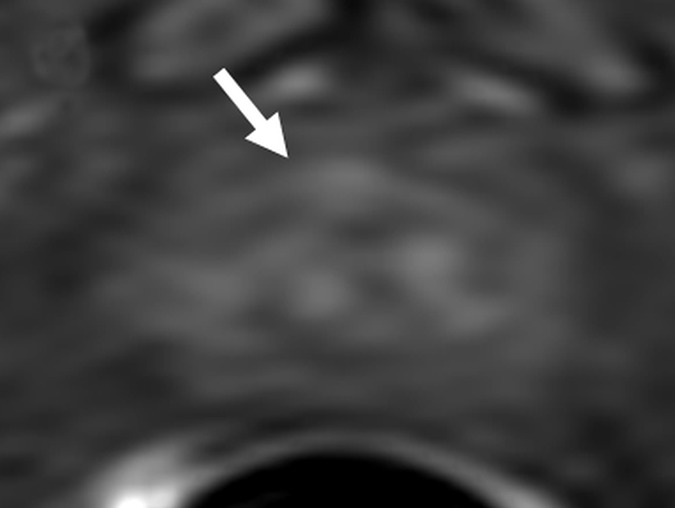
Images in a 63-year-old biopsy-naïve patient with a PSA level of 6.25 ng/mL. (a) Axial T2-weighted MR image shows an area of low signal intensity (arrow) in the midline anterior transition zone. (b) Axial ADC map obtained with DW imaging reveals a hypointense lesion (arrow) in the same location. (c) DW MR image (b = 2000 sec/mm2 ) shows the lesion (arrow) as a mildly hyperintense focus. (d) Dynamic contrast-enhanced MR image shows corresponding mild focal hyperenhancement (arrow). (e) Whole-mount pathologic specimen obtained at robotic-assisted prostatectomy shows Gleason 4+4 disease corresponding to the identified lesion (red outline). However, the extent of the lesion was underestimated with MR imaging, particularly in the left transition zone. In addition, a Gleason 3+4 lesion was seen in the right peripheral zone (red outline). This lesion was not apparent at prospective or retrospective review (PI-RADS category 1). See also Movies E4–E6 (online).
All important lesions that were missed or underestimated were evaluated with a second-look interpretation to identify whether the lesion was missed because of misinterpretation or because it was truly not visible on the MR image. If the lesion was seen at the second look, a PI-RADS version 2 score was assigned for that particular lesion. Lesions that were missed or underestimated at MR imaging also underwent a second look by two pathologists (M.J.M., V.M.) for ultrastructural differences in comparison with true-positive lesions identified at MR imaging.
Statistical Analyses
Descriptive statistics were used to define patient characteristics, including patient age, PSA, PSA density, race, digital rectal examination results, and biopsy results prior to MR imaging. The Student t test and Mann-Whitney U test were used to determine any demographic differences between the patients with false-negative MP MR imaging findings and those with correct prospective identification of all lesions.
Characteristics of missed lesions, such as their location (peripheral zone vs transition zone), level (apex, mid, or base), and Gleason and PI-RADS version 2 scores, were defined descriptively. For patients in whom lesions were missed during prospective read outs, an additional paired volumetric comparison between missed and detected lesions with the Wilcoxon signed-rank test was performed.
Results
Patient Population
A total of 100 patients who underwent MP MR imaging and subsequent radical prostatectomy with mapped whole-mount specimens processed within patient-specific molds were evaluated. Patient age, PSA, and PSA density results are presented in Table 2. Digital rectal examination results included normal findings (n = 42), an enlarged prostate gland (n = 22) without focal nodules, and positive findings with focal nodules (n = 13); 23 patients deferred digital rectal examination. Patient race was recorded as white (n = 67), African-American (n = 28), or other (n = 5). Mean duration between MR imaging and prostatectomy was 128 days (median, 120 days; range, 2–390 days).
Table 2.
Age and PSA Level
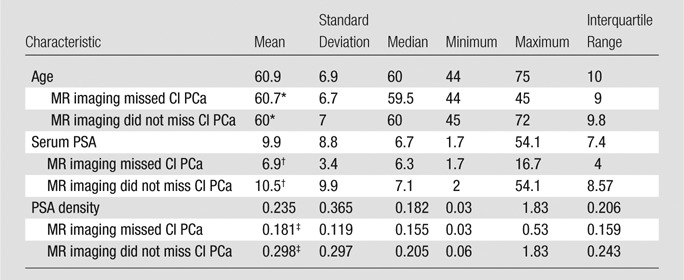
Note.—CI PCa = clinically important prostate cancer.
*P = .686.
†P = .134.
‡P = .027.
Patient- and Lesion-based Analyses
In 99 of 100 patients, at least one clinically important cancer was detected at initial MR image interpretation (99%). In one patient (age, 59 years; PSA level, 3.75 ng/mL; PSA density, 0.045 ng/ml2), all lesions were missed at MR imaging. At least one clinically important lesion was missed in 26 (26%) patients, whereas the size of a clinically important cancer was underestimated in eight (8%). Overall, at least one clinically important tumor was either underestimated in size or missed in 31 (31%) of 100 patients. With the Student t test, there was no significant difference in the ages of patients in whom important cancer was missed at MR imaging (P = .686). With the Mann-Whitney U test, no significant difference was found between PSA values in patients in whom an important cancer was missed at MR imaging and PSA values in patients in whom no important cancer was missed at MR imaging (P = .134); whereas PSA density was significantly lower in patients in whom tumors were missed (P = .027) (Table 2). In one patient (age, 59 years; PSA level, 3.75 ng/mL; PSA density, 0.045 ng/ml2), all lesions were missed at MR imaging.
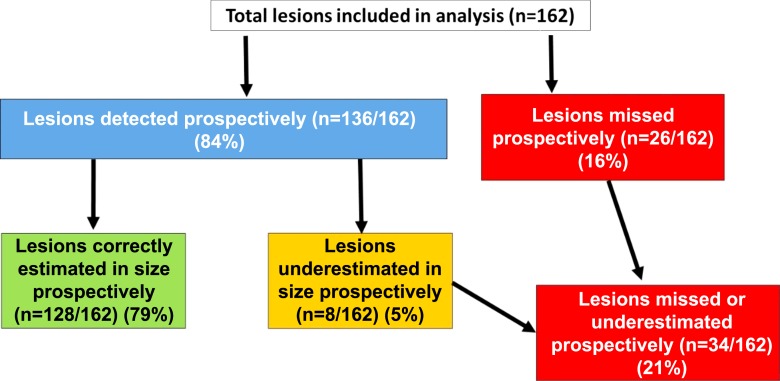
A total of 242 lesions in 100 patients was identified at whole-mount histology. Eighty lesions (<5 mm, Gleason score ≤3+3) were not included in the analysis, as they were not deemed clinically important. A total of 162 clinically important lesions was evaluated in the final analysis (Gleason score 3+3, n = 1 [0.6%]; Gleason score 3+4, n = 86 [53.1%]; Gleason score 4+3, n = 11 [6.8%]; Gleason score 4+4, n = 50 [30.9%]; Gleason score 4+5, n = 14 [8.6%]). Of these 162 lesions, 136 (84.0%) were correctly identified at MR imaging (Gleason score 3+3, n = 1 [0.6%]; Gleason score 3+4, n = 69 [42.6%]; Gleason score 4+3, n = 11 [6.8%]; Gleason score 4+4, n = 50 [26.5%]; Gleason score 4+5, n = 14 [8.0%]). Eight (4.9%) of 162 lesions were prospectively identified but were underestimated in terms of tumor size at MR imaging (Gleason score 3+4, n = 5 [3.1%]; Gleason score 4+4, n = 2 [1.2%]; Gleason score 4+5, n = 1 [0.6%]) (Fig 6).
Figure 6:
Flowchart shows results of lesion-based analysis.
Twenty-six of 162 (16%) lesions were not seen at initial MR image interpretation (one lesion per patient). Gleason scores of missed tumors were 3+4 (n = 17 [65%]), 4+3 (n = 1 [4%]), 4+4 (n = 7 [27%]), and 4+5 (n = 1 [4%]). The majority of the missed lesions were located in the peripheral zone (n = 16 [62%]); 12 (46%) were in the apex, 12 (46%) were in the midprostate, and two (8%) were in the base (Table 3). At retrospective review, eight (31%) PI-RADS 1 lesions were not visible on MP MR images, and 18 (69%) lesions were retrospectively visible (PI-RADS 2, n = 7 [27%]; PI-RADS 3, n = 6 [23%]; PI-RADS 4, n = 5 [20%]). Of the eight PI-RADS 1 lesions, five (62%) were Gleason 3+4 lesions, and three (38%) were Gleason 4+4 lesions (Table 4).
Table 3.
Properties of Lesions Missed at MR Imaging
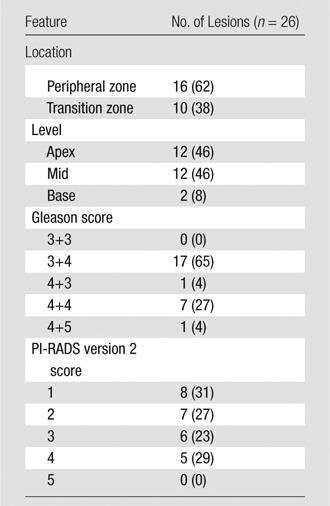
Note.—Data in parentheses are percentages.
Table 4.
PI-RADS Score versus Gleason Score for Missed Lesions
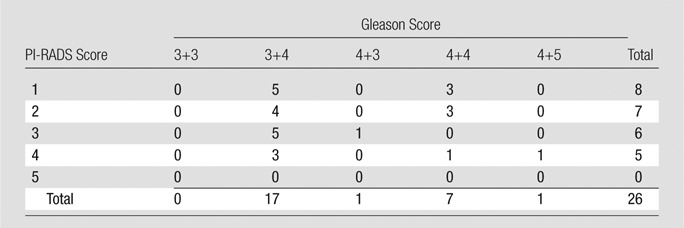
Note.—Data are number of lesions.
Of the 26 patients with a missed lesion at MR imaging, 25 had an additional lesion that was detected with MR imaging. Paired volumetric comparison between missed and detected lesions in these patients revealed that the missed lesions had smaller volume compared with detected lesions (mean size, 0.86 mL vs 2.13 mL, P < .001) (Table 5). Second-look pathology enabled us to confirm the initial diagnosis in each lesion either missed or underestimated at MR imaging and revealed no ultrastructural difference (eg, sparse or cribriform cancer or intraductal variant cancer) between them and the true-positive lesions at MR imaging.
Table 5.
Paired Volumetric Comparison of Missed and Detected Lesions

Note.—Data in parentheses are the 95% confidence interval.
Discussion
In this single-center retrospective study, 26 (16%) of 162 clinically important prostate cancer lesions were not identified at initial MR image interpretation (84% sensitivity). This is concordant with recent studies correlating whole-mount pathology with MP MR imaging. Although our study supports the previous literature in showing excellent negative predictive value (99%) for clinically important cancer on a per-patient basis, on a per-lesion basis, MP MR imaging was less accurate. To some extent, the excellent results with MR imaging on a per-patient basis are predictable since the study population was selected for and underwent prostatectomy. However, it is not possible to know the false-negative rate in patients who do not undergo prostatectomy, especially given the slow natural history of prostate cancer. Such data can only be inferred from data obtained from patients undergoing surgery.
The overall results of this study are consistent with those reported in the literature. Rosenkrantz et al (15) showed that MP MR imaging had a sensitivity of 76% when compared with matched pathology specimens. Similar studies by Le et al (14) and Russo et al (23) using whole-mount pathology as the reference standard showed 80% and 90% sensitivity for index lesions. Russo et al (23) found that although MP MR imaging was excellent in the detection of dominant and index lesions, sensitivity in the detection of lesions of all sizes was only 64%. Le et al (14) similarly reported an overall sensitivity of 47% in the detection of all lesions at MP MR imaging. In addition, they found that nearly 30% of tumors with a Gleason score of 7 or higher and larger than 1.0 cm were missed at imaging (14). This analysis did not draw a distinction between index and secondary lesions, as the assignments can be subjective. A recent study by De Visschere et al (16) included 830 patients who underwent MR imaging of the prostate at 1.5 T with an endorectal coil. MR findings were negative in 391 patients, and during 2-year follow-up, prostate cancer was detected in 31.7% of these patients and 67.7% of the detected lesions were classified as Gleason 3+3, whereas the remainder were scored as Gleason 3+4 or higher. De Visschere et al (16) reported a negative predictive value of 95.4% at MR imaging in patients with high-grade cancers, and they concluded that the majority of missed lesions were low grade and confined to the organ.
Retrospective review of MP MR images in patients with missed lesions in our study revealed that the majority of missed lesions had a lower PI-RADS category score, and prostate cancer was multifocal in these patients. A paired analysis in patients in whom prospective reading missed lesions revealed that missed lesions were two to three times smaller in volume (0.86 mL vs 2.13 mL, P < .001), which can be possibly explained by limitations associated with spatial resolution of MP MR imaging. Part of the explanation of these misses may lie in the “satisfaction of search” phenomenon, by which the detection of one clinically important finding may hinder the detection of a second clinically important finding (24). Peripheral zone hemorrhage, a known hindrance to the accuracy of MP MR imaging, was present in one lesion missed at MR imaging (25). More interesting is the subset of missed lesions that could not be seen despite focused search on second look. This suggests truly invisible lesions do exist, despite the fact that they harbor clinically important cancer. A study by Vargas et al retrospectively correlated prostate cancers with a Gleason score greater than 4+3 with the PI-RADS scoring system (26). They found that seven of 206 tumors were invisible (PI-RADS category 1), including lesions with pathologic volume of more than 0.5 mL. This finding is similar to findings in our cohort, in which three of 162 tumors with a Gleason score greater than 4+3 were categorized as PI-RADS category 1 at second-look review.
In our study, there was substantial underestimation of tumor size in eight (8%) of 100 patients. Bratan et al (27) evaluated 202 patients who underwent MP MR imaging prior to radical prostatectomy and found that two readers underestimated tumor volume with all pulse sequences. They found that, on average, MR imaging resulted in underestimation of lesion volume by approximately 82%–83% of the true histologic lesion volume (27). This has major implications in this era of focal therapy and growing enrollment in active surveillance with increased reliance on imaging (28,29). Careful selection of patients undergoing focal therapy is necessary, and the selection should not be entirely based on size, as noted previously by Le et al (14). Moreover, the recommended treatment plan should encompass adequate margins beyond the lesion visible at MP MR imaging. In a cohort of patients enrolled in active surveillance, fusion biopsy resulted in better estimation of tumor volume than did nontargeted core biopsy; however, our study highlights the potential risk of inappropriate risk stratification that may occur (30).
We could not identify any consistent clinical features in patients with missed MP MR imaging cancers. An interesting finding was that PSA values were lower in patients with missed lesions than in patients without missed lesions. Whether lesions that are invisible or difficult to see on MP MR images produce less PSA or whether there is some other cause of this observation awaits further evaluation.
Our study had several limitations. The majority of patients had undergone at least one previous biopsy, and the study population consisted of patients referred to one institution. This could have introduced selection bias for hard-to-find lesions. Only the largest two lesions in all whole-mount specimens were evaluated. This would tend to improve the performance of MP MR imaging (31). The goal of our study was to evaluate why important lesions are missed; therefore, small lesions were not analyzed. Related to this is our threshold for clinically important prostate cancer (>5 mm or Gleason score >3+3), which does not account for high-volume Gleason 3+3 lesions. However, such cases were not observed in this population. Finally, assessment of substantial underestimation of tumor size was performed on a subjective basis.
How can the false-negative rate of MP MR imaging be reduced? Since many missed lesions were retrospectively judged to be PI-RADS category 3 or 4 lesions, it is tempting to suggest increased recommendations for biopsy of such lesions. However, it is likely that such a policy would have a low yield. Another approach is to use other imaging techniques, such as positron emission tomography or hyperpolarized carbon 13 pyruvate MR imaging to detect cancers in patients suspected of having cancer in whom MP MR imaging findings are negative.
In conclusion, MP MR imaging has high sensitivity in the detection of clinically important prostate cancer on a per-patient basis; however, on a per-lesion basis, a considerable number of clinically important lesions are missed. The majority of clinically important lesions missed at MP MR imaging are invisible or show only subtle findings that hinder detection. In addition, a subset of clinically important tumors is underestimated in terms of tumor size.
Advances in Knowledge
■ At multiparametric (MP) MR imaging, readers missed approximately 16% (26 of 162) of lesions and underestimated the size of approximately 5% (eight of 162) of clinically important prostate cancers (>5 mm, Gleason score >3+3).
■ Approximately 58% (15 of 26) of the missed cancers were either Prostate Imaging and Reporting Data Systems (PI-RADS) category 1 or 2 lesions; the remaining 42% (11 of 26) were visible only in retrospect and were characterized as PI-RADS category 3 or 4 lesions.
■ MP MR imaging resulted in underestimation of prostate cancer size by at least 30% in eight (8%) of 100 patients with prostate cancer; this has implications for guiding focal therapy of prostate cancer.
Implications for Patient Care
■ MP MR imaging has excellent sensitivity in the detection of prostate cancer on an overall patient basis; however, a substantial number of cancers are missed either because lesions are not apparent or because they are too subtle for prospective detection.
■ Awareness of the limitations of MP MR imaging is essential when encountering a patient with negative MP MR imaging findings but with clinical evidence suggesting cancer (increased prostate-specific antigen level, positive digital rectal examination).
■ A number of lesions were underestimated in size at MP MR imaging, with direct implications for the success of image-guided focal therapy.
Received January 26, 2016; revision requested March 14; revision received June 5, 2017; accepted June 27; final version accepted April 28.
Disclosures of Conflicts of Interest: S.B. disclosed no relevant relationships. A.K.G. disclosed no relevant relationships. S.G. disclosed no relevant relationships. M.B. disclosed no relevant relationships. M.D.G. disclosed no relevant relationships. F.V.M. disclosed no relevant relationships. M.T. disclosed no relevant relationships. V.M. disclosed no relevant relationships. M.J.M. disclosed no relevant relationships. B.J.W. Activities related to the present article: disclosed no relevant relationships. Activities not related to the present article: receives royalties from Philips for licensing prostate a fusion biopsy platform. Other relationships: disclosed no relevant relationships. P.A.P. disclosed no relevant relationships. P.L.C. disclosed no relevant relationships. B.T. disclosed no relevant relationships.
Abbreviations:
- ADC
- apparent diffusion coefficient
- DW
- diffusion weighted
- MP
- multiparametric
- PI-RADS
- Prostate Imaging Reporting and Data System
- PSA
- prostate-specific antigen
References
- 1.Damber JE, Aus G. Prostate cancer. Lancet 2008;371(9625):1710–1721. [DOI] [PubMed] [Google Scholar]
- 2.Jemal A, Bray F, Center MM, Ferlay J, Ward E, Forman D. Global cancer statistics. CA Cancer J Clin 2011;61(2):69–90. [DOI] [PubMed] [Google Scholar]
- 3.Fütterer JJ, Heijmink SW, Scheenen TW, et al. Prostate cancer localization with dynamic contrast-enhanced MR imaging and proton MR spectroscopic imaging. Radiology 2006;241(2):449–458. [DOI] [PubMed] [Google Scholar]
- 4.Haider MA, van der Kwast TH, Tanguay J, et al. Combined T2-weighted and diffusion-weighted MRI for localization of prostate cancer. AJR Am J Roentgenol 2007;189(2):323–328. [DOI] [PubMed] [Google Scholar]
- 5.Kitajima K, Kaji Y, Fukabori Y, Yoshida K, Suganuma N, Sugimura K. Prostate cancer detection with 3 T MRI: comparison of diffusion-weighted imaging and dynamic contrast-enhanced MRI in combination with T2-weighted imaging. J Magn Reson Imaging 2010;31(3):625–631. [DOI] [PubMed] [Google Scholar]
- 6.Turkbey B, Mani H, Shah V, et al. Multiparametric 3T prostate magnetic resonance imaging to detect cancer: histopathological correlation using prostatectomy specimens processed in customized magnetic resonance imaging based molds. J Urol 2011;186(5):1818–1824. [DOI] [PMC free article] [PubMed] [Google Scholar]
- 7.Villeirs GM, Oosterlinck W, Vanherreweghe E, De Meerleer GO. A qualitative approach to combined magnetic resonance imaging and spectroscopy in the diagnosis of prostate cancer. Eur J Radiol 2010;73(2):352–356. [DOI] [PubMed] [Google Scholar]
- 8.Barrett T, Turkbey B, Choyke PL. PI-RADS version 2: what you need to know. Clin Radiol 2015;70(11):1165–1176. [DOI] [PMC free article] [PubMed] [Google Scholar]
- 9.Kumar R, Jagannathan NR. Prebiopsy magnetic resonance studies for prostate cancer diagnosis. Int J Urol 2013;20(2):140–141. [DOI] [PubMed] [Google Scholar]
- 10.Barentsz JO, Richenberg J, Clements R, et al. ESUR prostate MR guidelines 2012. Eur Radiol 2012;22(4):746–757. [DOI] [PMC free article] [PubMed] [Google Scholar]
- 11.Abd-Alazeez M, Ahmed HU, Arya M, et al. The accuracy of multiparametric MRI in men with negative biopsy and elevated PSA level: can it rule out clinically significant prostate cancer? Urol Oncol 2014;32(1):45e17–45.e22. [DOI] [PMC free article] [PubMed] [Google Scholar]
- 12.Selnæs KM, Heerschap A, Jensen LR, et al. Peripheral zone prostate cancer localization by multiparametric magnetic resonance at 3 T: unbiased cancer identification by matching to histopathology. Invest Radiol 2012;47(11):624–633. [DOI] [PubMed] [Google Scholar]
- 13.de Rooij M, Hamoen EH, Fütterer JJ, Barentsz JO, Rovers MM. Accuracy of multiparametric MRI for prostate cancer detection: a meta-analysis. AJR Am J Roentgenol 2014;202(2):343–351. [DOI] [PubMed] [Google Scholar]
- 14.Le JD, Tan N, Shkolyar E, et al. Multifocality and prostate cancer detection by multiparametric magnetic resonance imaging: correlation with whole-mount histopathology. Eur Urol 2015;67(3):569–576. [DOI] [PubMed] [Google Scholar]
- 15.Rosenkrantz AB, Deng FM, Kim S, et al. Prostate cancer: multiparametric MRI for index lesion localization—a multiple-reader study. AJR Am J Roentgenol 2012;199(4):830–837. [DOI] [PubMed] [Google Scholar]
- 16.De Visschere PJ, Naesens L, Libbrecht L, et al. What kind of prostate cancers do we miss on multiparametric magnetic resonance imaging? Eur Radiol 2016;26(4):1098–1107. [DOI] [PubMed] [Google Scholar]
- 17.Beyersdorff D, Taupitz M, Winkelmann B, et al. Patients with a history of elevated prostate-specific antigen levels and negative transrectal US-guided quadrant or sextant biopsy results: value of MR imaging. Radiology 2002;224(3):701–706. [DOI] [PubMed] [Google Scholar]
- 18.Rifkin M. Comparison of magnetic resonance imaging and ultrasonography in staging early prostate cancer. results of a multi-institutional cooperative trial. Invest Radiol 1991;26(11):1024–1025. [PubMed] [Google Scholar]
- 19.Wong AT, Safdieh JJ, Rineer J, Weiner J, Schwartz D, Schreiber D. A population-based analysis of contemporary patterns of care in younger men (<60 years old) with localized prostate cancer. Int Urol Nephrol 2015;47(10):1629–1634. [DOI] [PubMed] [Google Scholar]
- 20.Dall’Era MA. Patient and disease factors affecting the choice and adherence to active surveillance. Curr Opin Urol 2015;25(3):272–276. [DOI] [PubMed] [Google Scholar]
- 21.Rassweiler J, Rassweiler MC, Kenngott H, et al. The past, present and future of minimally invasive therapy in urology: a review and speculative outlook. Minim Invasive Ther Allied Technol 2013;22(4):200–209. [DOI] [PubMed] [Google Scholar]
- 22.Lamb BW, Tan WS, Rehman A, et al. Is prebiopsy MRI good enough to avoid prostate biopsy? a cohort study over a 1-year period. Clin Genitourin Cancer 2015;13(6):512–517. [DOI] [PubMed] [Google Scholar]
- 23.Russo F, Regge D, Armando E, et al. Detection of prostate cancer index lesions with multiparametric magnetic resonance imaging (mp-MRI) using whole-mount histological sections as the reference standard. BJU Int 2016;118(1):84–94. [DOI] [PubMed] [Google Scholar]
- 24.Berbaum KS, Franken EA, Jr. Satisfaction of search in radiographic modalities. Radiology 2011;261(3):1000–1001; author reply 1001–1002. [DOI] [PubMed] [Google Scholar]
- 25.Ko YH, Song PH, Moon KH, Jung HC, Cheon J, Sung DJ. The optimal timing of post-prostate biopsy magnetic resonance imaging to guide nerve-sparing surgery. Asian J Androl 2014;16(2):280–284. [DOI] [PMC free article] [PubMed] [Google Scholar]
- 26.Vargas HA, Hötker AM, Goldman DA, et al. Updated prostate imaging reporting and data system (PIRADS v2) recommendations for the detection of clinically significant prostate cancer using multiparametric MRI: critical evaluation using whole-mount pathology as standard of reference. Eur Radiol 2016;26(6):1606–1612. [DOI] [PMC free article] [PubMed] [Google Scholar]
- 27.Bratan F, Melodelima C, Souchon R, et al. How accurate is multiparametric MR imaging in evaluation of prostate cancer volume? Radiology 2015;275(1):144–154. [DOI] [PubMed] [Google Scholar]
- 28.Fascelli M, George AK, Frye T, Turkbey B, Choyke PL, Pinto PA. The role of MRI in active surveillance for prostate cancer. Curr Urol Rep 2015;16(6):42. [DOI] [PMC free article] [PubMed] [Google Scholar]
- 29.Walton Diaz A, Shakir NA, George AK, et al. Use of serial multiparametric magnetic resonance imaging in the management of patients with prostate cancer on active surveillance. Urol Oncol 2015;33(5):202e1–202.e7. [DOI] [PMC free article] [PubMed] [Google Scholar]
- 30.Okoro C, George AK, Siddiqui MM, et al. Magnetic resonance imaging/transrectal ultrasonography fusion prostate biopsy significantly outperforms systematic 12-core biopsy for prediction of total magnetic resonance imaging tumor volume in active surveillance patients. J Endourol 2015;29(10):1115–1121. [DOI] [PMC free article] [PubMed] [Google Scholar]
- 31.Nakashima J, Tanimoto A, Imai Y, et al. Endorectal MRI for prediction of tumor site, tumor size, and local extension of prostate cancer. Urology 2004;64(1):101–105. [DOI] [PubMed] [Google Scholar]


