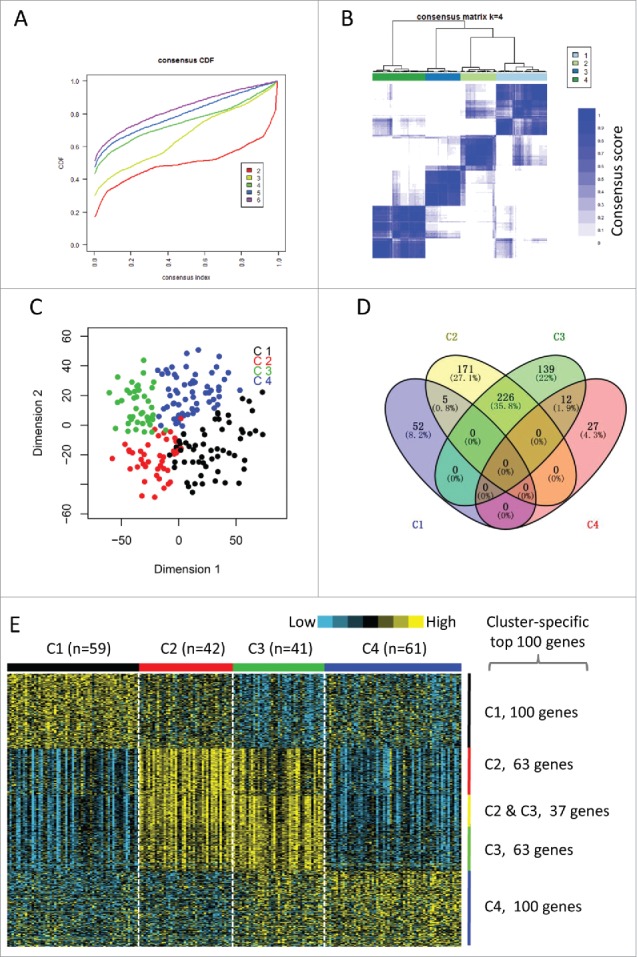
Figure 1.

Identification of immune-related subtypes of HNSCCs in TCGA cohort. (A) The cumulative distribution function (CDF) curves in consensus cluster analysis. CDF curves of consensus scores by different subtype number (k = 2, 3, 4, 5, 6) were represented. (B) The consensus score matrix of all samples when k = 4. A higher consensus score between two samples indicates they are more likely to be grouped into the same cluster in different iterations. (C) Two-dimensional scaling plot by expression profile of global immune genes. Each point represents a single sample, with different colors indicating the four subtypes. (D) Venn diagram of the overlapping of genes across four subtypes. The upregulated genes for each subtype were calculated by unpaired t-test, with FDR < 0.01 and fold change > 2 as the cutoff. (E) Gene expression profile of the top 100 featured genes which were specifically upregulated in each subtype. Heat map indicates relative gene expression value, with yellow for high expression and cyan for low expression.
