

Abstract
Background. The Influenza Incidence Surveillance Project (IISP) monitored outpatient acute respiratory infection (ARI; defined as the presence of ≥2 respiratory symptoms not meeting ILI criteria) and influenza-like illness (ILI) to determine the incidence and contribution of associated viral etiologies.
Methods. From August 2010 through July 2011, 57 outpatient healthcare providers in 12 US sites reported weekly the number of visits for ILI and ARI and collected respiratory specimens on a subset for viral testing. The incidence was estimated using the number of patients in the practice as the denominator, and the virus-specific incidence of clinic visits was extrapolated from the proportion of patients testing positive.
Results. The age-adjusted cumulative incidence of outpatient visits for ARI and ILI combined was 95/1000 persons, with a viral etiology identified in 58% of specimens. Most frequently detected were rhinoviruses/enteroviruses (RV/EV) (21%) and influenza viruses (21%); the resulting extrapolated incidence of outpatient visits was 20 and 19/1000 persons respectively. The incidence of influenza virus-associated clinic visits was highest among patients aged 2–17 years, whereas other viruses had varied patterns among age groups.
Conclusions. The IISP provides a unique opportunity to estimate the outpatient respiratory illness burden by etiology. Influenza virus infection and RV/EV infection(s) represent a substantial burden of respiratory disease in the US outpatient setting, particularly among children.
Keywords: influenza, respiratory virus, influenza-like illness, acute respiratory illness, seasonality, epidemiology
Viral respiratory infections occur throughout the year with epidemic peaks predominating during the winter months in temperate regions [1]. Influenza virus and respiratory syncytial virus (RSV) drive the winter peak, but other common respiratory viruses, including human metapneumovirus (MPV) and the parainfluenza viruses (PIVs), also circulate in fall and winter [2, 3]. In the United States, there is a corresponding winter increase in the volume of outpatient and emergency department visits [4, 5]. However, respiratory viruses such as adenovirus (ADV), rhinovirus (RV), and enterovirus (EV) cause illness year-round and are not routinely included in surveillance programs [6].
Syndromic influenza-like illness (ILI) surveillance is conducted in the United States through the Centers for Disease Control and Prevention (CDC) US Outpatient ILI Surveillance Network [7], which captures the proportion of outpatient visits for fever with cough or sore throat. In a separate national system for virologic surveillance, approximately 85 US–World Health Organization Collaborating Laboratories report influenza detection data [8]. Data on influenza virus and other respiratory virus detection are also reported through the CDC National Respiratory and Enteric Virus Surveillance System [9]. These systems capture the proportion of influenza virus–positive specimens among all respiratory specimens submitted but are not linked to clinical cases. As a result, the specificity of the syndromic ILI surveillance definition for influenza and the disease burden of other etiologies is undetermined.
In 2009, the CDC initiated the Influenza Incidence Surveillance Project (IISP) to assess the relationship of outpatient ILI to influenza [10]. Following successful implementation, the surveillance program was expanded in 2010 to incorporate a broader definition of respiratory illness and testing for other respiratory viruses. This system links the syndromic and virologic components of surveillance, allowing for the determination of age-specific respiratory illness incidence and virologic etiologies.
METHODS
Surveillance Design
IISP used healthcare provider (HCP) patient populations to estimate incidence [10]. From August 2010 through July 2011, surveillance was conducted in 57 HCP practices in 12 sites, including 9 states and 3 jurisdictions: Florida, Iowa, Minnesota, New Jersey, North Dakota, Oregon, Utah, Virginia, Wisconsin, Los Angeles County, New York City, and Philadelphia. Each site recruited HCPs that, in combination, represented patients of all ages.
Among patients age ≥2 years, ILI was defined as fever with cough or sore throat, and among patients age <2 years ILI was defined as fever with ≥1 of the following other respiratory symptom: cough, sore throat, nasal congestion, or rhinorrhea. We defined ARI as ≥2 respiratory symptoms, including fever, cough, sore throat, nasal congestion, or rhinorrhea but not meeting the ILI case definition; patients with ARI were analyzed as a mutually exclusive group. Eligible patients with symptom onset within 7 days of the clinic visit were included. HCPs reported weekly the number of patients meeting the ARI and ILI case definitions and the total patient visits in the following age groups: <12 months, 12–23 months, 2–4 years, 5–17 years, 18–24 years, 25–49 years, 50–64 years, and ≥65 years.
At all sites, a nasal, nasopharyngeal, or oropharyngeal swab was collected from the first 10 patients with ILI seen each week for PCR testing at the public health laboratory. In 5 sites (Iowa, Florida, Minnesota, New York City, and Wisconsin), a specimen was collected from both the first 10 patients with ILI and the first 10 patients with ARI, or HCPs collected a specimen from all patients and case definition assignment occurred retrospectively. Demographic and clinical data were collected from all patients.
Molecular Diagnostic Testing
Real-time reverse-transcription polymerase chain reaction (RT-PCR) testing was performed on all specimens according to the algorithm for each site, described in the Supplementary Table. In 11 of 12 participating laboratories, specimens were first tested for influenza viruses, using the CDC Human Influenza Virus RT-PCR Diagnostic Panel, which detects influenza A viruses (ie, seasonal A[H1N1], 2009 pandemic A[H1N1], and seasonal A[H3N2]), and influenza B viruses. The testing platform for respiratory viruses other than influenza virus was determined by the participating laboratories but was required to be PCR based. Five sites used virus-specific RT-PCR assays developed and shared by the CDC [11]. In the remaining sites, one of the following 2 commercial multiplex RT-PCR platforms was used in accordance with the manufacturer's instructions: Luminex xTAG Respiratory Virus Panel (RVP; Luminex Diagnostics, Toronto, Canada) and ResPlex II v2.0 (Qiagen, Venlo, the Netherlands). One site tested specimens first by the Luminex xTAG RVP and then subtyped influenza A virus–positive specimens by using the CDC panel. Only test results from Food and Drug Administration–approved assays were reported to the submitting physician.
Before initiating testing, sites completed proficiency testing using an international quality assessment panel for respiratory viruses by Quality Control for Molecular Diagnostics (available at: http://www.qcmd.org/). Sites performing the CDC virus-specific RT-PCR assays were able to detect all viruses among the panel specimens. The sites performing commercial multiplex assays had a minor loss of sensitivity, as indicated by failure to detect panel specimens with the lowest viral loads. The commercial multiplex assays do not differentiate RV and EV, and the CDC RT-PCR assays for RV and EV may cross-react; therefore, these viruses were combined in our analysis and are referred to as “RV/EV.”
Data Analysis
Weekly incidence estimates for ARI and ILI clinic visits per 1000 persons were calculated using the provider patient populations (defined as the number of patients registered to the HCP or the average total number of unique patients seen per year [10]) as the denominator. From the subset of patients for which a specimen was tested, we extrapolated the total number of virus-positive patients for each week by multiplying the reported number of patients with ARI or ILI seen that week by the corresponding proportion of patients with ARI or ILI testing PCR positive for each virus. We calculated the weekly incidence of clinic visits for and then summed the weekly incidence estimates to obtain the cumulative incidence. Ninety-five percent confidence intervals (CIs) were calculated using bootstrap analysis to account for the variances of the weekly ILI case totals and proportion of test-positive patients.
Statistical analysis was restricted to patients who met the ARI or ILI case definition and had RT-PCR testing completed for at least influenza virus. We excluded 82 patients with ARI from the 7 sites not systematically collecting specimens from patients with ARI and 50 patients with insufficient symptom information to define ILI or ARI. Differences in demographic factors and virus detection between patients with ARI and those with ILI were evaluated using the χ2 test. All analyses were conducted using SAS, version 9.2 (SAS Institute, Cary, NC). The IISP uses routinely collected specimens and public health surveillance data.
RESULTS
Population Composition
Participating HCPs practices included 29 family medicine facilities, 9 community health facilities, 8 pediatric facilities, 7 student health facilities, 2 emergency or urgent care facilities, 1 internal medicine facility, and 1 juvenile detention facility. A total population of 385 033 persons was reported for all 12 sites and for 330 309 persons in 11 sites also reporting ARI case counts. The age distribution was similar to that of the US population, including 27% aged <18 years among IISP providers, compared with 24% in the United States [12]. The median weekly number of patients seen by the practices was 141 (interquartile range, 90–239 patients).
ARI and ILI Seasonality
From August 2010 through July 2011, ARI and ILI were observed in 5.7% of 423 139 outpatient visits, and for 14 weeks (from December 19 through March 26) the weekly percentage of visits for ARI and ILI exceeded 3 SDs of a baseline rate of 2.8% (Supplementary Figure 1). During the 14-week period, the median percentage of visits was 3.4% (range, 1.7%–4.6%) for ILI and 5.1% (range, 4.2%–5.9%) for ARI. For ILI visits, a distinct 8-week seasonal peak was observed (from 16 January through 6 March), with a weekly range of 3.4%–4.6%. The seasonal peak was less prominent among patients with ILI aged <1 and ≥50 years and was difficult to discern among patients with ARI, with the exception of children aged 2–17 years (Figure 1).
Figure 1.
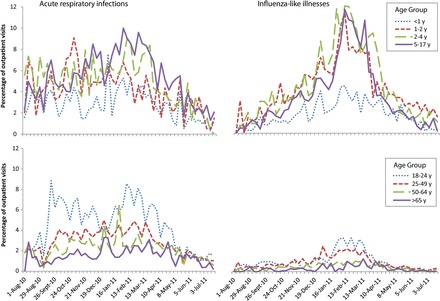
Age-specific proportions of outpatient visits for acute respiratory infections (ARIs) and influenza-like illnesses (ILIs) in the Influenza Incidence Surveillance Project, August 2010 through July 2011. Influenza-like illness (ILI) was defined among patients aged <2 years as fever and >1 of the following symptoms: cough, sore throat, rhinorrhea, and nasal congestion. We defined ILI among patients aged ≥2 years as fever with cough or sore throat. Patients with presenting with ≥2 of the following symptoms who did not also meet the ILI case definitions were defined as having ARI: fever, cough, sore throat, rhinorrhea, and nasal congestion. The graphs present ARI and ILI cases as mutually exclusive groups.
Respiratory Virus RT-PCR Testing
Specimens were collected from 6571 patients for RT-PCR testing, including 4567 patients with ILI from all 12 sites and 1845 patients with ARI from the 5 sites that tested both patients with ARI and those with ILI by RT-PCR (hereafter, the “ARI sites”). The average age of patients with ILI was 16 years, compared with 20 years among patients with ARI (P < .01). Other demographic factors did not vary by case definition (Table 1); however, 13.1% of patients with ILI were prescribed antivirals, compared with 2.1% of patients with ARI (P < .01).
Table 1.
Demographic Characteristics of Patients With Respiratory Illness and the Frequency of Specific Viruses Detected From August 2010 Through July 2011 in the Influenza Incidence Surveillance Project
| Surveillance in 5 IISP Sitesa |
Surveillance in All 12 IISP Sites |
|||||
|---|---|---|---|---|---|---|
| Characteristic | All Cases (n = 4212) | ARI Casesb (n = 1845) | ILI Cases (n = 2367) | P for ARI vs ILI in 5 Sites | ILI Cases (n = 4567) | P for ARI in 5 Sites vs ILI in 12 Sites |
| Age | <.01 | <.01 | ||||
| <12 mo | 211 (5.0) | 109 (5.9) | 102 (4.3) | 226 (5) | ||
| 12–23 mo | 241 (5.7) | 78 (4.2) | 163 (6.9) | 327 (7.2) | ||
| 2–4 y | 561 (13.3) | 193 (10.5) | 368 (15.6) | 725 (15.9) | ||
| 5–17 y | 1234 (29.3) | 527 (28.6) | 707 (29.9) | 1502 (32.9) | ||
| 18–24 y | 835 (19.8) | 400 (21.7) | 435 (18.4) | 806 (17.7) | ||
| 25–49 y | 846 (20.1) | 376 (20.4) | 470 (19.9) | 759 (16.6) | ||
| 50–64 y | 212 (5.0) | 117 (6.4) | 95 (4) | 177 (3.9) | ||
| ≥65 y | 69 (1.6) | 43 (2.3) | 26 (1.1) | 44 (1) | ||
| Male sex | 1899 (45.8) | 812 (44.7) | 1087 (46.7) | NS | 2106 (46.7) | NS |
| Race/ethnicity | NS | NS | ||||
| White | 1647 (64.1) | 771 (66) | 876 (62.4) | 2014 (67.3) | ||
| Black | 393 (15.3) | 171 (14.6) | 222 (15.8) | 417 (13.9) | ||
| Hispanic | 406 (15.8) | 174 (14.9) | 232 (16.5) | 384 (12.8) | ||
| Asian | 111 (4.3) | 46 (3.9) | 65 (4.6) | 122 (4.1) | ||
| Other | 14 (0.5) | 6 (0.5) | 8 (0.6) | 58 (1.9) | ||
| Received antiviral treatment | 184 (6.2) | 27 (2.1) | 157 (9.3) | <.01 | 498 (13.1) | <.01 |
| Received influenza vaccine | 592 (24.2) | 278 (26.0) | 314 (22.8) | .06 | 872 (27.8) | NS |
| Frequency of virus detection | ||||||
| At least 1 virus detected | 2443 (58.0) | 947 (51.3) | 1496 (63.2) | <.01 | 2844 (62.3) | <.01 |
| Any influenza virus | 888 (21.1) | 221 (12.0) | 667 (28.2) | <.01 | 1248 (27.3) | <.01 |
| Influenza A virus | 565 (13.4) | 126 (6.8) | 439 (18.6) | <.01 | 820 (18.0) | <.01 |
| Influenza B virus | 328 (7.8) | 97 (5.3) | 231 (9.8) | <.01 | 432 (9.5) | <.01 |
| RSV | 23 (6.2) | 81 (4.6) | 153 (7.5) | <.01 | 317 (7.7) | <.01 |
| RV/EV | 801 (21.1) | 452 (25.9) | 349 (17.0) | <.01 | 747 (18.2) | <.01 |
| Adenovirus | 218 (5.7) | 66 (3.8) | 152 (7.4) | <.01 | 228 (5.5) | <.01 |
| MPV | 169 (4.4) | 57 (3.3) | 112 (5.5) | <.01 | 188 (4.6) | <.01 |
| PIV 1 | 21 (0.2) | 7 (0.4) | 14 (0.7) | NS | 24 (0.6) | NS |
| PIV 2 | 65 (1.7) | 26 (1.5) | 39 (1.9) | NS | 78 (1.9) | NS |
| PIV 3 | 120 (3.2) | 49 (2.8) | 71 (3.5) | NS | 137 (3.3) | NS |
| PIV 4 | 4 (0.3) | 3 (0.4) | 1 (0.1) | NS | 8 (0.5) | NS |
| Coronaviruses | 112 (7.3) | 61 (7.9) | 69 (6.7) | NS | 69 (6.7) | NS |
Data are no. (%) of cases. Denominators used in percentage calculations may differ slightly because of missing demographic data or viral testing practices.
Abbreviations: EV, enterovirus; NS, not significant; MPV, human metapneumovirus; PIV, parainfluenza virus; RSV, respiratory syncytial virus; RV, rhinovirus.
a Florida, Iowa, Minnesota, New York City, and Wisconsin.
To evaluate the overall distribution of respiratory virus detections, we included only patients in the 5 ARI sites. At least one virus was detected in 58% of all patient specimens. Influenza virus and RV/EV were the most frequently detected viruses, and the overall detection rate of each individually was 21%. Of the 888 influenza viruses, 565 (64%) were type A (58% were subtype H3N2, 40% were subtype 2009 H1N1, and 1.8% were not subtyped), 329 (37%) were type B, and 5 (0.5%) were codetected types A and B (A[H3N2] and B). Coronaviruses (7.3%), RSV (6.1%), and ADV (5.7%) composed the largest number of other respiratory viruses detected. Of 112 coronavirus-positive patients, 113 specific types were detected (1 patient had both OC43 and NL63): OC43 was found in 71, NL63 in 29, HKU1 in 9, and 229E in 4.
To compare virus detection patterns among patients with ILI and those with ARI independently, we included patients with ILI from all 12 sites and patients with ARI from the 5 ARI sites (Table 1). Viral detection was significantly higher among patients with ILI than among patients with ARI overall (62% vs 51%; P < .01). Influenza virus, RSV, ADV, and MPV were more frequently detected among patients with ILI (P < .01), and no differential detection by case definition was observed for PIVs or coronaviruses. Statistical differences in the frequency of virus detections among patients with ARI, compared with patients with ILI, did not differ when the analysis was limited only to the 5 ARI sites.
Codetections were evaluated in 6 sites that tested specimens for all respiratory viruses (Supplementary Table), with 205 of 3870 patients (5.3%) testing positive for multiple respiratory viruses. ADV and RV/EV were present in 76% of all codetections; excluding these, influenza virus with RSV or with MPV were codetected most frequently (in 11 and 9, respectively). The majority of codetections (87%) occurred among children aged <18 years, including 28% among children aged <2 years and 59% among children aged 2–17 years.
Respiratory Virus Seasonality
We evaluated the weekly percentage of specimens positive for each virus, shown in Figure 2 for patients with ILI and in Supplementary Figure 2 for patients with ARI. The national influenza season duration was 21 weeks, and the peak percentage of influenza virus positivity among patients with ILI was 54%. The duration of the national influenza season encompasses the start of the earliest local site activity and the end of the latest local site activity; thus, the overall duration is longer than it is at a specific site. The national peak percentage positivity is similarly a composite of the percentage positivity in local sites at different phases of their outbreaks and thus will not be as high as the site-specific peak. Influenza activity at individual IISP sites was characterized by a higher peak percentage positivity, which ranged from 55% to 83% (median, 72%), and by a shorter season duration, which ranged from 9 to 21 weeks (median, 17 weeks). During summer months, RV/EVs were most frequently detected, although the overall volume of ILI in summer did not reach the levels during winter months (average, 29 patients per week during May through August, compared with 131 patients per week from October through April). The national peak percentage of RV/EV positivity was 43% during the week ending 3 October 2010 and ranged from 50% to 86% (median, 63%) at individual sites. In 2010, the RSV infection season was concurrent with the influenza season, occurring from the week ending 20 November 2010 through 9 April 2011 [13]. Broad circulation was detected during November and December 2010 for PIV-2 and during March and April 2011 for PIV-3, concurrent with MPV. ADVs did not demonstrate a seasonal pattern.
Figure 2.
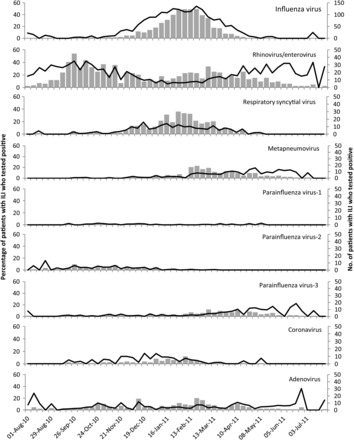
Seasonal distribution of respiratory viruses detected by reverse-transcription polymerase chain reaction among patients with influenza-like illnesses (ILIs), Influenza Incidence Surveillance Project, August 2010 through July 2011. The bars indicate the number of virus detections, and the lines indicate the percentage of patients with ILI who tested positive.
Incidence of Outpatient ARI and ILI
The cumulative age-adjusted incidence of ARI and ILI outpatient visits combined was 95/1000 persons and ranged from 61/1000 persons among adults to 118/1000 persons among children aged <18 years. The highest incidence of all outpatient respiratory visits occurred in children aged 1–4 years (range, 128–130/1000 persons), and the lowest incidence occurred in adults aged ≥65 years (Table 2 and Figure 3). Among patients with ARI and those with ILI independently, the cumulative age-adjusted incidence of outpatient visits was 59/1000 persons and 37/1000 persons, respectively, with substantial differences by age. Outpatient visits for ILI occurred 4.0 times more frequently among children than among adults (50/1000 persons vs 13/1000 persons), whereas visits among children for ARI occurred only 1.4 times more frequently than among adults (47/1000 persons vs 66/1000 persons).
Table 2.
Annual Incidence of Outpatient Visits per 1000 Persons for Acute Respiratory Illness (ARI) and Influenza-Like Illness (ILI) and the Extrapolated Incidence of Specific Viruses Detected, Influenza Incidence Surveillance Project August 2010 through July 2011
| Variable | Outpatient Visits for Respiratory Illness | Respiratory Virus-Associated Outpatient Visitsa |
||||||||
|---|---|---|---|---|---|---|---|---|---|---|
| Influenza Virus | RSV | RV/EV | PIV-1 | PIV-2 | PIV-3 | MPV | Adenovirus | Coronavirus | ||
| ARI and ILIb | ||||||||||
| Overallc | 95.1 (89.4–100.9) | 18.7 (14.1–23.8) | 6.1 (3.1–9.8) | 19.8 (14.3–26.0) | 0.5 (0–1.8) | 1.7 (.3–3.9) | 3.0 (.9–6.1) | 4.1 (1.6–7.5) | 6.4 (3.1–10.1) | 6.5 (2.2–11.9) |
| By age | ||||||||||
| 0–11 mo | 84.7 (74.2–93.4) | 7.2 (1.5–14.0) | 13.5 (5.4–23.1) | 30.4 (19.5–40.3) | 0.8 (0–3.8) | 1.6 (0–5.5) | 3.4 (.3–7.7) | 3.6 (.1–8.5) | 9.0 (3.8–15.3) | 9.3 (5.4–14.8) |
| 12–23 mo | 129.5 (116.3–142.2) | 11.3 (3.9–22.5) | 22.5 (10.8–34.9) | 33.6 (21.1–48.2) | 0.5 (0–3.3) | 0.9 (0–5.4) | 8.7 (2.5–18.1) | 8.4 (3.2–18.3) | 17.5 (8.6–28.4) | 5.7 (.3–13.1) |
| 2–4 y | 127.8 (119.6–136.4) | 23.7 (16.7–31.2) | 17.4 (10.7–24.4) | 29.8 (21.6–38.8) | 1.5 (0–4.5) | 2.0 (0–4.9) | 7.6 (3–13.4) | 8.9 (3.8–14.9) | 15.5 (8.3–22.4) | 8.2 (1.7–17.0) |
| 5–17 y | 119.5 (114.3–125.2) | 30.3 (25.4–36) | 4.4 (2.3–7.3) | 23.3 (18.2–29.1) | 0.6 (0–1.8) | 2.7 (.8–5.4) | 2.4 (.8–4.8) | 4.5 (2.1–7.4) | 6.4 (3.2–9.8) | 8.8 (3.3–15.2) |
| 18–24 y | 87.7 (83.7–92.1) | 16.4 (12.6–20.1) | 1.3 (.2–2.7) | 15.9 (11.6–21.2) | 0.3 (0–1.2) | 1.5 (.5–3.2) | 1.6 (.2–3.7) | 2.1 (.3–4.6) | 4.2 (1.9–7.3) | 5.6 (1.9–9.8) |
| 25–49 y | 56.3 (53.3–59.4) | 10.1 (7.7–12.7) | 1.2 (.3–2.4) | 9.7 (7.0–13.4) | 0.1 (0–.5) | 0.7 (0–1.9) | 1.0 (.2–2.7) | 2.0 (.9–3.6) | 0.8 (.1–1.9) | 3.9 (1.8–7.0) |
| 50–64 y | 44.5 (39.2–49.5) | 5.9 (2.0–9.4) | 1.1 (0–3.3) | 6.6 (3.9–9.6) | 0 | 0.2 (0–1.0) | 1.0 (0–2.6) | 2.1 (.2–4.4) | 0 | 2.6 (.1–5.9) |
| ≥65 y | 27.3 (22.0–31.9) | 2.6 (.7–4.9) | 0.6 (0–2.1) | 3.9 (1.8–6.4) | 0 | 0.8 (.1–2.3) | 0.8 (0–2.6) | 0.4 (0–1.8) | 0 | 1.6 (.1–3.6) |
| ARI only | ||||||||||
| Overallc | 58.8 (54.2–63.3) | 6.2 (3.3–9.6) | 1.9 (.4–4.2) | 13.9 (9.1–19.2) | 0.2 (0–.8) | 0.7 (0–2.3) | 1.6 (.2–3.9) | 1.8 (.3–4.3) | 1.9 (.3–4.1) | 3.4 (.8–6.9) |
| By age | ||||||||||
| 0–11 mo | 50.8 (42.5–56.8) | 2.3 (.4–5.9) | 4.4 (.9–9.3) | 19.1 (13–25.7) | 0.2 (0–1.5) | 0.4 (0–2.7) | 2.5 (.5–5.5) | 1.6 (.5–3.4) | 2.2 (.1–5.7) | 3.3 (.9–6.4) |
| 12–23 mo | 61.6 (52.5–70.6) | 1.8 (0–4.9) | 3.0 (.2–7.0) | 24.0 (16.6–32.4) | 0.5 (0–3) | 0.7 (0–4.0) | 1.8 (0–5.2) | 2.0 (0–5.7) | 6.0 (1.6–11.6) | 1.4 (.3–3.2) |
| 2–4 y | 63.4 (56.4–69.9) | 7.9 (4.4–12.2) | 5.3 (1.9–9.8) | 15.7 (9.9–22.5) | 0.7 (0–2.8) | 0.4 (0–2.0) | 2.5 (.5–5.3) | 5.0 (2.1–10.7) | 5.3 (1.6–10.9) | 3.0 (.9–5.9) |
| 5–17 y | 70.3 (65.9–74.7) | 8.1 (4.9–11.5) | 2.2 (.5–4.6) | 16.8 (11.9–22.5) | 0.1 (0–.6) | 0.9 (0–2.4) | 1.7 (.2–3.6) | 1.7 (.1–3.8) | 1.9 (.3–3.9) | 3.4 (.7–7.4) |
| 18–24 y | 69.3 (65.2–73.6) | 8.3 (4.5–12.9) | 0.9 (0–2.7) | 16.7 (10.1–22.8) | 0.1 (0–.6) | 1.1 (0–3.0) | 2.0 (.1–5.2) | 1.6 (0–4.1) | 1.5 (.1–3.6) | 5.0 (1.0–10.1) |
| 25–49 y | 41.9 (39.3–44.7) | 4.1 (2.1–6.4) | 0.6 (0–1.6) | 6.3 (3.9–9.4) | 0 | 0.5 (0–1.6) | 0.7 (.1–2.1) | 1.1 (.2–2.5) | 0.3 (0–1.1) | 3.0 (1.1–5.8) |
| 50–64 y | 36.4 (32.6–40.4) | 2.1 (.1–4.4) | 0.5 (0–1.5) | 5.6 (2.6–8.5) | 0 | 0.1 (0–.8) | 1.2 (.6–2) | 1.4 (0–3.6) | 0 | 2.2 (.5–4.4) |
| ≥65 y | 22.3 (18.3–26.5) | 2.2 (.9–4.0) | 0.7 (0–2.1) | 1.7 (.3–3.3) | 0 | 0 | 0.7 (0–2.1) | 0 | 0 | 0.7 (.1–1.8) |
| ILIb only | ||||||||||
| Overallc | 36.9 (33.2–40.4) | 9.6 (7.4–11.8) | 4.1 (2.6–6.2) | 6.4 (4.4–8.7) | 0.3 (0–.8) | 0.7 (.2–1.5) | 1.6 (.7–3.0) | 2.1 (.9–3.5) | 2.5 (1.2–4.0) | 2.0 (.4–4.4) |
| By age | ||||||||||
| 0–11 mo | 37.5 (30.1–43.1) | 4.4 (1.3–8.2) | 6.6 (2.8–11.2) | 11.3 (7.3–16.8) | 0.7 (0–2.3) | 0.3 (0–1.4) | 2.2 (.3–5.3) | 1.8 (.1–4.4) | 4.1 (1.5–7.6) | 2.5 (.4–5.9) |
| 12–23 mo | 68.6 (59.7–77.6) | 5.9 (1.9–10.1) | 15.0 (9.2–22.6) | 14.9 (8.8–21.6) | 0.3 (0–1.9) | 0.1 (0–.8) | 7.0 (3.1–11.9) | 3.5 (.7–7.2) | 5.9 (1.9–11.2) | 3.0 (0–8.2) |
| 2–4 y | 63.9 (57.2–70.3) | 13.0 (8.9–16.9) | 11.8 (8.4–16.6) | 12.3 (8.6–16.1) | 0.6 (0–1.7) | 1.8 (.5–3.8) | 4.7 (2.3–7.5) | 5.9 (3.3–9.0) | 5.6 (3.2–8.5) | 1.8 (0–5.5) |
| 5–17 y | 44.2 (41.1–47.0) | 16.1 (13.9–18.3) | 2.1 (1.2–3.2) | 6.2 (4.6–7.9) | 0.3 (0–.7) | 1.0 (.4–1.7) | 0.7 (.2–1.4) | 1.8 (.8–2.9) | 2.3 (1.2–3.3) | 3.3 (.9–6.0) |
| 18–24 y | 16.3 (14.5–18.2) | 5.4 (4.2–6.6) | 0.4 (.1–1.0) | 2.2 (1.3–3.2) | 0.02 (0–.2) | 0.2 (0–.5) | 0.1 (0–.4) | 0.5 (.1–.9) | 1.0 (.5–1.7) | 0.9 (.2–1.9) |
| 25–49 y | 13.5 (12.2–14.9) | 3.6 (2.7–4.4) | 0.4 (.1–.8) | 2.4 (1.7–3.2) | 0.04 (0–.2) | 0.1 (0–.4) | 0.2 (0–.6) | 0.6 (.2–1.1) | 0.3 (0–.6) | 0.9 (.4–1.5) |
| 50–64 y | 7.3 (5.7–9.3) | 1.6 (.8–2.6) | 0.3 (0–.8) | 1.0 (.3–1.9) | 0.04 (0–.1) | 0.03 (0–.2) | 0.1 (0–.5) | 0.4 (0–1.0) | 0 | 0.5 (.1–1.2) |
| ≥65 y | 4.2 (2.8–6.0) | 0.9 (.2–2.0) | 0 | 0.5 (0–1.3) | 0.04 (0–.1) | 0.2 (0–.8) | 0.1 (0–.5) | 0.2 (0–.6) | 0 | 0.3 (0–.9) |
Data are visits/1000 persons (95% confidence interval).
Abbreviations: EV, enterovirus; MPV, human metapneumovirus; PIV, parainfluenza virus; RSV, respiratory syncytial virus; RV, rhinovirus.
a Virus-specific incidence was extrapolated from the proportion of patients meeting the corresponding case definition who tested positive by reverse-transcription polymerase chain reaction for the specified virus.
b We defined ILI among patients aged <2 years as fever and >1 respiratory symptom. We defined ILI among patients aged ≥2 years as fever with cough or sore throat. We defined ARI as patients with ≥2 of the following symptoms who did not meet the ILI case definitions: fever, cough, sore throat, rhinorrhea, and nasal congestion.
c Data are age-adjusted incidence estimates.
Figure 3.
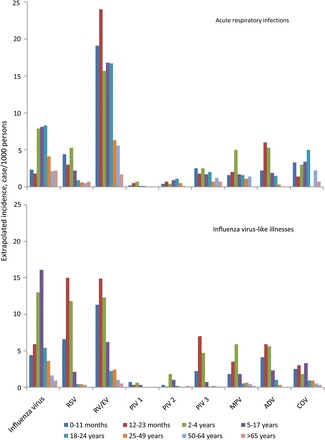
Age-specific cumulative incidence of respiratory virus-associated acute respiratory infections (ARIs) and influenza-like illnesses (ILIs) by age group from August 2010 through July 2011, Influenza Incidence Surveillance Project. Incidence was extrapolated from the population rate of ARI and ILI and the proportion testing positive for each virus. ILI was defined among patients aged <2 years as fever and >1 of the following symptoms: cough, sore throat, rhinorrhea, and nasal congestion. We defined ILI among patients aged ≥2 years as fever with cough or sore throat. Patients with presenting with ≥2 of the following symptoms who did not also meet the ILI case definitions were defined as having ARI: fever, cough, sore throat, rhinorrhea, and nasal congestion. The graphs present ARI and ILI cases as mutually exclusive groups. Abbreviations: ADV, adenovirus; COV, coronavirus; EV, enterovirus; MPV, human metapneumovirus; PIV, parainfluenza virus; RSV, respiratory syncytial virus; RV, rhinovirus.
Extrapolated Incidence of Respiratory Virus
The cumulative age-adjusted incidence of outpatient respiratory visits associated with the detection of at least 1 respiratory virus was 55/1000 persons overall, 30/1000 persons for ARI, and 23/1000 persons for ILI. The viruses with the highest incidence of associated outpatient visits were RV/EV and influenza virus (20/1000 persons and 19/1000 persons, respectively; Table 2). Overall, children aged <5 years had the highest incidence of respiratory virus–associated visits; however, we observed wide variation for patients with ARI and those with ILI. Among patients with ARI, RV/EV was associated with the highest age-adjusted incidence of visits (Table 2). Children aged <5 years had an elevated incidence of visits for all viruses except PIV-1 and PIV-2. Among patients with ILI, the cumulative incidence of influenza virus-associated visits was highest (10/1000 persons), with the age-specific incidence of visits highest among young children and adolescents. Children with ILI aged <5 years also demonstrated an elevated incidence of RSV, RV/EV, and coronavirus-associated visits. In older age groups, the highest cumulative incidence of visits was observed for influenza virus and RV/EV.
DISCUSSION
We describe the first nationally representative surveillance system for multiple respiratory viruses in the United States, which detected at least 1 virus in 58% of all patients tested and in 62% of patients with ILI. The predominating virus differed according to age and case definition, with influenza virus accounting for the majority of detections among patients with ILI and RV/EV accounting for the majority among patients with ARI. Using the HCP patient populations for population-based surveillance, we determined that ARI and ILI outpatient visits occur at an incidence rate of 95/1000 persons per year, with substantial variation by age. Incidence data demonstrated that although much of the burden of respiratory viruses is focused on very young children, influenza has a substantial burden in school-aged children, as well.
At least 1 respiratory virus was detected in 58% of all IISP patients tested. The virus detection rates found by other comparable surveillance programs ranged from 48% to 69% [14–16], consistent with our findings. However, detection was more frequent among patients with ILI than among those with ARI (62% vs 51%; P < .01). The ARI case definition did not require fever and consisted of more nonspecific symptoms, which has been shown to coincide with a lower pathogen recovery rate [17]. By extrapolating the proportion of outpatient visits associated with virus detection, we calculated that 55/1000 persons have a virus-associated ARI that is medically attended. When we further examined the incidence by our case definitions, we found that outpatient visits occurred more frequently for ARI than for ILI (59/1000 persons, compared with 37/1000 persons), but the rate of virus detection among patients with ILI was higher. The result was a higher influenza-associated incidence among patients with ILI and little difference among other viruses. Only the RV/EV incidence remained higher among patients with ARI.
Age was a key factor in the outpatient burden of respiratory illness and virus detection rates. We observed the highest rates of respiratory illness among patients aged 1–17 years (range among age groups, 120–130/1000 persons) but with substantial variability by virus (Table 2 and Figure 3). Influenza virus–associated incidence estimates were highest among older children and young adults of day care and school age, likely because of higher susceptibility throughout adolescence in conjunction with a high potential for social mixing [2, 10, 18]. The observed RSV infection incidence was highest among children age <5 years, but RSV was detected throughout the age groups. Our findings are consistent with studies that have established RSV as significantly impacting the youngest ages and supports recent data demonstrating the risk for RSV infection among elderly persons [19, 20]. The incidence of PIV-3, ADV, and MPV visits was highest among children age 1–4 years, all of which have been established previously as impacting very young children [19, 21, 22]. While the incidence of PIVs was low, IISP data reflected a previously reported trend indicating a younger age range affected by PIV-3 than both PIV-1 and PIV-2 [23]. Finally, the rates of RV/EV detection were high among patients age <1 year (30/1000 persons), which is important for physician consideration since both rhinoviruses and enteroviruses have been associated with severe illness among neonates [6, 24, 25].
While both ILI and ARI occurred year-round, ILI had a more distinct seasonal pattern that corresponded with the increase in virus detections. Influenza virus detections occurred in large numbers during the winter months (Figure 2); in contrast, RV/EV detections were predominant during early fall months and occurred in low levels throughout the year, giving an inverse circulation pattern to that of influenza virus and a similarly high cumulative incidence. While the activity did not demonstrate a clear peak, the incidence of RV/EV coincided with the beginning of the school year; this pattern has been observed previously although inconsistently [26–28]. The observed winter peak activity of RSV has been well described [29]. We also observed peak MPV detections during late winter and early spring, consistent with other recent surveillance reports [30]. PIVs were detected throughout the year but with varying incidence and seasonality by type. According to several longitudinal surveillance programs, PIV-1 demonstrates a biennial seasonal pattern with increased incidence in uneven years [25, 31, 32], which may explain the low incidence of PIV-1 in 2010. The seasonality of PIV-2 and PIV-3 matched expected patterns [32]. The characteristic lack of ADV seasonality [9, 21] was observed in IISP but with a slight decrease in incidence during the summer months that has been described by Olofsson [30].
We used provider patient populations as the denominator for calculating incidence. The difficulty in defining catchment areas and thus the utility of using patient populations for outpatient incidence estimation, as well as the comparability of these estimates, have been demonstrated previously [10, 33]. Furthermore, the United Kingdom has long reported the weekly incidence of ILI similarly based on practitioners' registered patients [34]. Underscoring the unique nature of IISP data, there are currently no US-based alternative sources of data with which to directly compare. A study by Neuzil et al found a comparable incidence of outpatient ARIs that could be attributed to a respiratory virus of 43–67/1000 among adults aged ≥18 years [4]. Our incidence, as expected, was lower than estimates reported in much of the literature, due in part to the use among the most-comparable studies of broadly defined and less specific criteria for respiratory illness or to the lack of a laboratory-confirmed influenza outcome [35, 36]. Another possible reason IISP incidence estimates were lower was that our surveillance largely represented primary care providers, while community-based and health maintenance organization population-based estimates have included healthcare visits at all points of care, including emergency departments or urgent care clinics. Future analyses with healthcare utilization data will be conducted to determine the representative proportion of primary care providers in disease burden estimation.
The IISP was subject to some limitations. The surveillance design targeted traditional outpatient HCPs, which may have led to an underrepresentation of patients aged ≥65 years, because elderly patients are known to be underrepresented in surveillance owing to atypical clinical presentations assay insensitivity in this population [37]. As demonstrated by the proficiency testing, we found differential levels of sensitivity between the commercial multiplex assays and the CDC virus-specific RT-PCR assays, which may have resulted in underestimates among multiplex sites; however, proficiency testing suggested that lower sensitivity would most likely occur among patients with very low viral loads. Furthermore, patients, particularly adults, may not have had detectable virus at the time of the visit, because of a shorter duration of shedding, time from onset to specimen collection, noninfectious illnesses, or nonoptimally collected specimens. Finally, our test panel included only select viral pathogens; thus, specimens with negative results could have been associated with pathogens not included in our panel in all sites, such as the coronaviruses, which composed 7% of specimens in sites that did include them.
The IISP is the first surveillance program in the United States to use molecular virologic techniques to evaluate annual respiratory infection etiology and incidence. Our data demonstrate the substantial burden of ARI and ILI, the contribution of specific viruses, and the usefulness of the ILI case definition for influenza virus surveillance. Linking syndromic and virologic surveillance allows public health agencies to determine the burden and distribution of viruses and circulation patterns among outpatients of different ages and specifically inform HCPs about circulating viruses in their geographic location, which could impact influenza antiviral and general antimicrobial use. Furthermore, year-round, systematic RSV detection data can inform appropriate initiation of palivizumab RSV prophylaxis, which is typically limited to only 5 monthly doses per year because of the high cost [38]. The IISP presents a platform for conducting population-based surveillance coupled with systematic testing for respiratory viruses, which can improve our ability to estimate the burden of disease, direct public health interventions, and inform antiviral therapy administration.
STUDY GROUP MEMBERS
Members of the IISP Working Group are as follows: Jennifer Lemmings, Brett Whitaker, Brian Lang, Ruth Lynfield, Larry Carroll, Dave Boxrud, Lillian Stark, Lea Heberlein-Larson, Valerie Mock, Lucy Desjardin, Mike Trythall, Jie Fu, Annette Atkinson, Lisa Gren, Erik Reisdorf, LaDonna Grenz, Christianne Biggs, Joan Sturgeon, Hector Rivas, Bruce Wolf, James Lute, Katie Kurkjian, and Denise Toney.
Supplementary Material
Notes
Acknowledgments. We thank Heidi Davidson, Carrie Reed, Scott Epperson, Lynnette Brammer, and Laura Coleman, for their valuable data assistance; Steve Lindstrom, for his contribution to the laboratory diagnostics planning; and the late Kimberly Filbert, MPH, IISP project epidemiologist, Virginia Department of Health, for contributing to the design and quality of the IISP data and for providing thoughtful commentary to the articles our group has written together.
Disclaimer. The findings and conclusions in this report are those of the authors and do not necessarily represent the views of the CDC. The use of trade names is for identification only and does not imply endorsement by the Department of Health and Human Services or the CDC.
Financial support. This work was supported by the Council of State and Territorial Epidemiologists (cooperative agreement 5U38HM000414-04 from the Centers for Disease Control and Prevention).
Potential conflicts of interest. All authors: No reported conflicts.
All authors have submitted the ICMJE Form for Disclosure of Potential Conflicts of Interest. Conflicts that the editors consider relevant to the content of the manuscript have been disclosed.
References
- 1.Thompson WW, Comanor L, Shay DK. Epidemiology of seasonal influenza: use of surveillance data and statistical models to estimate the burden of disease. J Infect Dis. 2006;194(Suppl 2):S82–91. doi: 10.1086/507558. [DOI] [PubMed] [Google Scholar]
- 2.Monto AS, Sullivan KM. Acute respiratory illness in the community. Frequency of illness and the agents involved. Epidemiol Infect. 1993;110:145–60. doi: 10.1017/s0950268800050779. [DOI] [PMC free article] [PubMed] [Google Scholar]
- 3.Hamelin ME, Abed Y, Boivin G. Human metapneumovirus: a new player among respiratory viruses. Clin Infect Dis. 2004;38:983–90. doi: 10.1086/382536. [DOI] [PMC free article] [PubMed] [Google Scholar]
- 4.Neuzil KM, Maynard C, Griffin MR, Heagerty P. Winter respiratory viruses and health care use: a population-based study in the northwest United States. Clin Infect Dis. 2003;37:201–7. doi: 10.1086/375604. [DOI] [PubMed] [Google Scholar]
- 5.Glaser CA, Gilliam S, Thompson WW, et al. Medical care capacity for influenza outbreaks, Los Angeles. Emerg Infect Dis. 2002;8:569–74. doi: 10.3201/eid0806.010370. [DOI] [PMC free article] [PubMed] [Google Scholar]
- 6.Khetsuriani N, Lamonte-Fowlkes A, Oberst S, Pallansch MA Centers for Disease C, Prevention. Enterovirus surveillance--United States, 1970–2005. MMWR Surveill Summ. 2006;55:1–20. [PubMed] [Google Scholar]
- 7.U.S. Outpatient Influenza-like Illness Surveillance Network (ILINet) Available at: http://www.cdc.gov/flu/weekly/ussurvdata.htm. Accessed 8 September 2011.
- 8.Brownstein JS, Mandl KD. Pediatric population size is associated with geographic patterns of acute respiratory infections among adults. Ann Emerg Med. 2008;52:63–8. doi: 10.1016/j.annemergmed.2008.02.009. [DOI] [PMC free article] [PubMed] [Google Scholar]
- 9.National Respiratory and Enteric Virus Surveillance System (NREVSS) Available at: http://www.cdc.gov/surveillance/nrevss/ Accessed 7 January 2013. [Google Scholar]
- 10.Fowlkes A, Dasgupta S, Chao E, et al. Estimating influenza incidence and rates of influenza-like illness in the outpatient setting. Influenza Other Respi Viruses. 2013;7:694–700. doi: 10.1111/irv.12014. [DOI] [PMC free article] [PubMed] [Google Scholar]
- 11.Sakthivel SK, Whitaker B, Lu X, et al. Comparison of fast-track diagnostics respiratory pathogens multiplex real-time RT-PCR assay with in-house singleplex assays for comprehensive detection of human respiratory viruses. J Virol Methods. 2012;185:259–66. doi: 10.1016/j.jviromet.2012.07.010. [DOI] [PMC free article] [PubMed] [Google Scholar]
- 12.US Census Bureau. Washington, DC: 2010 Census Briefs; 2011. Age and sex composition: 2010. [Google Scholar]
- 13.CDC. Respiratory syncytial virus--United States, July 2007-June 2011. MMWR Morb Mortal Wkly Rep. 2011;60:1203–6. [PubMed] [Google Scholar]
- 14.Falchi A, Turbelin C, Andreoletti L, et al. Nationwide surveillance of 18 respiratory viruses in patients with influenza-like illnesses: a pilot feasibility study in the French Sentinel Network. J Med Virol. 2011;83:1451–7. doi: 10.1002/jmv.22113. [DOI] [PMC free article] [PubMed] [Google Scholar]
- 15.Brittain-Long R, Nord S, Olofsson S, Westin J, Anderson LM, Lindh M. Multiplex real-time PCR for detection of respiratory tract infections. J Clin Virol. 2008;41:53–6. doi: 10.1016/j.jcv.2007.10.029. [DOI] [PMC free article] [PubMed] [Google Scholar]
- 16.Makela MJ, Puhakka T, Ruuskanen O, et al. Viruses and bacteria in the etiology of the common cold. J Clin Microbiol. 1998;36:539–42. doi: 10.1128/jcm.36.2.539-542.1998. [DOI] [PMC free article] [PubMed] [Google Scholar]
- 17.Grondahl B, Puppe W, Hoppe A, Kuhne I, Weigl JA, Schmitt HJ. Rapid identification of nine microorganisms causing acute respiratory tract infections by single-tube multiplex reverse transcription-PCR: feasibility study. J Clin Microbiol. 1999;37:1–7. doi: 10.1128/jcm.37.1.1-7.1999. [DOI] [PMC free article] [PubMed] [Google Scholar]
- 18.Longini IM, Jr., Seaholm SK, Ackerman E, Koopman JS, Monto AS. Simulation studies of influenza epidemics: assessment of parameter estimation and sensitivity. Int J Epidemiol. 1984;13:496–501. doi: 10.1093/ije/13.4.496. [DOI] [PubMed] [Google Scholar]
- 19.Lee MS, Walker RE, Mendelman PM. Medical burden of respiratory syncytial virus and parainfluenza virus type 3 infection among US children. Implications for design of vaccine trials. Hum Vaccin. 2005;1:6–11. doi: 10.4161/hv.1.1.1424. [DOI] [PubMed] [Google Scholar]
- 20.Falsey AR, Hennessey PA, Formica MA, Cox C, Walsh EE. Respiratory syncytial virus infection in elderly and high-risk adults. N Engl J Med. 2005;352:1749–59. doi: 10.1056/NEJMoa043951. [DOI] [PubMed] [Google Scholar]
- 21.Faden H, Wilby M, Hainer ZD, et al. Pediatric adenovirus infection: relationship of clinical spectrum, seasonal distribution, and serotype. Clin Pediatr (Phila) 2011;50:483–7. doi: 10.1177/0009922810392775. [DOI] [PubMed] [Google Scholar]
- 22.van den Hoogen BG, de Jong JC, Groen J, et al. A newly discovered human pneumovirus isolated from young children with respiratory tract disease. Nat Med. 2001;7:719–24. doi: 10.1038/89098. [DOI] [PMC free article] [PubMed] [Google Scholar]
- 23.Reed G, Jewett PH, Thompson J, Tollefson S, Wright PF. Epidemiology and clinical impact of parainfluenza virus infections in otherwise healthy infants and young children < 5 years old. J Infect Dis. 1997;175:807–13. doi: 10.1086/513975. [DOI] [PubMed] [Google Scholar]
- 24.Wikswo ME, Khetsuriani N, Fowlkes AL, et al. Increased activity of Coxsackievirus B1 strains associated with severe disease among young infants in the United States, 2007–2008. Clin Infect Dis. 2009;49:e44–51. doi: 10.1086/605090. [DOI] [PubMed] [Google Scholar]
- 25.Iwane MK, Prill MM, Lu X, et al. Human rhinovirus species associated with hospitalizations for acute respiratory illness in young US children. J Infect Dis. 2011;204:1702–10. doi: 10.1093/infdis/jir634. [DOI] [PubMed] [Google Scholar]
- 26.Weigl JA, Puppe W, Meyer CU, et al. Ten years’ experience with year-round active surveillance of up to 19 respiratory pathogens in children. Eur J Pediatr. 2007;166:957–66. doi: 10.1007/s00431-007-0496-x. [DOI] [PMC free article] [PubMed] [Google Scholar]
- 27.Monto AS. Occurrence of respiratory virus: time, place and person. Pediatr Infect Dis J. 2004;23:S58–64. doi: 10.1097/01.inf.0000108193.91607.34. [DOI] [PubMed] [Google Scholar]
- 28.Brittain-Long R, Andersson LM, Olofsson S, Lindh M, Westin J. Seasonal variations of 15 respiratory agents illustrated by the application of a multiplex polymerase chain reaction assay. Scand J Infect Dis. 2012;44:9–17. doi: 10.3109/00365548.2011.598876. [DOI] [PubMed] [Google Scholar]
- 29.Panozzo CA, Fowlkes AL, Anderson LJ. Variation in timing of respiratory syncytial virus outbreaks: lessons from national surveillance. Pediatr Infect Dis J. 2007;26:S41–5. doi: 10.1097/INF.0b013e318157da82. [DOI] [PubMed] [Google Scholar]
- 30.Olofsson S, Brittain-Long R, Andersson LM, Westin J, Lindh M. PCR for detection of respiratory viruses: seasonal variations of virus infections. Expert Rev Anti Infect Ther. 2011;9:615–26. doi: 10.1586/eri.11.75. [DOI] [PMC free article] [PubMed] [Google Scholar]
- 31.Fox JD. Respiratory virus surveillance and outbreak investigation. J Clin Virol. 2007;40(Suppl 1):S24–30. doi: 10.1016/S1386-6532(07)70006-9. [DOI] [PMC free article] [PubMed] [Google Scholar]
- 32.Fry AM, Curns AT, Harbour K, Hutwagner L, Holman RC, Anderson LJ. Seasonal trends of human parainfluenza viral infections: United States, 1990–2004. Clin Infect Dis. 2006;43:1016–22. doi: 10.1086/507638. [DOI] [PubMed] [Google Scholar]
- 33.Monto AS, Ohmit SE, Margulies JR, Talsma A. Medical practice-based influenza surveillance: viral prevalence and assessment of morbidity. Am J Epidemiol. 1995;141:502–6. doi: 10.1093/oxfordjournals.aje.a117464. [DOI] [PubMed] [Google Scholar]
- 34.Health Protection Agency. Sources of UK flu data: Influenza Surveillance in the United Kingdom. Available at: http://www.hpa.org.uk/Topics/InfectiousDiseases/InfectionsAZ/SeasonalInfluenza/EpidemiologicalData/30influsSourcesofUKfludata/ Accessed 19 August 2013.
- 35.Neuzil KM, Zhu Y, Griffin MR, et al. Burden of interpandemic influenza in children younger than 5 years: a 25-year prospective study. J Infect Dis. 2002;185:147–52. doi: 10.1086/338363. [DOI] [PubMed] [Google Scholar]
- 36.Poehling KA, Edwards KM, Weinberg GA, et al. The underrecognized burden of influenza in young children. N Engl J Med. 2006;355:31–40. doi: 10.1056/NEJMoa054869. [DOI] [PubMed] [Google Scholar]
- 37.Talbot HK, Falsey AR. The diagnosis of viral respiratory disease in older adults. Clin Infect Dis. 2010;50:747–51. doi: 10.1086/650486. [DOI] [PMC free article] [PubMed] [Google Scholar]
- 38.Pediatrics AAo. Red Book: 2012 Report of the Committee on Infectious Diseases. In: Pickering L, editor. 29 ed. Elk Grove Village, IL: American Academy of Pediatrics; 2012. [Google Scholar]
Associated Data
This section collects any data citations, data availability statements, or supplementary materials included in this article.