

Abstract
Network analysis is quickly gaining popularity in psychopathology research as a method that aims to reveal causal relationships among individual symptoms. To date, four main types of psychopathology networks have been proposed: (1) association networks, (2) regularized concentration networks, (3) relative importance networks, and (4) directed acyclic graphs. We examined the replicability of these analyses based on symptoms of major depression and generalized anxiety between and within two highly similar epidemiological samples (i.e., the National Comorbidity Survey – Replication [n = 9282] and the National Survey of Mental Health and Wellbeing [n = 8841]). While association networks were stable, the three other types of network analysis (i.e., the conditional independence networks) had poor replicability between and within methods and samples. The detailed aspects of the models—such as the estimation of specific edges and the centrality of individual nodes—were particularly unstable. For example, 44% of the symptoms were estimated as the “most influential” on at least one centrality index across the six conditional independence networks in the full samples, and only 13–21% of the edges were consistently estimated across these networks. One of the likely reasons for the instability of the networks is the predominance of measurement error in the assessment of individual symptoms. We discuss the implications of these findings for the growing field of psychopathology network research, and conclude that novel results originating from psychopathology networks should be held to higher standards of evidence before they are ready for dissemination or implementation in the field.
Keywords: Network analysis, psychopathology, causal inference, psychopathology networks, replication crisis
The popularity of network analysis is spreading quickly in the study of psychopathology. In particular, a growing number of studies using cross-sectional analyses of networks of psychopathology symptoms have appeared in the literature since Cramer et al. (2010a) proposed this approach. These networks are based on the foundational premise that psychopathology symptoms causally influence one another as part of a complex dynamical system, thereby contributing to disorder onset and maintenance (Borsboom & Cramer, 2013; Cramer et al., 2010a). Such analyses represent an effort to map the causal structure of symptom-to-symptom relationships within and between traditionally-defined mental disorders (Borsboom & Cramer, 2013; Cramer et al., 2010a).
The proliferation of network analysis is no doubt related to the attractive qualities of the method. For example, network models are promoted as a window into the nuanced and complex dynamic processes of mental disorders; by focusing on observed symptoms, the models appeal to the salience of proximal, observable clinical targets that other statistical techniques may seem distant from. Network analysis is also an accessible statistical method. Borsboom and Cramer (2013) highlighted that “…the application of network models does not require extensive prior knowledge, as many other methodologies do: All one needs is a set of elements and an idea of how these elements are connected.” (p. 100).
Perhaps the most attractive features of network analysis are the graphical representations of the networks, which can display the interrelationships among hundreds of variables in a single figure (e.g., Boschloo, Schoevers, van Borkulo, Borsboom & Oldehinkel, 2016a; Boschloo et al., 2015). Each network figure is generally comprised of circular nodes, which represent the symptoms being analyzed, and linear edges, which represent a pairwise statistical relationship between each pair of nodes. Edges can be weighted (the width of the edge represents the strength of a relationship) or unweighted (representing the presence or absence of a relationship); directed (unidirectional, indicated with an arrow) or undirected (bidirectional, typically indicated with a line); and positive (e.g., green) or negative (e.g., red). This intuitive interpretation is further facilitated by the Fruchterman and Reingold (1991) algorithm used in many psychopathology network figures, in which strongly related symptoms are attracted towards one another (i.e., tend to cluster together) and symptoms with weaker interrelationships repel one another (i.e., tend to be positioned on the edges of the network).
The Four Main Types of Psychopathology Networks
There are four main types of networks that psychopathologists have used in cross-sectional, observational symptom data, each of which is presented as a step towards characterizing the causal system within and/or between mental disorders (e.g., Borsboom & Cramer, 2013; McNally, 2016). These four types of networks, in turn, can be considered separately based on whether they represent zero-order relationships (e.g., Pearson correlations), or relationships that are conditionally independent of other relationships in the network (e.g., partial correlations).
Association Networks
First, association networks are based on the zero-order bivariate relationships (e.g., Pearson correlations) among the nodes, and include undirected weighted edges to represent the strength of these relationships. Association network figures are useful for visualizing the multivariate relationships among symptoms (Epskamp, Kruis & Marsman, under review-b), and highlight the patterns in which symptoms tend to cluster together (Borsboom & Cramer, 2013). However, association networks do not account for the fact that the correlation between a pair of nodes might be due to their shared relationships with other symptoms (i.e., they may only be conditionally dependent, Borsboom & Cramer, 2013; McNally et al., 2014).
Conditionally Independent Networks
In contrast, the three other main types of psychopathology networks exclude the variance that is shared by more than two symptoms to isolate the conditionally independent relationships between each pair of nodes. We will refer collectively to networks based on patterns of conditionally independent relationships (i.e., concentration networks, relative importance networks, and directed acyclic graphs, discussed in more detail below) as conditional independence networks. Figure 1 briefly illustrates the difference between conditionally dependent and conditionally independent relationships. For example, on the left of the figure, a large proportion of the relationship between A and B is conditionally dependent on (i.e., overlapping with) C and D. On the right of the figure, we can see the conditionally independent relationship between A and B (i.e., the relationship that is shared between A and B, but unshared with any other symptoms). In the network literature, conditionally independent relationships are purported to “provide clues about the causal skeleton of a network” (Borsboom & Cramer, 2013, p. 105), in that they highlight the direct (versus indirect) relationship between nodes (Robinaugh, LeBlanc, Vuletich & McNally, 2014). In Figure 1, nodes A and B would be more strongly related in an association network than in a conditional independence network, but the smaller conditionally independent relationship between them might be used to infer that they are directly causally related. However, it is important to note that this relationship might also be due to shared item content, a reciprocal effect, or the common effect of an unmodelled variable (Costantini et al., 2015).
Figure 1.
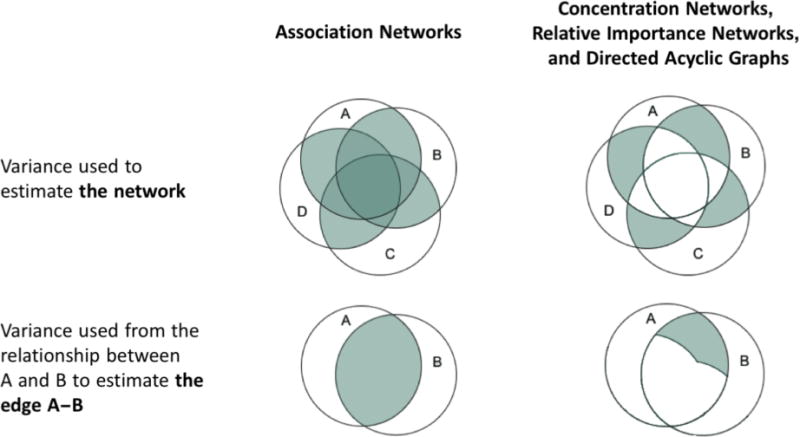
An illustrative example of the variance that is used to calculate association networks (left); and concentration networks, relative important networks, and directed acyclic graphs (right).
As mentioned above, there are three main categories of conditional independence networks that we will explore in this study: concentration networks, relative importance networks, and directed acyclic graphs (DAGs). Concentration networks are made up of undirected weighted edges that represent the conditionally independent relationships between nodes (e.g., partial correlations; see Lauritzen, 1996; van Borkulo et al., 2014a for details). Concentration networks are often regularized to eliminate weak and unreliable estimated edges from the model (see Friedman, Hastie, & Tibshirani, 2008; Tibshirani, 1996 for details). Regularization thus maximizes specificity, but at the cost of sensitivity (Epskamp et al., under review-b); van Borkulo et al. (2014a) suggested that by using a regularization method in binary data “the important connections are almost always correctly identified” (p. 2) and “there is a near absence of false positive among estimated network connections” (p. 3). This purported reliability—and consequent expected replicability—of regularized models is emphasized in the literature (e.g., Boschloo et al., 2016a; Costantini et al., 2015; Epskamp et al., under review-b).
Relative importance networks represent the strength and direction of each edge based on the average amount of variance that, for example, node X predicts in node Y (X➔Y), and vice versa (Y➔X), after controlling for all possible combinations of the other nodes in the network. In other words, each weighted and directed edge represents the proportion of explained variance (expressed as R2, ranging from 0 to 1) that is attributable to each node after accounting for multicollinearity (i.e., the intercorrelations among all of the nodes in a network). The interpretation of relative importance networks emphasizes when one of the edges between a pair of nodes has higher relative importance than the other (see Johnson & LeBreton, 2004 for further discussion of relative importance). When X➔Y is stronger than Y➔X it is inferred that X directly predicts Y (Hoorelbeke, Marchetti, De Schryver & Koster, 2016; McNally, 2016; McNally et al., 2014; Robinaugh et al., 2014).
Finally, DAGs aspire to discern causality via constraint-based (e.g., Borsboom & Cramer, 2013) or Bayesian network analysis (e.g., McNally, 2016). More realistically, DAGs depict the direction of probabilistic dependencies so that the unweighted and directed edge X ➔ Y indicates that the presence of node X is associated with an increased likelihood that Y will also be present (see Scutari, 2010 for more information on the computation of DAGs).
The Utility of Psychopathology Networks Relies on Generalizability and Replicability
While the global characteristics of these four types of networks are sometimes interpreted (e.g., the global connectivity and/or density of the network; van Borkulo et al., 2015), it is the detailed features of the networks that are claimed to represent their distinctive promise. Specifically, the proponents of network analysis have emphasized two primary types of utility for psychopathology networks based on cross-sectional symptom-level data. (1) Generating hypotheses about the symptom-to-symptom relationships that characterize trajectories toward the onset and/or maintenance of one or more mental disorders (e.g., Borsboom & Cramer, 2013; Cramer et al., 2010a; Rhemtulla et al., 2016). (2) Identifying the most influential symptoms in the network, which are believed to trigger the development of other symptoms, predict disorder onset, and represent urgent clinical targets (Boschloo, van Borkulo, Borsboom & Schoevers, 2016b; Cramer & Borsboom, 2015; McNally et al., 2014; Rhemtulla et al., 2016). With few exceptions, these detailed characteristics of the networks (i.e., the presence, strength, and/or direction of specific edges; and the centrality of individual nodes) tend to be the focus of network analysis, and form the basis for studies’ conclusions (e.g., Borsboom & Cramer, 2013; Cramer et al., 2010a; Fried et al., 2015; Fried, Epskamp, Nesse, Tuerlinckx & Borsboom, 2016; Rhemtulla et al., 2016).
In short, the aim of network analysis is to characterize the role of individual symptoms in the onset and course of mental disorders. This aim demands that the inferences and hypotheses derived from psychopathology networks are generalizable and replicable beyond the samples in which they were derived. While the proponents of network analysis have noted that the symptom-to-symptom relationships estimated in a network will not necessarily be present in all individuals (e.g., Cramer et al., 2010a), networks derived from between-subjects associations would presumably need to be replicable (i.e., in other samples) in order for psychopathology network research to have utility. Replicability is particularly pertinent given that psychology research—including clinical psychology—is in the midst of a replication crisis (Open Science Collaboration, 2015; Tackett et al., 2016). This may be at least partly due to a focus on generating new and exciting findings at the expense of rigorous and repeated testing of hypotheses. Inferences made from psychopathology networks are likely to be particularly susceptible to this pitfall, as network analyses are exploratory, data-driven techniques that entail estimation of a large number of parameters. For example, an association or concentration network of posttraumatic stress disorder (PTSD) symptoms from Diagnostic and Statistical Manual of Mental Disorders – Fifth Edition (American Psychiatric Association, 2013) would have 20 nodes and 190 possible edges (calculated as k*[k−1]/2, where k is the number of nodes).
There are numerous other harbingers of poor replicability for psychopathology networks, the most salient of which is the inevitable presence of substantial measurement error in symptom-level psychopathology data. In most psychometric models, each of the observed scores for symptoms A to D in Figure 1 comprises true score (i.e., the information we are interested in learning more about), systematic error (e.g., from overlap in the content of the questions about each symptom), and random error (or noise). From a psychometric perspective, the most reliable information from the symptoms is in their overlap. For example, the darkest areas of the variance used to estimate association networks in Figure 1 (i.e., the areas with the most overlap) would likely be comprised mostly of true score and some systematic error. However, the conditionally independent relationships—on the right of Figure 1—are based on the variance shared by only two symptoms, and the reliable variance shared by more than two symptoms is not used to estimate the conditional independence networks. This means that the conditionally independent relationships are more likely to be made up of systematic error and noise, which makes them vulnerable to subtle changes in the data and likely to vary depending on the nodes that are included or excluded from an analysis (see Supplementary Materials Appendix S1 for examples that illustrate the sensitivity of conditionally independent relationships to different types of change). Combined with the inherently exploratory nature of psychopathology networks, the large number of parameters estimated, and the emphasis on conditionally independent relationships among symptoms, this means that the networks are likely highly influenced by noise and prone to overfitting the data, potentially resulting in nonreplicable solutions. Our aim herein is to explore this possibility explicitly and empirically.
In line with theoretical reasons to expect poor replicability, there have been multiple studies that have estimated concentration networks of depression, each of which has differed in the rank-orders of node strength centrality (e.g., Fried et al., 2016; van Borkulo et al., 2014a; van Borkulo et al., 2015). The network structure of depression also appears to change depending on the symptoms included in the model, as well as whether it is modelled alone or alongside other syndromes (e.g., Boschloo et al., 2016b; Boschloo et al., 2015; Fried et al., 2016; Robinaugh et al., 2014; van Borkulo et al., 2014a; van Borkulo et al., 2015), although this may be related in part to the use of different measures of depression (Fried, van Borkulo, Cramer, Boschloo, Schoevers, & Borsboom, under review). Similarly, studies that have examined the network structure of posttraumatic stress disorder (PTSD) using each of the four main types of network analysis across two data sets have found results that suggest the different methods uncover different relationships, some of which may represent idiosyncrasies unique to a dataset that do not generalize to other data (McNally, 2016; McNally et al., 2014).
However, despite the a priori reasons to expect poor replicability, and the preliminary evidence in extant research that psychopathology network results are unstable, the replicability of the focal characteristics of networks (e.g., the presence, strength, and/or direction of specific edges; and the centrality of individual nodes) has not been addressed explicitly to date. In the context of the proliferation of psychopathology network research in prestigious journals, it is therefore critical to determine the extent to which psychopathology networks are replicable.
The Present Study
The aim of the present study was to fill this specific gap in the emerging network literature by testing the replicability of key features in each of the four main network models used in cross-sectional psychopathology symptom research. We examined both generalizability of the results (i.e., attempting to produce convergent results in a similar sample; cf. Lykken, 1968) and the stability of the results (i.e., attempting to duplicate findings in methodologically identical samples by comparing random split-halves within samples; cf. Lykken, 1968). The between-samples generalizability of the results is representative of how we might expect the psychopathology network literature to evolve as network analysts ask similar questions in different datasets. While the within-samples tests do not speak directly to the generalizability of psychopathology network results, they quantify the sensitivity of the networks to smaller differences between samples, and ensure that any differences in the between-samples analyses are not unduly biased by idiosyncrasies in the samples we selected (Brandt et al., 2014).
Through a review of the network analysis literature, we found a variety of methods that have been used to compare networks. These methods include visual comparison of network structure (Costantini et al., 2015; Rhemtulla, Fried, Aggen, Tuerlinckx, Kendler, & Borsboom, 2016), comparing global strength between networks (Beard et al., 2016; van Borkulo et al., 2015), using correlations to quantify the overall similarity in estimated edges between networks (Beard et al., 2016; Rhemtulla et al., 2016), comparing the average node centrality between networks (Curtiss & Klemanski, 2016; Fried et al., 2016; van Borkulo et al., 2015), and visual comparisons of patterns in node centrality indices (Rhemtulla et al., 2016; van Borkulo et al., 2015). Notably, these analyses have not compared individual edge or node characteristics. Given these are the focal features in interpreting networks, there is an evident mismatch in extant network comparison methods and the intended research questions (cf. Anderson & Maxwell, 2016). Further, all of these comparisons have been conducted within samples for different networks, or between different groups of participants; we could not find any examples of cross-sectional psychopathology network research that tested the replicability of their results in a second similar sample. As such, neither the generalizability nor the stability of the focal psychopathology network characteristics have been tested to date, to the best of our knowledge.
In the present study, we therefore systematically tested the similarities and differences in psychopathology network features—from broad (e.g., the level of connectivity in the networks) to specific (e.g., the rank-order of individual nodes)—between and within two epidemiological samples. We started with the major depressive episode (MDE) and generalized anxiety disorder (GAD) symptom data from the National Comorbidity Survey – Replication (NCS-R; Kessler et al., 2004), which has been the focus of two seminal psychopathology network papers (Borsboom & Cramer, 2013; Cramer et al., 2010a). We subsequently sought to replicate the NCS-R networks in a similar epidemiological sample (i.e., the 2007 Australian National Survey of Mental Health and Wellbeing [NSMHWB]; Australian Bureau of Statistics, 2007; Slade, Johnston, Oakley Browne, Andrews & Whiteford, 2009) that used the same structured diagnostic interview. We then compared each type of network in ten pairs of random split-halves within each sample.
An auxiliary aim was to examine the consistency among the three types of network models that represent conditionally independent relationships (i.e., concentration networks, relative importance networks, and DAGs), all of which identify relationships between symptoms that are interpreted as reflecting causal associations (McNally, 2016; McNally et al., 2014). While we would not necessarily expect the global features of these conditional independence networks to be similar (e.g., connectivity or density), it is crucial for the promoted utility of psychopathology networks that there is consistency in the focal characteristics of the networks, such as the most influential node, and the presence or absence of edges that purportedly reflect causal associations at different levels of abstraction.
Method
Samples and Assessment
The NCS-R and the NSMHWB are both nationally representative household surveys of English speakers in the United States and Australia, respectively. Detailed information on the methodology of these surveys has been reported elsewhere (Kessler et al., 2004; Slade et al., 2009). Recruitment and consent procedures for NCS-R were approved by the Human Subjects Committees of Harvard Medical School and the University of Michigan; the NSMWHB was conducted under the authority of the Census and Statistics Act 1905. Both surveys were based on the World Mental Health Survey Initiative version of the World Health Organization’s Composite International Diagnostic Interview (WMH-CIDI; Kessler & Ustun, 2004). The NCS-R interviews were conducted between February 2001 and April 2003, and the present study includes the 9282 respondents (mean age = 44.7, standard deviation [SD] = 17.50; male = 44.6%) who participated in the core diagnostic assessment. The NSMHWB interviews were conducted between August and December 2007, and the present study includes the 8841 respondents (mean age = 46.4, SD = 18.99; male = 44.5%) who participated in the survey. The average age was higher in NSMHWB, although the effect size was small (t(17820.20) = −5.95, p < .0005; Cohen’s d = .09); there were no differences in the proportions of men and women between the two samples (χ2(1) = 1.68, p = .195; φ = .01).
The symptoms that were analysed in the present study were derived from the WMH-CIDI algorithms that code each diagnostic criterion for DSM-IV MDE and GAD as present (1) or absent (0), and are the same in both samples (see Table 1). Missing values that arose from the skip structure of the questionnaire were replaced with zeros, in line with Cramer et al. (2010a) and Borsboom and Cramer (2013). All of the analyses were based on the bivariate relationships among the symptoms, and these patterns were the same in both samples; a model that constrained the correlation matrices to be equal in both samples had excellent fit (comparative fit index [CFI] = 1.000, Tucker-Lewis index [TLI] = .999, root mean square error of approximation [RMSEA] = .017, chi-square difference test [χ2diff] (171) = 794.80, p < .0005)1. In short, we had two representative population samples of similar size and equivalent symptom characteristics that were conducted using the same instructions, procedures, and measures of MDE and GAD symptoms (cf. Brandt et al., 2014). The only a priori reason to expect possible differences between the samples was their countries of origin, and this was accounted for by assessing replicability within the samples (i.e, between split-half pairs).
Table 1.
Abbreviations for Symptoms Included in Analyses
| Major Depressive Episode (MDE)
|
Generalized Anxiety Disorder (GAD)
|
||
|---|---|---|---|
| Abbreviation | Symptom | Abbreviation | Symptom |
|
|
|
||
| depr | Depressed mood | anxi | Chronic anxiety/worry |
| inte | Loss of interest | even | Anxiety about >1 event |
| weig | Weight problems | ctrl | No control over anxiety |
| mSle | Sleep problems | edge | Feeling on edge |
| moto | Psychomotor disturbances | gFat | Fatigue |
| mFat | Fatigue | gCon | Concentration problems |
| repr | Self-reproach | irri | Irritability |
| mCon | Concentration problems | musc | Muscle tension |
| suic | Suicidal ideation | gSle | Sleep problems |
Statistical Analysis
Computing the Networks
Borsboom and Cramer (2013) included a tutorial for the network analysis of the MDE and GAD symptoms in NCS-R2. However, since the publication of Borsboom and Cramer (2013), there have been developments in the methods for the network analysis of binary data in particular, but also more broadly for network analysis of cross-sectional psychopathology data (e.g., Costantini et al., 2015; Epskamp, Borsboom & Fried, under review-a; McNally, 2016; van Borkulo et al., 2014a). Our aim in these analyses was to use the most reliable methods for estimating networks to maximize their replicability. As such, rather than rely on the methods from the Borsboom and Cramer (2013) tutorial (e.g., estimating an association network based on Pearson correlations in binary data), we chose four network models to compare in the NCS-R and NSMHWB data, following recommendations from the more recent literature (Costantini et al., 2015; Epskamp et al., under review-a; McNally, 2016; van Borkulo et al., 2014a): (1) association networks based on tetrachoric correlations, (2) concentration networks based on regularized Ising models, (3) relative importance networks, and (4) DAGs based on Bayesian network analysis.
Association networks were estimated using the R (R Core Team, 2013) package qgraph (Epskamp, Cramer, Waldorp, Schmittmann & Borsboom, 2012) based on tetrachoric correlations to represent the bivariate relationships in the data; tetrachoric correlations are interpreted just like any other correlation coefficient.
Ising models were computed to represent the conditionally independent relationships between nodes. The edges in these models are based on log-linear regression coefficients, which can be interpreted much like partial correlations; they represent the association between a pair of nodes after controlling for their relationships with all the other nodes. We used the eLasso regularization method in the R package IsingFit (van Borkulo, Epskamp & Robitzsch, 2014b), which applies an l1-penalty to the log-linear regression coefficients to find an optimal balance of sparsity (i.e., having few edges) and goodness of fit of the network to the data (e.g., van Borkulo et al., 2014a). Following the recommendations of van Borkulo et al. (2014a), we emphasized specificity in these models by encouraging a parsimonious solution; the hyperparameter was set at .25 to penalize models with more parameters and the “AND-rule” was used to require both regression coefficients (e.g., A➔B and B➔A) to be non-zero for an edge (e.g., A—B) to be included in the network.
Relative importance networks were estimated using the lmg metric in the R package relaimpo (Grömping, 2006). Given all 306 possible edges are estimated in this type of network, we highlighted nodes with higher relative importance by only retaining an edge in the network if it accounted for at least 5% of the variance in the predicted node (cf. Robinaugh et al., 2014) and if it had higher relative importance in a pair of nodes (i.e., accounted for at least .5% more variance than the other edge in the pair3). In other words, if A➔B had an edge weight of .08 (R2 = 8%) and B➔A had an edge weight of .06 (R2 = 6%), the network only included the edge from A➔B. This was done to facilitate the objective interpretation and comparison of the networks without relying on visual assessment of line weights (cf. Diaconis, 1985). The full uncensored relative importance networks with all 306 edges are included in the Supplementary Materials (Figure S1).
DAGs were computed based on Bayesian network analyses (i.e., the hill-climbing algorithm from the R package bnlearn; Scutari, 2010), as described in McNally, Mair, Mungo, and Riemann (2017). The hill-climbing algorithm adds, removes, and reverses edges until a target Bayesian Information Criterion score is reached. We estimated DAGs based on 1000 bootstrap samples, taking the average network of the bootstraps and retaining only edges that appeared in at least 85% of these networks, plotted in their most frequent direction. McNally et al. (2017) describe these sparse networks as the most likely to estimate genuine edges, compared to alternative methods for computing DAGs. The DAGs were plotted as trees that position predictors upstream from the nodes they predict (i.e., all edges are downward-pointing arrows). All other network figures were plotted in using the Fruchterman and Reingold (1991) algorithm, which positions nodes with stronger connections near the center of the network, and those with weaker connections near the periphery. A Fruchterman and Reingold plot of the DAGs is also available in the Supplementary Materials (Figure S2) for consistency.
Comparing the Networks
For the between-samples analyses, we treated the NCS-R as the baseline model, and the NSMHWB as the replication model. These analyses tested the generalizability of the results by making comparisons within each of the four types of network analysis between the two samples (e.g., comparing the Ising model in NCS-R to the Ising model in NSMHWB) as detailed below. The figures of these networks are presented to show examples of each type of network, and to illustrate specific inferences that generalize (or do not generalize) from one network to the other 4. The within-samples analyses were based on comparisons within each type of network and within each sample by comparing ten pairs of random split-halves in each dataset. Rather than presenting all twenty sets of analyses, we summarize the results based on the central tendency (median) for each set of split-halves. Reliability within each sample would ordinarily be required before examining reliability between the samples, but in this case presenting both sets of results allowed us to illustrate the ways in which different indicators of replicability vary within and between samples, providing a more complete picture of the performance of network models in cross-sectional symptom-level data.
There are no established methods for systematically comparing the range of network characteristics of interest in psychopathology research or assessing model fit for the four types of networks estimated in this study, to the best of our knowledge. As such, we have carefully defined the effects that we intended to replicate, and tests specific to those effects (cf. Brandt et al., 2014). We compared the network features—from broad to specific—using metrics with varying levels of sensitivity to instability in the network characteristics that are focused on in the psychopathology network literature. Specifically, we compared the following characteristics—presented in order of expected sensitivity to differences between networks:
The differences in the global connectivity (i.e., the number of connections that were estimated to be non-zero; Boschloo et al., 2016a; Costantini et al., 2015; Fried et al., 2016) and density (i.e., average edge strength in weighted networks; De Schryver, Vindevogel, Rasmussen & Cramer, 2015) between the networks.
-
Changes in estimated edges, including:
The proportion of edges in the baseline network that replicated,
The average absolute differences (% change) of the replicated edge weights,
The proportion of edges unique to the baseline network (i.e., that failed to replicate), and
The proportion of edges unique to the replication network.
-
The rank-order of the node centrality indices in each network, and consistency in the most central node5 based on:
Strength, which represents the sum of the edge weights connected to a node. When edges are unweighted (e.g., in DAGs), this metric is called degree and represents the number of edges connected to a node. Similarly, in networks with directed edges, these metrics are presented as out strength/out degree and in strength/in degree to separate edges that represent A➔B (contributing to out strength for A) from edges that represent B➔A (contributing to in strength for A).
Closeness, which represents the inverse of the average shortest path length (i.e., the average number of steps in the shortest path between pairs of symptoms) for a given node with all other nodes in the network.
Betweenness, which represents the number of times a node lies on the shortest path between two other nodes.
The rank-orders of the node centrality indices for each model were compared using Kendall’s tau-b coefficient, as well as matches in rank-order. While tau summarizes the similarities of the relative node rank-orders, examining the exact matches in rank-order (e.g., whether a symptom is ranked first for strength in both samples) is more consistent with the way node centrality indices are interpreted in the psychopathology network literature, which focuses on which specific symptom is ranked first, second, third, or last on each centrality index (e.g., Boschloo et al., 2016b; Cramer & Borsboom, 2015; McNally et al., 2014; Rhemtulla et al., 2016). We calculated the matches in node centrality rank-order by sorting the nodes from highest centrality to lowest centrality within each index, and counting the number of nodes with the same rank-order (e.g., fifth) in both samples. Because duplicate values (i.e., tied ranks) were common within each centrality index, nodes were often able to have multiple ranks; for example, if the second, third, and fourth highest centrality values were equal, then the nodes with these values have interchangeable ranks. We took this flexibility in the ranks into account, and counted a match in rank-order if there was any possible order that facilitated a match and maintained the sorting from highest to lowest centrality. In other words, we report the maximum possible number of matches in node centrality rank-order.
After doing these comparisons for each pair of networks between and within the two samples, we also briefly examined the overall consistency in estimated edges and node centrality between the conditional independence networks in the full samples. The results are summarized below, and elaborated with specific examples in the discussion.
Results
Tetrachoric Correlation Association Networks
Tables 2–4 show the results from the network comparisons between the samples and between the split-halves within the samples. The NCS-R and NSMHWB association networks are shown in Figure 2. The darker and thicker edges show that the symptoms of MDE and GAD are intercorrelated more strongly within each disorder, compared to between the disorders, in both examples. All paths were estimated in all of the association networks, which meant their connectivity was identical and all edges were replicated between and within the samples. The density of the networks and the mean differences in edge weights were more similar within the samples than between them, reflecting the greater similarity in the underlying correlation matrices 6. However, this greater similarity in estimated edges was not reflected in node centrality. The node centrality rank-orders tended to be very similar within and between samples; the rank-order correlations ranged from τ = .67 to τ = .79, but individual nodes rarely had the same rank when comparing networks within and between samples (13.9–27.8% matches in rank-order). Similarly, the NCS-R and NSMHWB networks had different most central nodes, and the split-half pairs within samples had different most central nodes in 70–80% of cases.
Table 2.
Summary of the Comparisons among the Networks between the National Comorbidity Survey–Replication (NCS-R) and the National Survey of Mental Health and Wellbeing (NSMHWB)
| Network Characteristics | Association Networks | Regularized Ising Models | Censored Relative Importance Networks | Directed Acyclic Graphs | ||||
|---|---|---|---|---|---|---|---|---|
|
| ||||||||
| Comparing Global Characteristics | NCS-R | NSMHWB | NCS-R | NSMHWB | NCS-R | NSMHWB | NCS-R | NSMHWB |
| Connectivity (% possible edges) | 153 (100%) | 153 (100%) | 80 (52.3%) | 79 (51.6%) | 31 (10.1%) | 26 (8.5%) | 34 (22.2%) | 33 (21.6%) |
| Density | 0.74 | 0.79 | 1.10 | 1.17 | 0.11 | 0.10 | N/A | N/A |
|
| ||||||||
| Changes in Estimated Edges | ||||||||
| Mean absolute % change in edge weights of replicated edges | 8.3% | 30.4% | 8.0% | N/A | ||||
| Proportion of edges that replicated from NCS-R to NSMHWB | 153 (100%) | 69 (86.3%) | 23 (74.2%) | 27 (79.4%) | ||||
| Edges that failed to replicate from NCS-R | 0 (0%) | 11 (13.8%) | 8 (25.8%) | 7 (20.6%) | ||||
| Edges unique to NSMHWB | 0 (0%) | 10 (12.7%) | 3 (11.5%) | 6 (18.2%) | ||||
|
| ||||||||
| Node Centrality | NCS-R | NSMHWB | NCS-R | NSMHWB | NCS-R | NSMHWB | NCS-R | NSMHWB |
|
| ||||||||
| Most central node | mCon | mSle | depr | anxi | mSle | N/Aa | N/Aa | depr |
|
| ||||||||
| Rank-order | Correlation | Matches in Rank-Order | Correlation | Matches in Rank-Order | Correlation | Matches in Rank-Order | Correlation | Matches in Rank-Order |
|
| ||||||||
| Strength/Out Strength/Out Degree | .79 | 4 (22.2%) | .69 | 3 (16.7%) | .73 | 6 (33.3%) | .75 | 14 (77.8%) |
| In Strength/In Degree | N/A | N/A | N/A | N/A | .57 | 3 (16.7%) | .57 | 16 (88.9%) |
| Closeness | .70 | 5 (27.8%) | .71 | 3 (16.7%) | N/Ab | 18 (100%)b | 1.00c | 18 (100%)c |
| Betweenness | N/Ab | 18 (100%)b | .77 | 10 (55.6%) | .46c | 16 (88.9%)c | .66 | 10 (55.6%) |
No node ranked as most central for at least two centrality indices.
All of the nodes had an estimated centrality index of 0.
At least 16 (89%) of nodes had an estimated centrality index of 0.
Note. Tied ranks (i.e., duplicate values) were common within each centrality index, and enabled nodes to have multiple possible ranks; a match was counted if a symptom could have an identical unique rank-order (e.g., fifth) in both samples. Mismatches were only counted if there was no possible combination of rank-orders that simultaneously facilitated a match and maintained a numerically ordered set of values. See Table 1 for node abbreviations.
Table 4.
Summary of the Comparisons between the Ten Pairs of Random Split-Halves from the National Survey of Mental Health and Wellbeing; Median (Range)
| Network Characteristics | Association Networks | Regularized Ising Models | Censored Relative Importance Networks | Directed Acyclic Graphs | ||||
|---|---|---|---|---|---|---|---|---|
|
| ||||||||
| Comparing Global Characteristics | First Half | Second Half | First Half | Second Half | First Half | Second Half | First Half | Second Half |
| Connectivity (% possible edges) | 100% (N/A) | 100% (N/A) | 47.7% (43.1–48.4) |
45.8% (43.1–48.4) |
9.0% (8.2–9.8) |
8.5% (8.2–9.5) |
14.7% (12.4–15.0) |
14.7% (13.7–18.3) |
| Density | .79 (.78–.80) |
.79 (.78–.79) |
1.18 (1.14–1.25) |
1.22 (1.12–1.33) |
.10 (.10–11) |
.10 (.10–11) |
N/A | N/A |
|
| ||||||||
| Changes in Estimated Edges | ||||||||
| Mean absolute % change in edge weights of replicated edges | 1.9% (1.7–3.0) |
48.4% (36.8–68.7) |
6.8% (5.7–8.6) |
N/A | ||||
| Proportion of edges that replicated from the first random half to the second | 100% (N/A) | 83.4% (78.1–89.4) |
85.4% (76.7–96.3) |
68.2% (56.5–73.7) |
||||
| Edges that failed to replicate from the first random half | 0% (N/A) | 16.6% (10.6–21.9) |
14.6% (3.7–23.3) |
31.8% (26.3–43.5) |
||||
| Edges unique to the second random half | 0% (N/A) | 13.0% (11.9–16.9) |
8.0% (0–20.7) |
37.8% (27.3–48.1) |
||||
|
| ||||||||
| Node Centrality | % matched | # most central | % matched | # most central | % matched | # most central | % matched | # most central |
|
| ||||||||
| Same most central node in both split-halves | 30% | 3 | 0% | 2 | N/A | 0 | 0% | 1 |
|
| ||||||||
| Rank-order | Correlation | Matches in Rank-Order | Correlation | Matches in Rank-Order | Correlation | Matches in Rank-Order | Correlation | Matches in Rank-Order |
|
| ||||||||
| Strength/Out Strength/Out Degree | .79 (.74–84) |
25.0% (5.6–38.9) |
.78 (.61–84) |
33.3% (16.7–44.4) |
.76 (.70–.89) |
55.6% (44.4–61.1) |
.62 (.36–.79) |
77.8% (61.1–88.9) |
| In Strength/In Degree | N/A | N/A | N/A | N/A | .83 (.79–.92) |
55.6% (38.9–66.7) |
.38 (.12–.76) |
72.2% (38.9–88.9) |
| Closeness | .76 (.74–.91) |
25.0% (11.1–38.9%) |
.58 (.37–.80) |
16.7% (0–27.8) |
N/Ab | 100%b (N/A) |
N/Ac | 100%c (N/A) |
| Betweenness | N/Ab | 100%b (N/A) |
.57 (.44–.81) |
52.8% (38.9–72.2) |
.58c (.32c–1.00c) |
94.4%c (88.9–100 c) |
.52 (.16–.68) |
66.7% (44.4–88.9) |
No node ranked as most central for at least two centrality indices
All of the nodes had an estimated centrality index of 0.
At least 16 (89%) of nodes had an estimated centrality index of 0 in all split-halves.
Note. Tied ranks (i.e., duplicate values) were common within each centrality index, and enabled nodes to have multiple possible ranks; a match was counted if a symptom could have an identical unique rank-order (e.g., fifth) in both samples. Mismatches were only counted if there was no possible combination of rank-orders that simultaneously facilitated a match and maintained a numerically ordered set of values.
N/A is indicated for the range where all results across the ten sets of split-halves analyses were identical.
Figure 2.
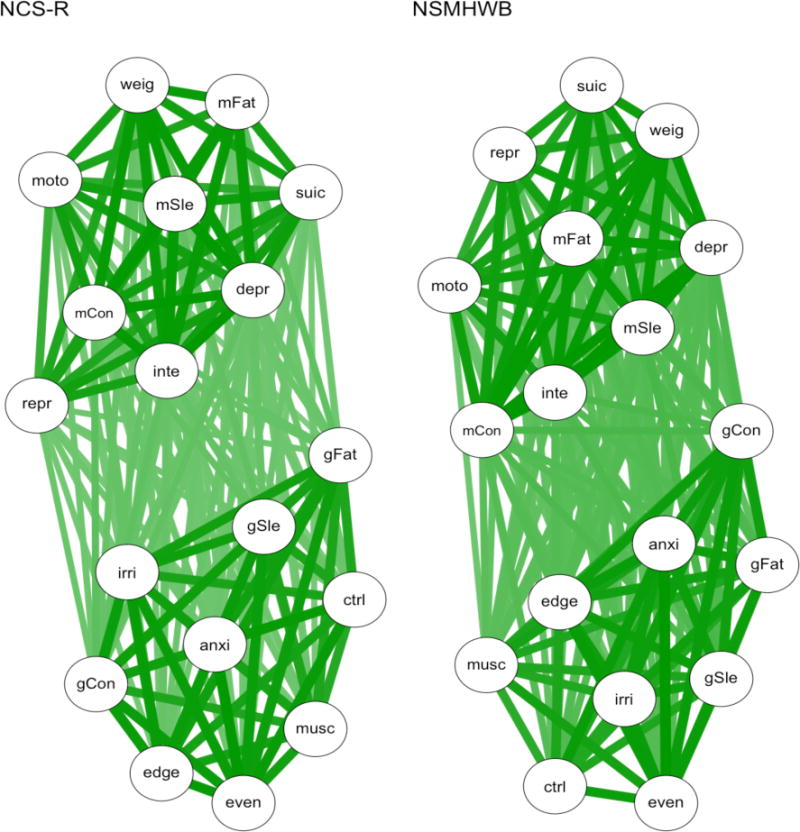
Association networks based on tetrachoric correlations. NCS-R = National Comorbidity Survey – Replication; NSMHWB = National Survey of Mental Health and Wellbeing. See Table 1 for symptom abbreviations.
Regularized Ising Models
The NCS-R and NSMHWB Ising models are shown in Figure 3. The regularization of the log-linear paths between the nodes has resulted in fewer edges being included in each network, but we can still see distinct MDE and GAD clusters in both networks. The replicability of the edges in the Ising models was remarkably similar in the between and within samples comparisons (see Tables 2–4). For example, the connectivity, density, and proportion of replicated edges were consistent. A large proportion of edges tended to replicate (83.4–86.6%), but these replicated edges differed substantially (i.e., by 30.4–48.4%) in the their estimated strength. Node centrality was more idiosyncratic: NCS-R and NSMHWB had different most central nodes, as did all of the split-halves in NSMHWB. In contrast, depressed mood (depr) was consistently estimated as the most central node in NCS-R, such that 80% of the split-half pairs matched. The node centrality rank-order correlations ranged from τ = .57 to τ = .80 between and within samples, but only half of the individual nodes had matches in their rank-order for betweenness centrality (50–55.6% matches in rank-order) and even fewer had matches in their rank-order for strength and closeness centrality (16.7–33.3% matches in rank-order).
Figure 3.
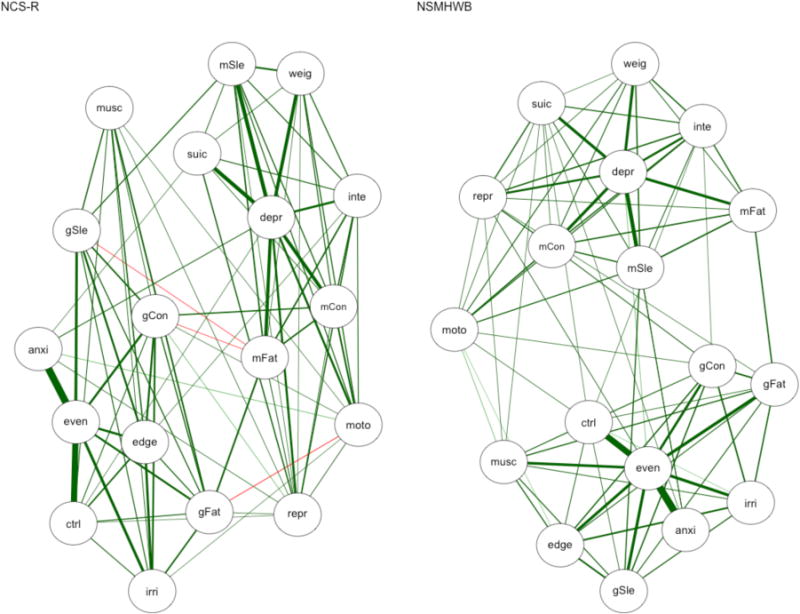
Regularized Ising models. NCS-R = National Comorbidity Survey – Replication, NSHWB = National Survey of Mental Health and Wellbeing. The following edges are negative in NCS-R: gSle–mFat, gCon–mFat, and gFat–moto. All other edges are positive, and the line weights represent the strength of the relationship between two nodes. See Table 1 for symptom abbreviations.
Relative Importance Networks
The censored relative importance networks estimated in NCS-R and NSMHWB are shown in Figure 4. Neither network had bridging edges between MDE and GAD with edge weights over .05, resulting in distinct disorder clusters. While depressed mood (depr) appears to have a similar role in both networks, there are marked differences between the GAD clusters that are at odds with the similar number of connections and density between the two networks (see Table 2). This similar connectivity and density was also seen between the split-half pairs within each sample, and the replicated edges tended to have similar strength between and within the samples too (see Tables 3 and 4). However, the replicability between samples was worse than within samples, as 25.8% of the edges failed to replicate between samples (versus 6.6–14.6% within samples), and the node centrality rank-orders also varied more between samples. For example, sleep problems in MDE (mSle) was the most central node in NSMHWB, but did not rank in the top three most central nodes on any index in NCS-R.
Figure 4.
Censored relative importance networks. The network represents the edges that highlight which nodes have higher relative importance as predictors in the model: Edges were only estimated if they represented an R2 of at least 5% (i.e., an edge weight of .05) and had at least .5% stronger relative importance than the other edge in the node pair. The line weights represent the strength of the relationships, and the arrows represent the direction. NCS-R = National Comorbidity Survey – Replication, NSHWB = National Survey of Mental Health and Wellbeing. See Table 1 for symptom abbreviations.
Table 3.
Summary of the Comparisons between the Ten Pairs of Random Split-Halves from the National Comorbidity Survey–Replication; Median (Range)
| Network Characteristics | Association Networks | Regularized Ising Models | Censored Relative Importance Networks | Directed Acyclic Graphs | ||||
|---|---|---|---|---|---|---|---|---|
|
| ||||||||
| Comparing Global Characteristics | First Half | Second Half | First Half | Second Half | First Half | Second Half | First Half | Second Half |
| Connectivity (% possible edges) | 100% (N/A) | 100% (N/A) | 46.4% (44.4–48.4) |
47.1% (45.8–49.7) |
10.1% (9.5–11.1) |
10.1% (9.2–11.1) |
17.0% (16.3–19.0) |
17.3% (15.7–18.3) |
| Density (average edge strength) | .74 (.73–.76) |
.74 (.72–.75) |
1.14 (1.11–1.19) |
1.13 (1.10–1.19) |
.11 (.10–.11) |
.11 (.11–.11) |
N/A | N/A |
|
| ||||||||
| Changes in Estimated Edges | ||||||||
| Mean absolute % change in edge weights of replicated edges | 2.6% (1.6–6.1) |
33.7% (27.7–40.3) |
7.4% (6.1–9.3) |
N/A | ||||
| Proportion of edges that replicated from the first random half to the second | 100% (N/A) | 86.6% (81.9–91.4) |
92.0% (81.8–100) |
74.0% (64.3–80.0) |
||||
| Edges that failed to replicate from the first random half | 0% (N/A) | 13.4% (8.6–18.1) |
8.0% (0–18.2) |
26.0% (20–35.7) |
||||
| Edges unique to the second random half | 0% (N/A) | 15.4% (9.9–18.1) |
6.8% (0–17.6) |
25.0% (16–33.3) |
||||
|
| ||||||||
| Node Centrality | % matched | # most central | % matched | # most central | % matched | # most central | % matched | # most central |
|
| ||||||||
| Same most central node in both split-halves | 20% | 2 | 80% | 1 | N/A | 0 | 0% | 2 |
|
| ||||||||
| Rank-order | Correlation | Matches in Rank-Order | Correlation | Matches in Rank-Order | Correlation | Matches in Rank-Order | Correlation | Matches in Rank-Order |
|
| ||||||||
| Strength/Out Strength/Out Degree | .79 (.66–.86) |
22.2% (0–44.4) |
.80 (.63–.87) |
27.8% (5.6–50) |
.82 (.73–.92) |
50.0% (33.3–61.1) |
.67 (.53–.76) |
66.7% (55.6–88.9) |
| In Strength/In Degree | N/A | N/A | N/A | N/A | .76 (.57–.83) |
33.3% (16.7–77.8) |
.42 (.18–.61) |
66.7% (55.6–77.8) |
| Closeness | .67 (.54–.80) |
13.9% (0–27.8) |
.59 (.41–.71) |
19.4% (11.1–27.8) |
N/Ab | 100%c (N/A) |
1.00c (N/A) |
100%c (83.3 c–100 c) |
| Betweenness | N/Ab | 100%b (N/A) |
.61 (.21–.77) |
50.0% (38.9–66.7) |
.62 (.30–1.00c) |
88.9% (77.8–100c) |
.46 (.27–.66) |
63.9% (38.9–88.9) |
No node ranked as most central for at least two centrality indices
All of the nodes had an estimated centrality index of 0.
At least 16 (89%) of nodes had an estimated centrality index of 0.
Note. Tied ranks (i.e., duplicate values) were common within each centrality index, and enabled nodes to have multiple possible ranks; a match was counted if a symptom could have an identical unique rank-order (e.g., fifth) in both samples. Mismatches were only counted if there was no possible combination of rank-orders that simultaneously facilitated a match and maintained a numerically ordered set of values.
N/A is indicated for the range where all results across the ten sets of split-halves analyses were identical.
Directed Acyclic Graphs
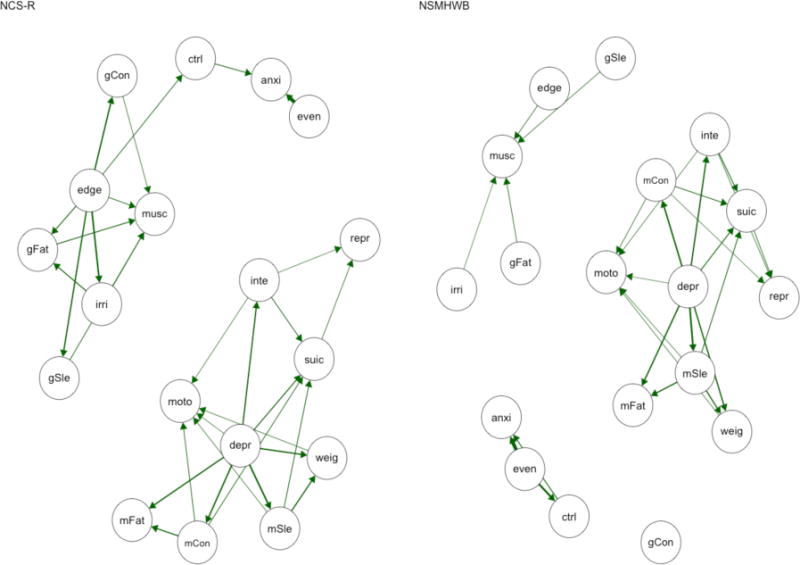
As for the other conditional independence networks, the DAGs had similar connectivity, but approximately one in five of the edges in each sample failed to replicate between the two samples (see Table 2 and Figure 5). The node centrality rank-order correlations ranged from τ = .57 to τ = .75, also mirroring the other conditional independence networks, but tended to have a higher proportion of matches in node centrality rank-order for the strength family of indices than other networks, likely due to the compressed information (count vs. continuous scale) in in degree and out degree centrality. This same pattern of results was seen for node centrality in the split-half comparisons (see Table 3 and Table 4), although it is noteworthy that none of the network pairs—within or between samples—had the same most central node. In contrast, the replicability of edges was worse in the split-half comparisons, where a median of 25.0–37.8% of edges failed to replicate.
Figure 5.
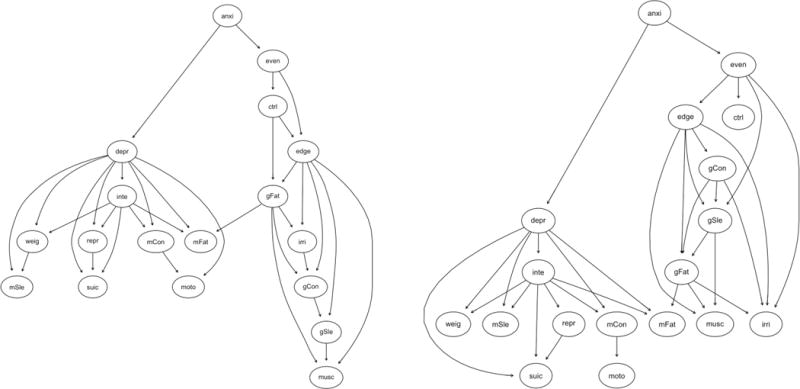
Directed acyclic graphs (DAGs) based on a hill-climbing algorithm for NCS-R (left) and NSMHWB (right). Note that these DAGs are presented in a tree format where nodes are positioned according to their predictive power, as all “causal” arrows point downwards; nodes at the top of the graph predict the nodes lower in the graph (but the reverse is not true). Symptom abbreviations for each disorder are listed in Table 1. NCS-R = National Comorbidity Survey – Replication; NSMHWB = National Survey of Mental Health and Wellbeing.
Consistency between the Conditional Independence Networks
As a follow-up, we briefly examined the consistency in the focal network characteristics (i.e., the most central node, and the presence or absence of specific edges) between the conditional independence networks in NCS-R and NSMHWB. There was very little consistency in the networks. For example, 44.4% of the nodes (n = 8) were ranked as “the most influential” on at least one centrality index (excluding in strength and in degree) in at least one of the networks, and there was limited consistency between the three methods (i.e., no node was ranked highest on a centrality index across the Ising models, relative importance networks, and DAGs). The most striking example of inconsistency between the networks was in the proportion of edges that failed to replicate across all six networks: There were 90 unique undirected edges between the two Ising models, and one additional unique directed edge estimated in the relative importance networks, giving a total of 91 edges estimated with the aim of uncovering the causal relationships among the 18 symptoms. In comparing the networks, we allowed an undirected edge to be replicated by a directed edge between the same two nodes, and vice versa. Only twelve edges (13.2%) were estimated in all six networks. Comparing the three conditional independence networks within the NCS-R dataset, only 17 of the 81 unique edges (20.9%) were consistently estimated; within the NSMHWB dataset only 13 of the 81 unique edges (16.0%) were consistently estimated.7
Discussion
This aim of this study was to test the generalizability and stability of the four main types of psychopathology symptom network models used in cross-sectional research. Broadly, the global characteristics of the models—such as the presence of MDE and GAD clusters, and the connectivity and density of the networks—tended to be consistent within each method between and within the two samples. In contrast, the detailed aspects of the models were much less replicable. Specifically, the three types of models based on patterns of conditional independence among the nodes were generally not consistent between or within the samples with respect to the estimated edges, the rank-order of node centrality, or the most central nodes. This meant that each psychopathology network would result in fundamentally different conclusions regarding the pathways to disorder onset and comorbidity, and regarding which symptoms represent urgent clinical targets, as explored below. Examples of poor and absent replicability are elucidated below and interpreted in the context of the literature. The statistical and theoretical assumptions of the methods that likely account for why we found such poor replicability in the present study are also explored.
Comparing Each Type of Network Between and Within the Two Samples
Tetrachoric Correlation Association Networks
The edges in the association networks were by far the most replicable—between and within samples. This was anticipated, as we would not expect any of the symptom correlations to be exactly zero, which means all of the edges were estimated. However, the node centrality rank-orders were evidently highly sensitive to small—even statistically indistinguishable—differences between networks, as rank-order correlations and matches in individual nodes’ rank-orders in the split-half pairs were generally no more similar than between the full NCS-R and NSMHWB networks.
Another unreliable characteristic in the association networks was the placement of the nodes and their proximity to one another based on the Fruchterman and Reingold (1991) algorithm. Node placement and proximity did not have clear relationships with node centrality, nor with the strength of the relationships among the nodes. For example, the most central nodes in the two full samples (mCon in the NCS-R network and mSle in the NSMHWB network) did not have distinctive positions. It seems likely that this is because the Fruchterman and Reingold (1991) algorithm not only places strongly connected nodes at the center and weakly connected nodes at the periphery, but also distributes nodes evenly in the network, makes edge lengths uniform, and reflects symmetry in the networks. The position and proximity of nodes in the network are consequently not synonymous with node centrality or influence (cf. De Schryver et al., 2015). Researchers who use this method should be aware that this algorithm may obscure—rather than reveal—the detailed symptom-to-symptom information in a psychopathology network. The Fruchterman and Reingold (1991) algorithm does, however, have utility in revealing more global structural features, such as clusters of interrelated nodes.
Regularized Ising Models
The Ising models were the first conditional independence networks we estimated, purportedly representing the “first step” towards determining the causal skeleton of the network (Borsboom & Cramer, 2013, p. 105). One in seven edges tended to fail to replicate between and within the samples, and there was a 30–48% difference in the strengths of the edge weights between each pair of networks. Further, a large proportion of the edges that spanned MDE and GAD (i.e., bridging edges) failed to replicate8. While these are all substantial changes in the context of a model that is promoted for its specificity (i.e., its ability to detect and exclude false positives from the model, e.g., van Borkulo et al., 2014a), the poor replicability of the bridging edges is of particular concern. From the psychopathology network perspective, these edges represent the pathways to the development of comorbidity between disorders (e.g., Borsboom & Cramer, 2013; Cramer et al., 2010a; Goekoop & Goekoop, 2014; McNally et al., 2014; Robinaugh et al., 2014). As such, the differences in bridging edges between networks would have important implications for the inferences that might be made regarding the development of MDE and GAD and/or comorbidity between them. For example, in the full NSMHWB Ising model it might have been inferred—see Borsboom and Cramer (2013)—that chronic worry leads to sleep problems, which lead to fatigue, which leads to depressed mood (anxi – mSle – mFat – depr). This inference cannot be made in the full NCS-R model. Similarly, in the full NCS-R model it might have been inferred that a combination of chronic worry (anxi) and difficulty controlling this worry (ctrl) activates depressed mood (depr), which in turn activates the strongly connected cluster of MDE symptoms (inte, weig, mSle, mFat, mCon, and suic). This same inference cannot be drawn from the NSMHWB network.
Relative Importance Networks
Before interpreting the relative importance networks, it is important to note that our networks were highly censored based on arbitrary criteria for determining relative importance. The full networks each had 684 parameters to interpret and compare (i.e., the weight and direction of each of the 306 edges, and the three centrality indices for each of the 18 nodes), which would be an onerous task to conduct objectively (Diaconis, 1985). This difficulty to objectively identify important results in highly parameterized network models (i.e., to preclude confirmation bias) is a general limitation of all psychopathology networks, which we will revisit later. These uncensored networks had variable replicability9, but given all edges were estimated and represented small effect sizes (median R2 = 1–2%), the substantive interpretation of the networks tended to be similar.
Overall, the censored relative importance networks tended to have greater replicability within versus between samples, particularly in terms of replicated edges. This was likely due to the censoring of weaker edges, which removed 89–92% of the estimated edges from the full networks. Combined with the more similar bivariate relationships between the split-half pairs, the limited focus on only the strongest relationships in the network likely maximized the similarities and stability of the estimated edges. In contrast, the generalizability of the relative importance edges between samples was the poorest of all four types of networks: A quarter of the edges in NCS-R did not replicate, the majority of which were feeling on edge (edge) predicting other GAD symptoms. As was the case for the Ising models, these differences had important implications for the inferences we would make from the two networks. For example, in the NCS-R network, edge had particularly high relative importance for GAD—predicting nearly every other node, and acting as the only link to the three core diagnostic criteria (anxi, even, and ctrl). These results may have led some investigators to emphasize feeling on edge as an “urgent target for clinical intervention” (McNally et al., 2014, p. 10), and press for the development and implementation of clinical interventions to address feeling on edge in GAD. However, these relationships were not present in the NSMHWB network where feeling on edge was of trivial importance, which suggests that those hypothetical efforts to treat the most central symptom in NCS-R would likely have been misguided.
One noteworthy consistency between the NCS-R and NSMHWB relative importance networks was that there were no nodes in the MDE cluster that accounted for more than 5% of the variance in the GAD cluster, and vice versa (i.e., no bridging edges in the censored networks). In the context of the MDE and GAD literature, which highlights the remarkable overlap between the disorders (e.g., Moffitt, Harrington, Caspi, Kim-Cohen, Goldberg, Gregory & Poulton, 2007), this result illustrates the importance of the shared variance between the symptoms for understanding the relationship between disorders. As we indicated in the illustrative example in Figure 1, this shared variance (i.e., the overlap among symptoms) is largely excluded in models that examine patterns of conditionally independent relationships, including relative importance networks. In contrast, latent variables are estimated based exclusively on shared variance, which is more reliable and less susceptible to small differences in the underlying data than the variance that comprises conditionally independent relationships (see Supplementary Materials Appendix S1). Accordingly, we found a latent variable model of these data (i.e., a two-factor confirmatory factor model) to be highly replicable between the two samples in the present study.
Directed Acyclic Graphs
The replicability of the DAGs between the two samples was similar to the Ising models and relative importance networks. However, replicability of specific edges was notably worse in the split-half pairs, with a median of a quarter to over a third of the edges failing to replicate. This finding is in contrast to McNally et al.’s (2017) suggestion that this method “depicts only those edges nearly certain to be genuine” (p. 1207) and highlights the sensitivity of DAGs to small differences in the relationships among symptoms in the network. Overall, the lack of stability and generalizability in the DAGs is to be expected once we understand the assumptions, discussed below, that underlie the estimation and interpretability of the models.
Comparing the Six Conditional Independence Networks
While there were evidently inconsistencies within each of the network methods, the most apparent discrepancies were between the methods; specifically, between the six networks that represented the patterns of conditional independence in the full data sets. For example, nearly half of the nodes (44%) were indicated as the most central by at least one centrality index across the six conditional independence networks. This reiterates the point that interpreting the most central node in a network as an urgent target for clinical intervention is likely to be a misguided use of time and resources. It also raises the question of how the centrality indices should be interpreted individually, given they are highly sensitive to small differences in the data, and appear to be measuring different constructs rather than converging on particularly important or influential nodes. Ultimately, it is not clear that betweenness or closeness mean anything in psychopathology research. We would suggest that the move towards relying on the strength family of node centrality indices alone (e.g., Boschloo et al., 2016b; Curtiss & Klemanski, 2016; Fried et al., 2016) is a good idea because these indices directly summarize the strength and/or number of bivariate associations for each node.
In addition to the evident discrepancies in the node centrality indices, there was also remarkably low convergence between the conditional independence networks in the estimation of edges. Take, for example, the popular axiom in network analysis “If one does not sleep, one will get tired eventually (insomnia➔fatigue)” (Borsboom et al., 2016, p. 9), which is often used as a self-evident example of symptom-to-symptom causality to justify the premise of network analysis (e.g., Borsboom & Cramer, 2013; Borsboom et al., 2011a; Borsboom et al., 2016; Cramer & Borsboom, 2015; McNally, 2016; McNally et al., 2014). Between the six full-sample conditional independence networks, there were 32 different edges where this relationship could manifest. It was absent in 78% of cases. In the 22% of cases where it was present, it was estimated in three different places (mSle—mFat, gSle—gFat, and gSle—mFat) across four of the networks, and characterized by a negative relationship in the NCS-R Ising model (gSle—mFat).
Overall, fewer than one in every seven of the edges (13%) were consistently estimated across the six conditional independence networks; this proportion rose to 16–21% comparing the networks within each sample. Even in the least restrictive comparison between conditional independence networks (i.e., comparing only the Ising model and the DAG within the NCS-R or NSMHWB data sets), less than half of the edges were present in both networks. The choice of network model may thus result in vastly different conclusions, which is inconsistent with the way these models tend to be discussed in the psychopathology network literature. These striking dissimilarities between the different types of network analysis underscore the importance of considering the statistical and theoretical underpinnings of each model.
Why Might Conditional Independence Networks have Such Poor Replicability?
The inconsistency within and between the conditional independence network analyses raises the question of why these methods—which are all intended to represent the causal skeleton of a network—give rise to inconsistent and unstable results. To start, we might consider the question: What are the networks representing, if not robust causal relationships among symptoms? Network analysis research often borrows heavily from the language of graph theory to discuss activation spreading through the networks, and nodes being turned on or turned off (e.g., McNally, 2016; McNally et al., 2014; van Borkulo et al., 2014a), but it is not clear what this means in the context of the cross-sectional relationships among symptoms of psychopathology. Ultimately the edges in the networks are visual representations of correlations (association networks), or the combined results of multiple multivariate regressions (Ising models, relative importance models), or the patterns of conditional probabilistic independence among the nodes (DAGs). Reminding ourselves of this reality highlights many of the stumbling blocks in applying network analysis to psychopathology data. Coming back to the statistical and theoretical foundations of network analysis can also offer some clues as to why the networks might be behaving unpredictably, as many of the underlying assumptions of the methods are not met in cross-sectional and observational symptom-level psychopathology data.
Violated Statistical Assumptions
By definition, cross-sectional and observational symptom-level psychopathology data do not have the necessary information to derive causal relationships, nor do they meet the required assumptions. For example, by relying on atemporal, unrandomized, non-experimental data, there is limited causal information in the data to start with (Dawid, 2008; Winer et al., 2016). We are also dealing with “noisy” dynamic systems where a single state (i.e., the presence of any given combination of symptoms) might lead to any number of future states, which further limits causal information (Markon & Jonas, 2016). Trying to draw either casual or directional inferences from cross-sectional data thus relies on strong and strict statistical assumptions (Dawid, 2008; Wiedermann & von Eye, 2015a, 2015b). Further, directionality of the edges in relative importance networks and DAGs cannot be established—not only because of the high likelihood of violating specific statistical assumptions, but because reversing the direction of an edge results in a model in the same equivalence class (i.e., with the same implied covariance matrix), which is typically indistinguishable on the basis of statistical evidence, including the size of the directed effects (Thoemmes, 2015). Most importantly, to avoid making misleading conclusions, there is a fundamental assumption that all nodes that may have a causal role are included in the network (i.e., every common cause that two or more variables share; Dawid, 2008; Glymour, 1997). In psychopathology research, it is unfortunately inevitable that there are external factors with direct and indirect effects on the nodes that have not been modelled (Borsboom, Epskamp, Kievit, Cramer & Schmittmann, 2011b; Young, 2015). Ultimately, psychopathology networks do not and cannot illuminate causal relationships among psychopathology symptoms in cross-sectional data.
Other key statistical pitfalls of psychopathology networks were described earlier: The influence of measurement error in conditional independence networks, the inherently exploratory nature of the methods, and the estimation of hundreds of parameters in most examples mean that the methods are inherently prone to overfitting the data, resulting in non-replicable solutions. Among the many parameters in each network model, it is easy to identify a few intuitive findings to bolster our confidence in their validity. However, there are no established guidelines with which to evaluate the models or interpret the parameters objectively. This introduces additional error and bias into the interpretation of the results, which is unavoidably tainted by confirmation bias (Diaconis, 1985). We recommend some changes for psychopathology network analysis shortly to address these limitations.
Violated Theoretical Assumptions
In addition to the statistical pitfalls of conditional independence networks, the utility of cross-sectional psychopathology networks fundamentally relies on the assumption of ergodicity: that the between-person structure at one time is the same as the within-person structure over time (Molenaar, 2004). In contrast with this assumption, the proponents of network analysis have suggested that psychopathology networks likely vary over time and individuals (e.g., Borsboom & Cramer, 2013; Borsboom et al., 2011b; Cramer & Borsboom, 2015; Cramer, Waldorp, van der Maas & Borsboom, 2010b; Rhemtulla et al., 2016). Consistent with these expectations, time series network analyses of depression symptoms differ from cross-sectional analyses (Bringmann, Lemmens, Huibers, Borsboom & Tuerlinckx, 2015; Fried et al., 2016), and individuals have been found to have highly distinct networks of associations among domains of psychopathology (Beltz, Wright, Sprague, & Molenaar, 2016; Wright, Beltz, Gates, Molenaar & Simms, 2015). These assumptions evidently require further investigation. However, if intraindividual networks do indeed “differ markedly in terms of their architecture” (Cramer & Borsboom, 2015, p. 5), and are expected to change over time (Cramer et al., 2010b), then it is likely that networks represent ungeneralizable and locally irrelevant constructs (Borsboom, Mellenbergh & van Heerden, 2003). In short, it is not clear how networks derived from between-subjects variation in observational data can have utility in identifying clinically useful information.
Redeeming the Utility of Psychopathology Networks
In the present study we have presented evidence that conditional independence psychopathology networks are unstable and lack replicability, likely due at least in part to the predominance of measurement error in the nodes. It is also evident that psychopathology networks based on cross-sectional observational symptom-level data are not appropriate for making causal inferences. Further, it seems likely that networks derived from between-subjects variation will not generalise to individuals, as discussed above. As such, it is unrealistic to expect that psychopathology networks can fulfil the optimistic expectations surrounding their utility. Specifically, the estimated edges and most central nodes in conditional independence networks are unlikely to represent important dynamic relationships among symptoms, paths to disorder onset and maintenance, or influential symptoms that should be the focus of future clinical interventions. As it stands, the unique utility of network analysis in cross-sectional psychopathology research thus seems limited to visualizing complex multivariate relationships in association networks (remembering not to interpret node placement, proximity, or closeness or betweenness centrality).
Recommendations to Improve Network Analysis
The flaws in the current applications of psychopathology networks do not detract from the attractive idea of analyzing symptom-level relationships that might allow us to carve psychopathology at finer joints, thereby deepening our understanding the dynamic mechanisms of disorder onset, maintenance, and treatment (Cramer et al., 2010a; Goekoop & Goekoop, 2014). As such, it is useful to consider how these methods could be improved to overcome some of the flaws in their current application. The minimum change that we would recommend for cross-sectional psychopathology network estimation would be to improve the measurement of symptoms, thus reducing the measurement error modeled in conditional independence networks. One road to this change would be to use multiple items to measure each symptom, and/or to use multiple methods, such as self-report, others’ reports, daily diaries, observation, or physiological measures (cf. Fried & Nesse, 2015). Analyzing broader constructs—such a symptom clusters (e.g., Anker et al., 2017)—versus single symptoms would also be amenable to this approach. Specifically, we would suggest—as others have (Eaton, 2015; Epskamp et al., in press; Markus, 2010; Stapel, 2015; Young, 2015)—that integrating latent variables into network analysis is the best way forward. We echo the suggestions made by Epskamp et al. (in press), who recently proposed latent network modeling, in which latent variables are used to extract the most reliable variance from multiple measures of a symptom, and these latent variables subsequently act as the nodes in a network analysis. This method helps to ensure that the conditional independence networks are modeling more true score, rather than error, although it is noteworthy that latent variable models also face challenges inherent in the assessment of psychopathology (e.g., associations among multiple informants are often modest, and multiple ways to approach this issue have been suggested; Bauer et al., 2013; Funder & West, 1993). Taking a hypothesis-driven approach to controlling for the shared variance among symptoms (e.g., Anker et al., 2017) could also avoid the over-partialling of shared variance that currently weakens the replicability of the fully conditionally independent edges. However, it is important to note that even if these changes were made, the other limitations of network analysis will remain.
Other changes to strengthen not only the reliability but the validity of network analysis would include analyzing data that contains more causal information, such as data with temporal information (e.g., longitudinal or intensive time series data) and experimental or quasi-experimental data (e.g., randomized groups in treatment studies). These changes are routinely recommended in the network analysis literature (Borsboom & Cramer, 2013; Borsboom et al., 2016; Cramer & Borsboom, 2015; Cramer et al., 2010a; Rhemtulla et al., 2016), and would represent a necessary step for these models to live up to their promise. Researchers should also routinely examine the generalizability of findings from psychopathology networks, including the presence, strength and direction of specific edges and the centrality of individual nodes, by replicating them in multiple samples (cf. Klaiber, Epskamp & van der Maas; van Borkulo et al., 2014a). The replicability of networks could also be improved with the continued development of methods to establish confidence intervals for estimated parameters in the four main types of psychopathology networks (cf. Epskamp et al., under review-a).
Further, in contrast to Borsboom and Cramer’s (2013) suggestion that “the application of network models does not require extensive prior knowledge, as many other methodologies do” (p. 100), we emphasize that it is essential that researchers understand and carefully consider the assumptions that underlie these statistical methods. While estimating a network model in R is straightforward and the required code is freely available, the underlying statistics are complex. Researchers should be explicit about justifying and testing the underlying assumptions—including the assumptions for computing the foundational correlation matrices (cf. Cliff, 1996)—and be aware of how sensitive the models can be to violations of these assumptions (Dawid, 2008). Finally, researchers should consider alternative statistical models or methods that might be appropriate for their data, as there are many different statistical models that can fit any given data set, including multiple statistically equivalent models (Dawid, 2008; Epskamp et al., under review-b; Klaiber et al.; Markon & Jonas, 2016). In order for this to become common practice, it is important to continue to develop methods to rigorously evaluate and compare networks with one another, and with other methods.
Limitations of the Present Study
Much of the present discussion has been focused on the limitations of network analysis in general, as revealed by evidence of limited replicability and consideration of corresponding methodology. However, it is also important to note the specific limitations of the present study as an examination of replicability in network analysis. The primary limitation was that we could not find established methods for comparing the variety of characteristics of interest in psychopathology networks. We were consequently guided by our review of the literature to identify the focal characteristics of psychopathology networks and to determine reasonable ways to compare these characteristics with varying levels of sensitivity to change. Further, our analyses were based on networks of eighteen dichotomous nodes, so we cannot be sure that these findings will generalize to smaller or larger networks, or to other scales of measurement. Similarly, our analyses were based on comparing two samples, and multiple sets of random split-halves within those samples. Other comparisons are possible (e.g., testing generalizability between samples matched and/or differentiated by specific characteristics; quantifying stability in samples with substantial overlap) and we encourage ongoing efforts to evaluate the replicability of network models across other types of sample comparisons. It is also important to note that our discussion emphasized the weaknesses of psychopathology networks, with relatively little emphasis on the examples of replication in the networks. However, the design of the present study was engineered to maximize the replicability of the networks, and the examples of failures to replicate that we elucidated in-text were consistent with the overall trends in the methods. Importantly, the patterns of instability and poor generalizability in the results were evident even in randomly split halves within the two epidemiological samples. We are therefore confident that the limitations of the present study did not compromise the validity of the results, particularly in the context of the extant literature, which shows that psychopathology networks vary based on the sample, item content, number of constructs included, and specific type of network analysis used.
Conclusion
We found psychopathology networks to have poor replicability between and within methods and samples. The more detailed aspects of the models were the least replicable, and this trend was particularly pronounced in the conditional independence networks. This poor replicability likely arises due to the violated statistical and theoretical assumptions that underlie the models, and highlights that these methods—as they are applied here—have limited utility. We look forward to developments in this area that involve building on the fundamentals of latent variable modeling, improving the measurement of key symptom constructs, and using designs that are suited to discerning potential fine-grained relationships among symptoms (cf. Epskamp et al., in press). Ultimately, we suggest that novel results originating from psychopathology networks should be held to higher standards of evidence before they are ready for dissemination or implementation in the field.
Supplementary Material
Figure S1. Uncensored relative importance networks with 306 edges. Note that many of the edges between the disorders are so small that it is difficult to see them. NCS-R = National Comorbidity Study – Replication; NSMHWB = National Survey of Mental Health and Wellbeing. See Table 1 for symptom abbreviations.
Figure S2. Directed acyclic graphs plotted using the Fruchterman and Reingold (1991) algorithm. NCS-R = National Comorbidity Study – Replication; NSMHWB = National Survey of Mental Health and Wellbeing. See Table 1 for symptom abbreviations.
General Scientific Summary.
A statistical method called network analysis is quickly gaining popularity for analyzing the relationships between symptoms of mental disorders. This study found that popular network analysis methods produce unreliable results, particularly for the symptom-level aspects of the models. We highlight the need to be particularly cautious in interpreting, disseminating, or implementing results that arise from psychopathology networks.
Acknowledgments
The first author would like to thank Justin Anker for the introduction to—and many discussions about—the world of network analysis. The authors would also like to thank the reviewers and Associate Editor for their suggestions to improve this paper.
Role of Funding Source: This research was supported in part by a National Institute of Drug Abuse (NIDA) training grant supporting the work of Miriam Forbes (T320A037183). Aidan Wright’s efforts were supported by the National Institute of Mental Health (L30 MH101760). The views contained are solely those of the authors and do not necessarily reflect those of the funding source.
The National Comorbidity Survey Replication was supported by the National Institute of Mental Health (NIMH; U01-MH60220) with supplemental support from the National Institute of Drug Abuse (NIDA), the Substance Abuse and Mental Health Services Administration (SAMHSA), the Robert Wood Johnson Foundation (RWJF; Grant 044708), and the John W. Alden Trust.
The National Survey of Mental Health and Wellbeing was funded by the Australian National Health Branch of the Commonwealth Department of Health and Aged Care, Under the National Mental Health Strategy. It was conducted by the Australian Bureau of Statistics.
Footnotes
Conflict of Interest: The authors declare that they have no conflict of interest
Author Note: A subset of the results in this manuscript were presented as a poster at the 2017 American Psychopathological Association meeting in New York, NY. The poster reported the replicability of the edges in the Ising networks (i.e., the proportion of edges that were replicated and that failed to replicate, as well as the change in replicated edge strength) between and within the two samples reported in the present study.
A two-factor (MDE and GAD) confirmatory factor analysis with all parameters constrained to be equal between the two samples also had excellent fit (CFI = .999, TLI = .999, RMSEA = .021; χ2diff (19) = 188.36, p < .0005).
We also completed the tutorial in Borsboom and Cramer (2013) with the aim of reproducing the original results based on GAD and MDE in NCS-R. We were able to reproduce the association network from the NCS-R data. However, we were not able to reproduce the DAG, as the PC algorithm in the R package PcAlg was order-dependent (i.e., influenced by the order in which variables were included in the analyses). The algorithm was updated in 2012 in the new pcalg package (Kalisch, Maechler, Colombo, Maathuis & Buehlmann, 2012) to allow for the computation of order-independent DAGs, and the old PcAlg package is no longer available for use. A DAG computed using a fully order-independent version of the PC algorithm in the NCS-R data reproduced only 8 of the 37 (21.6%) original paths.
This value was guided by the range of absolute differences between each pair of edges when at least one edge weight was greater than .05. In NCS-R, the range in the absolute values of the difference in edge weights in these pairs was .0001–.0618, with a median of .0062. In NSMHWB the range was .0001–.0659, with a median of .0057.
It was immediately evident that the placement of individual nodes and their proximity to one another was unreliable (i.e., differed substantially between networks and was not consistent with node centrality indices), so we did not interpret these features of the networks. This is revisited in the discussion.
The most central node was defined as the highest-ranking node for at least two of the three indices (cf. van Borkulo et al., 2014a).
Constraining the correlation matrices to be held equal between each pair of split-halves was consistent with near-perfect model fit in both samples. In NCS-R, all split-half pairs had CFIs and TLIs of 1.000 when constrained to be equal; RMSEA ranged from 0–.011 (all ps = 1.000); eight of the ten split-half pairs had non-significant chi-square difference tests, and two pairs had small but significant chi-square differences at p < .05; χ2range (171) = 145.45–267.49 (median = 165.12), prange = .000–.892 (median = .605). In NSMHWB, all split-halves had CFIs and TLIs of 1.000 when constrained to be equal; RMSEA ranged from 0–.005 (all ps = 1.000).; and none of the split-halves were significantly different: χ2range (171) = 148.94–192.18 (median = 156.84), prange = .128–.887 (median = .764).
Given the relative importance networks were highly censored based on arbitrary criteria, we also examined the consistency between the Ising models and the DAGs separately. Across the two samples, there were 90 edges estimated between these four networks, and 27 (30.0%) were estimated in all four. Within the NCS-R data, 41 (42.5%) of the edges were estimated in both the Ising model and the DAG; and within the NSMHWB data, 50 (41.7%) of the edges were estimated in both the Ising model and the DAG.
Nearly half (47.4%) of the bridging edges failed to replicate from NCS-R to NSMHWB, and a median of 56.9–69.2% of bridging edges failed to replicate in the split-half pairs.
All edges were estimated in the uncensored relative importance networks, which meant that 100% of the edges were replicated. The average difference in edge strength between NCS-R and NSMHWB networks was 23.1%; the most central nodes did not match; node centrality rank-order correlations were similar to the censored networks (τrange = .52–.87), but fewer individual nodes had matches in their centrality rank-orders (27.8–50.0%).
References
- American Psychiatric Association. Diagnostic and statistical manual of mental disorders, (5th ed.), International Version. Arlington, VA: American Psychiatric Publishing; 2013. [Google Scholar]
- Anker JJ, Forbes MK, Almquist ZW, Menk JS, Thuras P, Unruh AS, Kushner MG. A network approach to modeling comorbid internalizing and alcohol use disorders. Journal of Abnormal Psychology. 2017 doi: 10.1037/abn0000257. [DOI] [PMC free article] [PubMed] [Google Scholar]
- Anderson SF, Maxwell SE. There’s more than one way to conduct a replication study: Beyond statistical significance. Psychological Methods. 2016;21 doi: 10.1037/met0000051. [DOI] [PubMed] [Google Scholar]
- Australian Bureau of Statistics. National Survey of Mental Health and Wellbeing (2007) 2007 Expanded Confidentialised Unit Record File (CURF), CD-ROM. Findings based on use of ABS Microdata. [Google Scholar]
- Bauer DJ, Howard AL, Baldasaro RE, Curran PJ, Hussong AM, Chassin L, Zucker RA. A tri-factor model for integrating ratings across mulitple informants. Psychological Methods. 2013;18:475–493. doi: 10.1037/a0032475. [DOI] [PMC free article] [PubMed] [Google Scholar]
- Beard C, Millner AJ, Forgeard MJC, Fried EI, Hsu KJ, Treadway MT, Leonard CV, Kertz SJ, Bjorgvinsson T. Network analysis of depression and anxiety symptoms in a psychiatric sample. Psychological Medicine. 2016:1–11. doi: 10.1017/S0033291716002300. [DOI] [PMC free article] [PubMed] [Google Scholar]
- Beltz AM, Wright AGC, Sprague B, Molenaar PCM. Bridging the nomothetic and idiographic approaches to the analysis of clinical data. Assessment. 2016;23(4):447–458. doi: 10.1177/1073191116648209. [DOI] [PMC free article] [PubMed] [Google Scholar]
- Borgatti SP. Centrality and network flow. Social Networks. 2005;27:55–71. doi: 10.1016/j.socnet.2004.11.008. [DOI] [Google Scholar]
- Borsboom D, Cramer AO. Network analysis: An integrative approach to the structure of psychopathology. Annual Review of Clinical Psychology. 2013;9:91–121. doi: 10.1146/annurev-clinpsy-050212-185608. [DOI] [PubMed] [Google Scholar]
- Borsboom D, Cramer AO, Schmittmann VD, Epskamp S, Waldorp LJ. The small world of psychopathology. PLoS One. 2011a;6:e27407. doi: 10.1371/journal.pone.0027407. [DOI] [PMC free article] [PubMed] [Google Scholar]
- Borsboom D, Epskamp S, Kievit RA, Cramer AO, Schmittmann VD. Transdiagnostic networks: Commentary on Nolen-Hoeksema and Watkins (2011) Perspectives on Psychological Science. 2011b;6:610–614. doi: 10.1177/1745691611425012. [DOI] [PubMed] [Google Scholar]
- Borsboom D, Mellenbergh GJ, van Heerden J. The theoretical status of latent variables. Psychological Review. 2003;110:203–219. doi: 10.1037/0033-295X.110.2.203. [DOI] [PubMed] [Google Scholar]
- Borsboom D, Rhemtulla M, Cramer AO, van der Maas HL, Scheffer M, Dolan CV. Kinds versus continua: A review of psychometric approaches to uncover the structure of psychiatric constructs. Psychological Medicine. 2016;46:1567–1579. doi: 10.1017/s0033291715001944. [DOI] [PubMed] [Google Scholar]
- Boschloo L, Schoevers RA, van Borkulo CD, Borsboom D, Oldehinkel AJ. The network structure of psychopathology in a community sample of preadolescents. Journal of Abnormal Psychology. 2016a;125:599–606. doi: 10.1037/abn0000150. [DOI] [PubMed] [Google Scholar]
- Boschloo L, van Borkulo CD, Borsboom D, Schoevers RA. A prospective study on how symptoms in a network predict the onset of depression. Psychotherapy and Psychosomatics. 2016b;85:183–184. doi: 10.1159/000442001. [DOI] [PubMed] [Google Scholar]
- Boschloo L, van Borkulo CD, Rhemtulla M, Keyes KM, Borsboom D, Schoevers RA. The network structure of symptoms of the Diagnostic and Statistical Manual of Mental Disorders. PLoS One. 2015;10:e0137621. doi: 10.1371/journal.pone.0137621. [DOI] [PMC free article] [PubMed] [Google Scholar]
- Brandt MJ, Ijzerman H, Dijksterhuis A, Farach FJ, Geller J, Giner-Sorolla R, Grange JA, van’t Veer A. The replication recipe: What makes for a convincing replication? Journal of Experimental Social Psychology. 2014;50:217–224. doi: 10.106/j.jesp.2013.10.005. [DOI] [Google Scholar]
- Bringmann LF, Lemmens LH, Huibers MJ, Borsboom D, Tuerlinckx F. Revealing the dynamic network structure of the Beck Depression Inventory-II. Psychological Medicine. 2015;45:747–757. doi: 10.1017/s0033291714001809. [DOI] [PubMed] [Google Scholar]
- Bringmann LF, Vissers N, Wichers M, Geschwind N, Kuppens P, Peeters F, Tuerlinckx F. A network approach to psychopathology: New insights into clinical longitudinal data. PLoS One. 2013;8:e60188. doi: 10.1371/journal.pone.0060188. [DOI] [PMC free article] [PubMed] [Google Scholar]
- Chalak K, White H. Causality, conditional independence, and graphical separation in settable systems. Neural Computation. 2012;24:1611–1668. doi: 10.1162/NECO_a_00295. [DOI] [Google Scholar]
- Cliff N. Answering ordinal questions with ordinal data using ordinal statistics. Multivariate Behavioral Research. 1996;31:331–350. doi: 10.1207/s15327906mbr3103_4. [DOI] [PubMed] [Google Scholar]
- Costantini G, Epskamp S, Borsboom D, Perugini M, Mõttus R, Waldorp LJ, Cramer AO. State of the aRt personality research: A tutorial on network analysis of personality data in R. Journal of Research in Personality. 2015;54:13–29. http://dx.doi.org/10.1016/j.jrp.2014.07.003. [Google Scholar]
- Cramer AO, Borsboom D. Problems attract problems: A network perspective on mental disorders. In: Scott R, Kosslyn S, editors. Emerging Trends in the Social and Behavioral Sciences: An interdisciplinary, seachable, and linkable resource. New York: John Wiley & Sons, Inc; 2015. pp. 1–15. [Google Scholar]
- Cramer AO, Waldorp LJ, van der Maas HL, Borsboom D. Comorbidity: A network perspective. Behavioral and Brain Sciences. 2010a;33:137–150. doi: 10.1017/s0140525x09991567. [DOI] [PubMed] [Google Scholar]
- Cramer AO, Waldorp LJ, van der Maas HL, Borsboom D. Complex realities require complex theories: Refining and extending the network approach to mental disorders. Behavioral and Brain Sciences. 2010b;33:178–193. doi: 10.1017/S0140525X10000920. [DOI] [Google Scholar]
- Curtiss J, Klemanski DH. Taxonicity and network structure of generalized anxiety disorder and major depressive disorder: An admixture analysis and complex network analysis. Journal of Affective Disorders. 2016;199:99–105. doi: 10.1016/j.jad.2016.04.007. [DOI] [PubMed] [Google Scholar]
- Dawid AP. Beware of the DAG! JMLR: Workshop and conference proceedings. 2008;6:59–86. [Google Scholar]
- De Schryver M, Vindevogel S, Rasmussen AE, Cramer AO. Unpacking constructs: A network approach for studying war exposure, daily stressors and post-traumatic stress disorder. Frontiers in Psychology. 2015;6:1896. doi: 10.3389/fpsyg.2015.01896. [DOI] [PMC free article] [PubMed] [Google Scholar]
- Diaconis P. Theories of data analysis: From magical thinking through classical statistics. In: Hoaglin D, Mosteller F, Tukey J, editors. Exploring data tables, trends, and shapes. New York: Wiley; 1985. pp. 1–36. [Google Scholar]
- Eaton NR. Latent variable and network models of comorbidity: Toward an empirically derived nosology. Social Psychiatry and Psychiatric Epidemiology. 2015;50:845–849. doi: 10.1007/s00127-015-1012-7. [DOI] [PubMed] [Google Scholar]
- Epskamp S, Borsboom D, Fried EI. Estimating psychological networks and their stability: A tutorial paper. doi: 10.3758/s13428-017-0862-1. (under review-a) https://arxiv.org/abs/1604.08462. Retrieved from: https://arxiv.org/abs/1604.08462. [DOI] [PMC free article] [PubMed]
- Epskamp S, Cramer AO, Waldorp LJ, Schmittmann VD, Borsboom D. qgraph: Network Visualizations of Relationships in Psychometric Data. Journal of Statistical Software. 2012;48:1–18. [Google Scholar]
- Epskamp S, Kruis J, Marsman M. Estimating psychopathological networks: Be careful what you wish for. PLoS One. doi: 10.1371/journal.pone.0179891. (under review-b) Retrieved from https://arxiv.org/abs/1604.08045. [DOI] [PMC free article] [PubMed]
- Epskamp S, Rhemtulla M, Borsboom D. Generalized network psychometrics: Combining network and latent variable models. Psychometrika. doi: 10.1007/s11336-017-9557-x. (in press) Retrieved from http://arxiv.org/abs/1605.09288. [DOI] [PubMed]
- Fried EI, Bockting C, Arjadi R, Borsboom D, Amshoff M, Cramer AO, Stroebe M. From loss to loneliness: The relationship between bereavement and depressive symptoms. Journal of Abnormal Psychology. 2015;124:256–265. doi: 10.1037/abn0000028. [DOI] [PubMed] [Google Scholar]
- Fried EI, Epskamp S, Nesse RM, Tuerlinckx F, Borsboom D. What are ‘good’ depression symptoms? Comparing the centrality of DSM and non-DSM symptoms of depression in a network analysis. Journal of Affective Disorders. 2016;189:314–320. doi: 10.1016/j.jad.2015.09.005. [DOI] [PubMed] [Google Scholar]
- Fried EI, Nesse RM. Depression sum-scores don’t add up: Why analyzing specific depression symptoms is essential. BMC Medicine. 2015;13:1–11. doi: 10.1186/s12916-015-0325-4. [DOI] [PMC free article] [PubMed] [Google Scholar]
- Fried EI, van Borkulo CD, Cramer AOJ, Boschloo L, Schoevers RA, Borsboom D. Mental disorders as networks of problems: A review of recent insights. doi: 10.17605/OSF.IO/6N8CG. (under review) [DOI] [PMC free article] [PubMed] [Google Scholar]
- Friedman J, Hastie T, Tibshirani R. Sparse inverse covariance estimation with the graphical lasso. Biostatistics. 2008;9:432–441. doi: 10.1093/biostatistics/kxm045. [DOI] [PMC free article] [PubMed] [Google Scholar]
- Fruchterman TMJ, Reingold EM. Graph drawing by force-directed placement. Software: Practice and Experience. 1991;21:1129–1164. doi: 10.1002/spe.4380211102. [DOI] [Google Scholar]
- Funder DC, West SG. Consensus, self-other agreement, and accuracy in personality judgment: An introduction. Journal of Personality. 1993;61:457–476. doi: 10.1111/j.1467-6494.1993.tb00778.x. [DOI] [PubMed] [Google Scholar]
- Glymour C. A review of recent work on the foundations of causal inference. In: Kim VR, Turner SP, editors. Causality in Crisis. South Bend: University of Notre Dame Press; 1997. pp. 201–248. [Google Scholar]
- Goekoop R, Goekoop JG. A network view on psychiatric disorders: Network clusters of symptoms as elementary syndromes of psychopathology. PLoS One. 2014;9:e112734. doi: 10.1371/journal.pone.0112734. [DOI] [PMC free article] [PubMed] [Google Scholar]
- Grömping U. Relative importance for linear regression in R: The package relaimpo. Journal of Statistical Software. 2006;17:1–27. [Google Scholar]
- Handley TE, Inder KJ, Kelly BJ, Attia J, Lewin TJ, Fitzgerald MN, Kay-Lambkin FJ. You’ve got to have friends: The predictive value of social integration and support in suicidal ideation among rural communities. Social Psychiatry and Psychiatric Epidemiology. 2012;47(8):1281–1290. doi: 10.1007/s00127-011-0436-y. [DOI] [PubMed] [Google Scholar]
- Hoorelbeke K, Marchetti I, De Schryver M, Koster EH. The interplay between cognitive risk and resilience factors in remitted depression: A network analysis. Journal of Affective Disorders. 2016;195:96–104. doi: 10.1016/j.jad.2016.02.001. [DOI] [PubMed] [Google Scholar]
- Johnson JW, LeBreton JM. History and use of relative importance indices in organizational research. Organizational Research Methods. 2004;7:238–257. doi: 10.1177/1094428104266510. [DOI] [Google Scholar]
- Kalisch M, Maechler M, Colombo D, Maathuis MH, Buehlmann P. Causal inference using graphical models with the R package pcalg. Journal of Statistical Software. 2012;47:1–26. http://www.jstatsoft.org/v47/i11/ [Google Scholar]
- Kessler RC, Berglund P, Chiu WT, Demler O, Heeringa S, Hiripi E, Zheng H. The US National Comorbidity Survey Replication (NCS-R): Design and field procedures. International Journal of Methods in Psychiatric Research. 2004;13:69–92. doi: 10.1002/mpr.167. [DOI] [PMC free article] [PubMed] [Google Scholar]
- Kessler RC, Ustun TB. The World Mental Health (WMH) Survey Initiative Version of the World Health Organization (WHO) Composite International Diagnostic Interview (CIDI) International Journal of Methods in Psychiatric Research. 2004;13:93–121. doi: 10.1002/mpr.168. [DOI] [PMC free article] [PubMed] [Google Scholar]
- Klaiber J, Epskamp S, van der Maas HL. Estimating Ising models on complete and incomplete psychometric data. University of Amsterdam; Retrieved from http://dare.uva.nl/cgi/arno/show.cgi?fid=606567. [Google Scholar]
- Krueger RF, Deyoung CG, Markon KE. Toward scientifically useful quantitative models of psychopathology: The importance of a comparative approach. Behavioral and Brain Sciences. 2010;33:163–164. doi: 10.1017/s0140525x10000646. [DOI] [PubMed] [Google Scholar]
- Lauritzen SL. Graphical Models. New York: Clarendon Press; 1996. [Google Scholar]
- Lykken DT. Statistical significance in psychological research. Psychological Bulletin. 1968;70:151–159. doi: 10.1037/h0026141. [DOI] [PubMed] [Google Scholar]
- Markon KE, Jonas KG. Structure as cause and representation: Implications of descriptivist inference for structural modeling across multiple levels of analysis. Journal of Abnormal Psychology. 2016 doi: 10.1037/abn0000206. [DOI] [PubMed] [Google Scholar]
- Markus KA. Questions about networks, measurement, and causation. Behavioral and Brain Sciences. 2010;33:164–165. doi: 10.1017/s0140525x10000658. [DOI] [PubMed] [Google Scholar]
- McNally RJ. Can network analysis transform psychopathology? Behavior Research and Therapy. 2016 doi: 10.1016/j.brat.2016.06.006. [DOI] [PubMed] [Google Scholar]
- McNally RJ, Mair P, Mungo BL, Riemann BC. Co-morbid obsessive-compulsive disorder and depression: a Bayesian network approach. Psychological Medicine. 2017;47:1204–1214. doi: 10.1017/S0033291716003287. [DOI] [PubMed] [Google Scholar]
- McNally RJ, Robinaugh DJ, Wu GWY, Wang L, Deserno MK, Borsboom D. Mental disorders as causal systems: A network approach to posttraumatic stress disorder. Clinical Psychological Science. 2014 doi: 10.1177/2167702614553230. [DOI] [Google Scholar]
- Moffitt TE, Harrington H, Caspi A, Kim-Cohen J, Goldberg D, Gregory AM, Poulton R. Depression and generalized anxiety disorder: Cumulative and sequential comorbidity in a birth cohort followed prospectively to age 32 years. Archives of General Psychiatry. 2007;64(6):651–660. doi: 10.1001/archpsyc.64.6.651. [DOI] [PubMed] [Google Scholar]
- Molenaar PCM. A manifesto on psychology as idiographic science: Bringing the person back into scientific psychology, this time forever. Measurement. 2004;2:201–218. [Google Scholar]
- Muthén B, Asparouhov T. Bayesian structural equation modeling: A more flexible representation of substantive theory. Psychological Methods. 2012;17(3):313. doi: 10.1037/a0026802. [DOI] [PubMed] [Google Scholar]
- Open Science Collaboration. Estimating the reproducibility of psychological science. Science. 2015;349 doi: 10.1126/science.aac4716. [DOI] [Google Scholar]
- Pe ML, Kircanski K, Thompson RJ, Bringmann LF, Tuerlinckx F, Mestdagh M, Gotlib IH. Emotion-network density in major depressive disorder. Clinical Psychological Science. 2014 doi: 10.1177/2167702614540645. [DOI] [PMC free article] [PubMed] [Google Scholar]
- R Core Team. R: A language and environment for statistical computing. Vienna, Austria: R Foundation for Statistical Computing; 2013. Retrieved from http://www.R-project.org/ [Google Scholar]
- Rhemtulla M, Fried EI, Aggen SH, Tuerlinckx F, Kendler KS, Borsboom D. Network analysis of substance abuse and dependence symptoms. Drug and Alcohol Dependence. 2016;161:230–237. doi: 10.1016/j.drugalcdep.2016.02.005. [DOI] [PMC free article] [PubMed] [Google Scholar]
- Robinaugh DJ, LeBlanc NJ, Vuletich HA, McNally RJ. Network analysis of persistent complex bereavement disorder in conjugally bereaved adults. Journal of Abnormal Psychology. 2014;123:510–522. doi: 10.1037/abn0000002. [DOI] [PMC free article] [PubMed] [Google Scholar]
- Robinaugh DJ, Millner AJ, McNally RJ. Identifying highly influential nodes in the complicated grief network. Journal of Abnormal Psychology. 2016 doi: 10.1037/abn0000181. [DOI] [PMC free article] [PubMed] [Google Scholar]
- Schmittmann VD, Cramer AO, Waldorp LJ, Epskamp S, Kievit RA, Borsboom D. Deconstructing the construct: A network perspective on psychological phenomena. New Ideas in Psychology. 2013;31:43–53. doi: 10.1016/j.newideapsych.2011.02.007. [DOI] [Google Scholar]
- Scutari M. Learning Bayesian networks with the bnlearn R package. Journal of Statistical Software. 2010;35:1–22. http://www.jstatsoft.org/v35/i03/ [Google Scholar]
- Slade T, Johnston A, Oakley Browne MA, Andrews G, Whiteford H. 2007 National Survey of Mental Health and Wellbeing: Methods and key findings. Australian and New Zealand Journal of Psychiatry. 2009;43:594–605. doi: 10.1080/00048670902970882. [DOI] [PubMed] [Google Scholar]
- Stapel B. Research Masters in Psychology. Universiteit van Amsterdam; 2015. A hybrid application of structural equation modeling and network analysis. Retrieved from http://dare.uva.nl/cgi/arno/show.cgi?fid=611410. [Google Scholar]
- Tackett JL, Lilienfeld SO, Patrick CJ, Johnson SL, Krueger RF, Miller JD, Oltmanns TF, Shrout PE. It’s time to broaden the replicability conversation: Thoughts for and from clinical psychological science. Perspectives on Psychological Science. doi: 10.1177/1745691617690042. (in press) Retreived from: https://osf.io/preprints/psyarxiv/uwus7. [DOI] [PubMed]
- Thoemmes F. Reversing arrows in mediation models does not distinguish plausible models. Basic and Applied Social Psychology. 2015;37:226–234. doi: 10.1080/01973533.2015.1049351. [DOI] [Google Scholar]
- Tibshirani R. Regression shrinkage and selection via the lasso. Journal of the Royal Statistical Society, Series B (Methodological) 1996;58:267–288. [Google Scholar]
- van Borkulo CD, Borsboom D, Epskamp S, Blanken TF, Boschloo L, Schoevers RA, Waldorp LJ. A new method for constructing networks from binary data. Scientific Reports. 2014a;4:1–10. doi: 10.1038/srep05918. [DOI] [PMC free article] [PubMed] [Google Scholar]
- van Borkulo CD, Boschloo L, Borsboom D, Penninx BW, Waldorp LJ, Schoevers RA. Association of symptom network structure with the course of longitudinal depression. JAMA Psychiatry. 2015;72:1219–1226. doi: 10.1001/jamapsychiatry.2015.2079. [DOI] [PubMed] [Google Scholar]
- van Borkulo CD, Epskamp S, with contributions from Alexander Robitzsch IsingFit: Fitting Ising models using the eLasso method. 2014b Retrieved from https://CRAN.R-project.org/package=IsingFit.
- Wichers M, Groot PC. Critical slowing down as a personalized early warning signal for depression. Psychotherapy and Psychosomatics. 2016;85:114–116. doi: 10.1159/000441458. [DOI] [PubMed] [Google Scholar]
- Wiedermann W, von Eye A. Direction-dependence analysis: A confirmatory approach for testing directional theories. International Journal of Behavioral Development. 2015a;39:570–580. doi: 10.1177/0165025415582056. [DOI] [Google Scholar]
- Wiedermann W, von Eye A. Direction of effects in multiple linear regression models. Multivariate Behavioral Research. 2015b;50:23–40. doi: 10.1080/00273171.2014.958429. [DOI] [PubMed] [Google Scholar]
- Winer ES, Cervone D, Bryant J, McKinney C, Liu RT, Nadorff MR. Distinguishing Mediational Models and Analyses in Clinical Psychology: Atemporal Associations Do Not Imply Causation. Journal of Clinical Psychology. 2016 doi: 10.1002/jclp.22298. [DOI] [PubMed] [Google Scholar]
- Wright AGC, Beltz AM, Gates KM, Molenaar PC, Simms LJ. Examining the dynamic structure of daily internalizing and externalizing behavior at multiple levels of analysis. Frontiers in Psychology. 2015;6:1914. doi: 10.3389/fpsyg.2015.01914. [DOI] [PMC free article] [PubMed] [Google Scholar]
- Young G. Causality in psychiatry: A hybrid symptom network construct model. Frontiers in Psychiatry. 2015;6:164. doi: 10.3389/fpsyt.2015.00164. [DOI] [PMC free article] [PubMed] [Google Scholar]
Associated Data
This section collects any data citations, data availability statements, or supplementary materials included in this article.
Supplementary Materials
Figure S1. Uncensored relative importance networks with 306 edges. Note that many of the edges between the disorders are so small that it is difficult to see them. NCS-R = National Comorbidity Study – Replication; NSMHWB = National Survey of Mental Health and Wellbeing. See Table 1 for symptom abbreviations.
Figure S2. Directed acyclic graphs plotted using the Fruchterman and Reingold (1991) algorithm. NCS-R = National Comorbidity Study – Replication; NSMHWB = National Survey of Mental Health and Wellbeing. See Table 1 for symptom abbreviations.