Abstract
This study develops a fully automated lightning jump system encompassing objective storm tracking, Geostationary Lightning Mapper proxy data, and the lightning jump algorithm (LJA), which are important elements in the transition of the LJA concept from a research to an operational based algorithm. Storm cluster tracking is based on a product created from the combination of a radar parameter (vertically integrated liquid, VIL), and lightning information (flash rate density). Evaluations showed that the spatial scale of tracked features or storm clusters had a large impact on the lightning jump system performance, where increasing spatial scale size resulted in decreased dynamic range of the system’s performance. This framework will also serve as a means to refine the LJA itself to enhance its operational applicability. Parameters within the system are isolated and the system’s performance is evaluated with adjustments to parameter sensitivity. The system’s performance is evaluated using the probability of detection (POD) and false alarm ratio (FAR) statistics. Of the algorithm parameters tested, sigma-level (metric of lightning jump strength) and flash rate threshold influenced the system’s performance the most. Finally, verification methodologies are investigated. It is discovered that minor changes in verification methodology can dramatically impact the evaluation of the lightning jump system.
1. Introduction
Previous research has shown that rapid increases in lightning activity are highly correlated to the occurrence of severe weather using lightning data from available three-dimensional lightning networks throughout the United States. Analysis by Williams et al. (1999), Schultz et al. (2009), and Gatlin and Goodman (2010) demonstrate the correlation between rapid increases in total flash rate (i.e., “lightning jumps”) and severe weather occurrence. Furthermore, recent studies (Schultz et al. 2009, Gatlin and Goodman 2010, Schultz et al. 2011) have quantified the lightning jump based on statistical performance metrics including probability of detection (POD) and false alarm ratio (FAR). Schultz et al. (2009, 2011) presented strong performance results (79% POD, 36% FAR) using total lightning from lightning mapping arrays (LMAs) to aid in the prediction of severe and hazardous weather using an objective lightning jump algorithm (LJA) with semi-automated tracking on a large number of storms. Schultz et al. (2009) developed and tested 4 different LJA configurations and determined that the 2σ algorithm (sigma-level of 2; see Schultz et al. 2011 section 2c) had the best skill in nowcasting severe weather potential.
However, Schultz et al. (2009, 2011) and others lack full automation and semi-objective tracking techniques that are needed for operational usage of the LJA. In addition, these previous studies have not taken advantage of adding satellite based products to that of commonly used radar based products. Rudlosky and Fuelberg (2013) used objective tracking techniques, but also lacked full automation. Chronis et al. (2015) also used objective and automatic tracking techniques to understand how performance metrics for the lightning jump change using real-time datasets. However, all of these studies arrived at their conclusions from LMA datasets and did not account for or anticipate what the Geostationary Lightning Mapper (GLM) will observe once in orbit on the GOES-R satellite (Goodman et al. 2013). Proch (2010) is the only previous study to use the LMA derived GLM proxy data. He used storms from the Schultz et al. (2009) database to evaluate the LJA with GLM proxy data. His results showed a lower sigma-level and lower flash rate threshold might be needed to optimize the algorithm for severe weather detection with GLM proxy data. Therefore, the goal of this study is to develop a fully automated framework encompassing objective tracking, GLM proxy lightning data, and the LJA to build toward operational assessment of storm intensity in real-time. This framework will also serve as a means to refine the LJA itself to enhance its operational applicability. This paper will describe the methodology involved with establishing this fully automated system and discuss how adjustments to parameters within various parts of the system affect the overall performance. In section 2, we will describe the components of the lightning jump system and illustrate the automated, objective tracking methodology including how this differs from past research, which solely relied on radar information for tracking. The components of the LJA will be described including the parameters involved in sensitivity testing. Finally, verification methodology will be addressed as an additional method of assessing the system’s performance. Section 3 will examine the sensitivity tests performed and the influence individual and combined parameters had on the LJ system. Section 4 will summarize the key influences on the system’s performance and look forward to future research and considerations.
2. Data and methodology
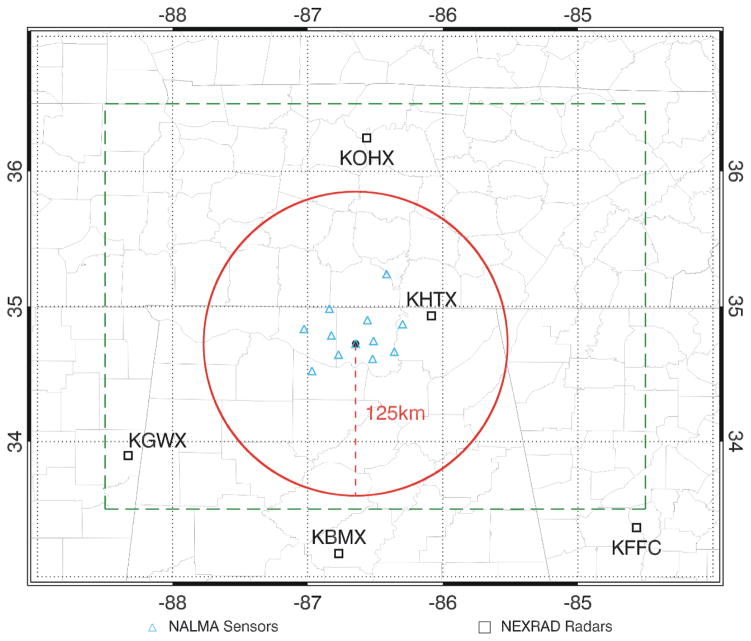
The lightning jump system consists of three components: radar and lightning data, thunderstorm tracking, and the LJA. Each component plays a vital role in the automation of the LJA towards operational use. The database for this study includes over 90 event days consisting of up to 10001 storm clusters between the years of 2002 and 2011 within 125 km range of the North Alabama Lightning Mapping Array (NALMA) network center (Fig. 1; Table 1). This dataset is a significant subset of the event days included in Schultz et al. (2011). Storm clusters are included in the database if they have a minimum lifetime of at least 30 minutes while the cluster is within 125 km of the center of NALMA. Only the portion of the cluster track that is within the domain is included in the dataset. Unlike previous studies that subjectively select storms on each event day to include in the database, this study includes all identified storms that meet the tracking criteria as identified by the tracking methodology discussed in section 2b.
Figure 1.
A diagram of the study’s domain and instrumentation locations. The large rectangle (green dot-dash lines) indicates the domain used in the WDSSII storm tracking algorithms. The red circle indicates the area within 125 km of the center of the NALMA. This is the area used for lightning jump system sensitivity testing and verification. The blue triangles represent NALMA sensors and the black boxes represented NEXRAD radar locations.
Table 1.
Comparison of the tunable parameters in the LJA, verification, and database used in Schultz et al. (2011) and this study.
| Tunable Parameter | Schultz et al. 2011 | This study |
|---|---|---|
| Sigma-level threshold (statistical jump threshold) | 2.0 | 0.75, 1.0, 1.25, 1.5, 1.75, 2.0, 2.25, 2.5 |
| Flash rate threshold Minimum flash rate (flashes min1) required to activate the algorithm |
10 | 1, 5, 10, 15, 20 |
| Algorithm spin-up Minimum time required to determine a jump |
14 minutes | 14 minutes |
| Storm report distance Additional distance from cell boundary |
0 (Only area within cell) | 5 km |
| Verification window Time following a jump |
45 minutes | 45 minutes |
| Domain range From NALMA center |
200 km (most within 150 km) | 125 km |
| Spatial scale Based on WDSSII tracking parameters |
60 km2 | See Table 2 |
a. Radar and lightning data
1) Radar
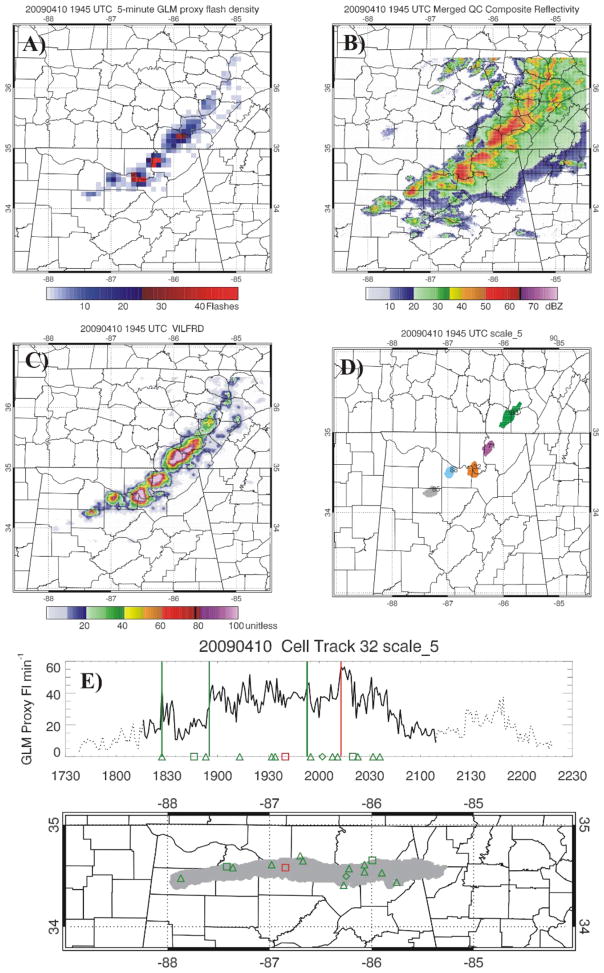
For each event day, NEXRAD Level II radar data for the five radars (KHTX, KGWX, KOHX, KFFC, KBMX) closest to the NALMA center are merged and gridded (0.009° x 0.009° x 1km resolution; Fig. 2b) using the Warning Decision Support System – integrated information (WDSSII; Lakshmanan et al., 2006, Lakshmanan et al., 2007). While previous studies have used reflectivity based thresholds for thunderstorm tracking (35 dBZ at −15°C, Schultz et al. 2009), this study uses vertically integrated liquid (VIL) in combination with lightning data. VIL is calculated from the merged and gridded radar data following the same methodology for single radar quality control and multi-radar blending as the national Multi-Radar Multi-Sensor (MRMS) system at the National Centers for Environmental Prediction (NCEP) and provided to the National Weather Service (NWS) in real-time (Smith et al. 2016).
Figure 2.
a) 5-min GLM proxy gridded flash density, b) merged composite reflectivity, c) VILFRD, and d) tracked storm clusters at scale 5 at 1945 UTC on 10 Apr 2009. e) Top panel: Lightning flash rate time series for cell 32 with the timing of lightning jumps depicted by green (hit) and red (false alarm) vertical lines, light gray flash rate (i.e., 1730–1815 and 2120–2230) depicts the time the cluster is outside of the 125 km LMA range. Bottom panel: Cluster footprint with storm reports (green = hit, red = miss) for the LJA from 1730–2230.
2) Lightning data: GLM proxy data
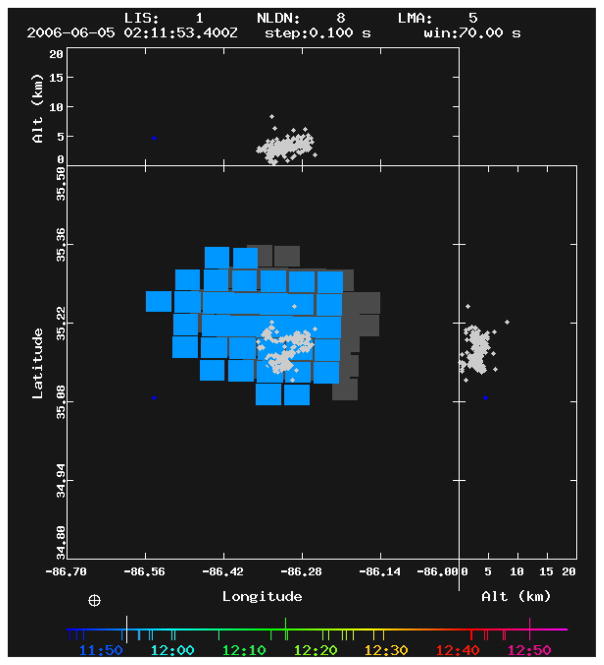
Previous implementations of the LJA involved ground-based datasets which use three-dimensional LMA data and have not included observations from a satellite based sensor. The challenge is that an optical lightning detection instrument does not currently exist at geostationary orbit. Furthermore, optical instruments like GLM observe a different component of lightning than the LMA (optical radiances at cloud top vs. VHF observations). This study uses GLM proxy data generated from NALMA data (Bateman 2013). The GLM proxy data converts NALMA flashes into what a “best guess” is that GLM will see when in orbit. The GLM proxy data set accomplishes this by using flash statistics collected from the space-borne Lightning Imager Sensor (LIS) onboard the Tropical Rainfall Measuring Mission (TRMM; Kummerow et al. 1998) and the NALMA (Bateman et al. 2008). Like the GLM, the LIS records optical events which are grouped into flashes (Mach et al. 2007), whereas the LMA detects VHF electromagnetic radiation sources which are combined into flashes using a separate clustering algorithm (McCaul et al. 2009). An example of a visual comparison for a flash between the LIS and LMA is shown in Fig. 3. Essentially, the GLM proxy flashes are transformed to match the lower spatial resolution of the GLM (compared with NALMA). This causes some “smearing out” and some merging of NALMA flashes but the overall flash rate is basically unchanged. The GLM proxy data algorithm creates “proxy pixels” and the flash-clustering software converts these into “proxy flashes”. Using this intercomparison methodology, the GLM proxy flashes are composed of merged LMA 15% of the time. In other words, there are roughly 15% fewer GLM proxy flashes than LMA flashes. Each GLM proxy flash location is determined by the amplitude-weighted centroid of the groups/events. GLM proxy flashes are gridded to a 0.08° × 0.08° grid which approximates GLM resolution and 1 and 5 minute flash count total grids (FLCT1 and FLCT5) are calculated each minute to produce flash rate density products (FRD).
Figure 3.
A comparison of the spatial differences of an example flash between an optical observation from the TRMM-LIS (blue/gray pixels) and the VHF radiation from the North Alabama LMA (gray source points) on 5 June 2006. Each LIS flash location is determined by the amplitude weighted centroid of the groups/events. The LMA flash consist of clustered radiation sources recorded at 80 μs intervals along the path of the flash.
3) VILFRD
This study extends beyond traditional utilization of radar parameters to track storm features and combines lightning data with VIL to compute a new trackable quantity. VIL and the 5-minute average GLM proxy FRD (FLCT5; Fig. 2a) products are combined to track storm clusters within the WDSSII framework. These products are combined as seen in Equation 1 to produce a new product, aptly named, VILFRD (Fig. 2c).
| (1) |
The VILFRD formula is subjectively determined in order to have a trackable product that relies more on radar-based information when flash rates are low and then transitions to more weight applied towards lightning information when flash rates are high. These two components inside the brackets each are limited to a maximum value of one resulting in maximum VILFRD values of 200. The maximum limits are set to treat anything larger than moderate VIL values (~45 kg m−2) the same as this indicates a strong thunderstorm. In addition, flash rates of 45 flashes min−1 or greater are also indicative of a strong thunderstorm. While an in-depth comparison between the two tracking methods mentioned (radar vs. radar and lightning) has not been completed with this dataset, initial observations place added value to the addition of lightning information compared to radar tracking alone as it increased the consistency of tracking a storm’s core and updraft region. This agrees with results from Meyer et al. (2013) which uses radar and lightning data to track storms. Lightning and lightning jumps are physically related to the storm’s updraft (e.g., Schultz et al. 2015) and thus the combination of radar and lightning information provides the tracking system a product that is weighted towards the most intense part of the storm cluster.
b. Thunderstorm tracking
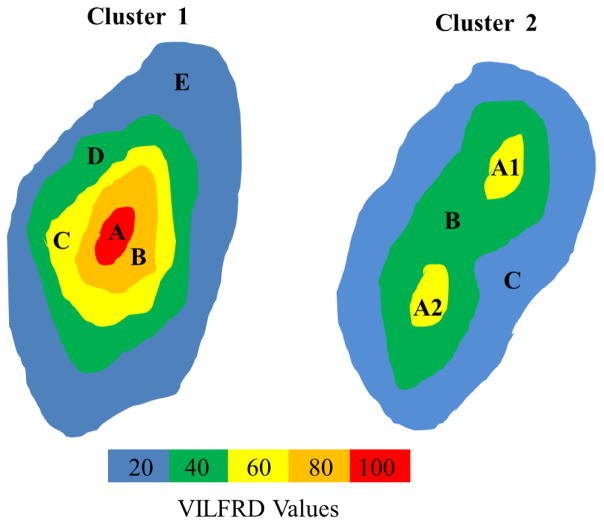
To compute lightning time histories for jump identification, it is necessary to utilize an automated, objective tracking scheme to assign lightning flashes to individual storms. VILFRD is tracked using K-means clustering in w2segmotionll in WDSSII (Lakshmanan et al. 2009). WDSSII w2segmotionll is used to track features where VILFRD values are ≥ 20, at increments of 20. Any pixel with a value greater than 100 is assigned the value of 100. Clusters are built outward from a local maximum until a minimum size or spatial scale threshold is met (Table 2) with a maximum overlap approach (combining cells within 5km of the cell boundary) for associating cells from one time step to the next. Cells are not included that are not tracked at each time step. The WDSSII tracking included 8 scales (scales 0 to 7) however, only scales 1 through 6 are included as scale 0 and scale 7 are unusable as the extremely small and large area parameters, respectively, failed to produce output for the vast majority of cases. The scales used are tracked at 40, 80, 120, 160, 200, and 300 pixels. The exact area scale thresholds in Table 2 account for the fact that a pixel is less than 1 km2. Figure 4 depicts two example clusters used to help describe this tracking method. VILFRD values are denoted by different colors. If VILFRD values ≥ 100 (red in Fig. 4) meet the required minimum area of a spatial scale threshold, a cluster is identified and the algorithm moves on to other clusters during that time step. If not, the algorithm reduces the VILFRD threshold to the value of 80 and searches for clusters that meet the minimum area of the spatial scale threshold. The VILFRD threshold continues to reduce in increments of 20 until it reaches a floor VILFRD value of 20. If the VILFRD feature footprint at the level of 20 does not reach the minimum area of a spatial scale threshold, no cluster is identified at the time and location. For example, a feature at scale 5, minimum required area is 162 km2 (Table 2), would be represented as the area included in D (VILFRD ≥40) in Cluster 1 and as area included in B (VILFRD ≥40) for Cluster 2.
Table 2.
Spatial scale levels with minimum area required to track storm clusters using WDSSII, and average storm track duration, length, and cluster size.
| Spatial Scale | ~Area (km2) | Track Duration (hrs) | Track Length (km) | Cluster Size (km2) |
|---|---|---|---|---|
| 1 | 32 | 1.003 | 42.57 | 122.77 |
| 2 | 65 | 1.032 | 44.80 | 175.57 |
| 3 | 97 | 1.028 | 44.89 | 224.91 |
| 4 | 130 | 1.046 | 46.55 | 270.32 |
| 5 | 162 | 1.039 | 47.15 | 318.23 |
| 6 | 243 | 1.042 | 48.55 | 443.37 |
Figure 4.
Schematic of two example storm clusters used to describe the VILFRD cluster identification and tracking process at multiple scales. Scale 1: Left – Cluster A (40 km2), Right – Cluster A1 (35 km2) Cluster A2 (38 km2). Scale 3: Left – Cluster B (100 km2). Scale 4: Left – Cluster C (150 km2). Scale 5: Left – Cluster D (200 km2), Right – Cluster B (200 km2). Scale 6: Left – Cluster E (300 km2), Right – Cluster C (300 km2).
The result of this iterative identification technique is that tracked clusters will differ in area and lifetime at each spatial scale. Each individual cluster is given a unique cluster identification number during its lifetime. Individual clusters at a select time are shown as an example in Fig. 2d. Outside of WDSSII, “broken tracks” are objectively merged if a WDSSII cell begins at t+1 within 15 km of where a previous track ended at time t. Time histories are tied together for merged cells.
c. Lightning Jump Algorithm
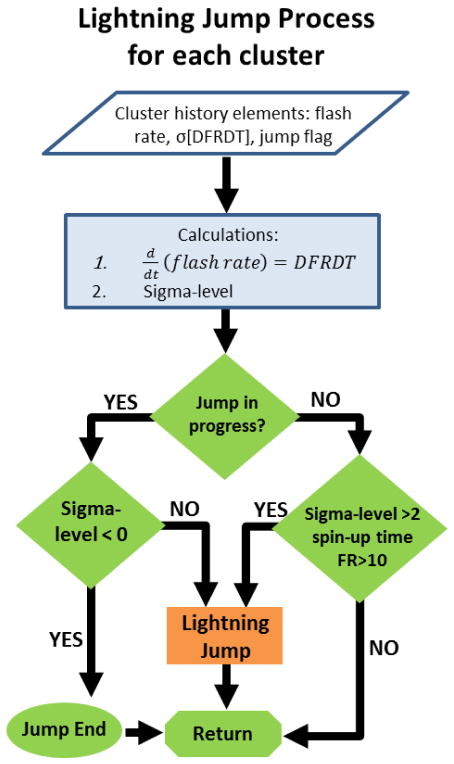
The LJA as defined by Schultz et al. (2009) laid the foundation for this study. In their studies, Schultz et al. (2009, 2011) objectively identified lightning jumps using the “2σ” algorithm. Figure 5 diagrams the flow chart depicting the following five steps describing the LJA process for the “2σ” threshold.
Figure 5.
Flowchart for the lightning jump classification process using the “2σ” algorithm from Schultz et al. (2009).
-
1)
The total lightning flash rate (as calculated from the 1 minute GLM proxy FRD) from the time period, t, is binned into 2 minute time periods and averaged.
-
2)
The time rate of change of the total flash rate (DFRDT) is calculated by subtracting consecutive bins from each other (i.e., bin2-bin1, bin3-bin2,… bint-bint-1). This results in DFRDT values with the units of flashes min−2.
-
3)
The standard deviation of the 5 previous DFRDT values is calculated. Twice this standard deviation value determines the level for the current DFRDT to exceed to be classified a jump in the “2σ”algorithm.
-
4)
Taking the ratio of the current DFRDT value to the standard deviation of the previous 5 time periods (Step 3) is further referred to as the sigma-level. Thus, a previously defined 2σ jump would have a sigma-level of 2. This presentation allows the end user to have the ability to understand how a current increase in the total flash rate compares to other recent increases in the storms total flash rate. For instance, a sigma-level of 8 would indicate a more rapid increase in the flash rate than a sigma-level increase of 2. This extra information directly corresponds to the kinematic and microphysical growth of the storm leading up to the time of the lightning jump and can aid in the forecaster’s warning decision making process (Schultz et al. 2015).
-
5)
In addition to reaching the required sigma-level to determine a jump, the following must also be met for the original approach to the algorithm: the minimum spin-up time of 14 minutes is reached (6 time periods to achieve 5 DFRDT values plus the current time period), the current flash rate exceeds the flash rate threshold of 10 flashes min−1, and the classification of an individual jump ends once the sigma-level drops below 0.
-
5)
This process is repeated every two minutes as new total lightning flash rates are collected until the storm dissipates. If a jump is currently in progress, the jump is continued until the sigma-level drops below 0. In the event multiple jumps occur within 6 minutes of each other, only the first jump remains for verification to follow the original Schultz et al. (2009) verification methodology (Table 3).
Table 3.
A comparison of verification methodologies between the method used in Schultz et al. (2009, 2011) and a method aligning with the National Weather Service.
| Verification Methodologies | Verification Schultz et al. 2009, 2011 | Alternative Verification (Based on NWS, NWS-HUN personal communication) |
|---|---|---|
| Storm report grouping | Yes (6 minutes) | No |
| 1 storm report verifies 2 overlapping forecasts | No (only first forecast, 1 hit) | Yes (1 hit) |
| Jump grouping | Yes (6 minutes) | Yes (6 minutes) |
| False alarm | No report during forecast OR For overlapping forecasts, no report in time period following first forecast expiration |
No report during forecast |
d. Parameter sensitivity testing
Seven parameters (Table 1) within the lightning jump system have been identified as having potential impact on the performance of the LJA. A range of values for sigma-level threshold, flash rate threshold, spin-up time, severe storm report distance, verification window, domain range, and spatial scale are used to determine which parameters the algorithm is the most sensitive to and what those values are. With the initial development of the LJA, Schultz et al. (2009) tested a 2σ and 3σ configuration of the LJA and determined that the 2σ version produced more optimal skill scores when the 10 flashes min−1 flash rate threshold is implemented. Based on the Schultz et al. (2009) findings, the 2σ configuration is tested further in Schultz et al. (2011). This study expands upon the LJA configuration results from Schultz et al. (2009, 2011) and further exploration by Chronis et al. (2015) through further sensitivity testing of the sigma-level threshold by varying the sigma-level from 0.75 to 2.5 in 0.25 increments (Table 1). Furthermore, a range of flash rate thresholds (1, 5, 10, 15, and 20) are tested in order to determine the algorithm sensitivity (Table 1). The minimum time required for the spin-up of the algorithm is 14 minutes (12 minutes to calculate the sigma-level, 2 additional minutes to determine if a lightning jump has occurred; Section 2c).
Tunable parameters that are investigated within the verification framework are severe storm report distance and verification window. Severe storm reports are obtained from NOAA’s National Climatic Data Center’s (NCDC) Storm Data and used as ground truth for validation. Storm Data has known temporal and spatial errors in reporting of events and known underreporting in data sparse regions (e.g., Witt et al. 1998, Williams et al. 1999, Trapp et al. 2006, and Chronis et al. 2015), so effort is taken to mitigate small timing and spatial errors that may exist in the database. This mitigation includes an additional “buffer” space around the footprint of a tracked storm cluster at each time step to assign reports to specific clusters. Storm report distance is defined as the maximum distance from the storm cluster’s footprint edge that a storm report can be associated with that storm. This distance is set to 5 km (Table 1). The verification window starts at the occurrence of a jump and lasts for 45 minutes (Table 1). Reports that occur within this verification window are used to verify the jump. For the results shown within, these parameters remained constant as initial sensitivity testing showed less impact to the overall system performance than other parameters.
Finally, two parameters are used to ensure quality and define the database. The domain range is limited to the areal coverage of the LMA network (Fig. 1). The closer the lightning activity is to the network, the higher the detection efficiency (Koshak et al. 2004). Therefore, extending the domain can decrease the detectable flashes and flash rates that can have an effect on the classification of jumps. A default distance is chosen as 125 km to remain in close proximity to the LMA network, which is used to statistically generate the GLM proxy data. Only portions of the storm life cycle (inclusion of entire storm’s footprint determined by the storm’s centroid location) occurring for at least 30 minutes within 125 km of the center of the LMA network are included in this study. The variance in spatial scale introduced in this study is a result of the options available in w2segmotionll in WDSSII to track features at different areal extents. Six different spatial scales (Table 2) are chosen ranging in sizes from that of small thunderstorms (scale 1 at 32 km2) to that of larger storm clusters (scale 6 at 243 km2). These values serve as the benchmark storm size for the sensitivity testing of the LJA.
e. Verification
The verification methodology initially applied in this study closely reflects the methodology outlined in Schultz et al. (2009). In order to evaluate the lightning jump system, severe storm reports are used as ground truth validation. As mentioned in Section 2d, there are caveats with using NCDC Storm Data. In an attempt to mitigate these effects, a temporal clustering of reports (same type) in 6 minutes bins is implemented. This binning begins at the time of the first report. Any report grouped into this bin counts as a single event and the time of the first report within the group is used for any calculations.
The window for jump verification is the time window (default length of 45 minutes; Table 1) starting at the time of the jump. However, in the method outlined by Schultz et al. (2009), only one jump can be evaluated at a given time. As mentioned in Section 2d, jumps are grouped if they occur within 6 minutes of each other (3 consecutive time periods). This leaves open the potential for additional jumps to occur within the verification window (after the 6 minute grouping) of a previous jump. In these cases, initial or “first” jumps and subsequent or “second” jumps are denoted as shown in Fig. 6. Each jump has a verification window equal to that of the verification window parameter, which is 45 minutes for this study. The first jump is verified and a “hit” (defined as the number of storm report groups within the verification window) if a storm report occurs during the verification window as denoted by the green vertical bar at approximately 10 minutes in Fig. 6. A second jump’s verification window, however, is limited to the time period remaining following the expiration of the first jump’s verification window. For example, if the second jump started 30 minutes after the first, its verification window would begin 15 minutes later (considering a 45 minute verification window) leaving a 30 minute verification window for the second jump. This can be visualized in Fig. 6. Despite what reports exist within the 15 minute overlap of the two jumps (minutes 30 to 45 or example report at approximately 40 minutes), the second jump is classified as a false alarm if no reports are present for the remaining 30 minutes (minutes 45 to 75). This methodology is applied for any additional jumps.
Figure 6.
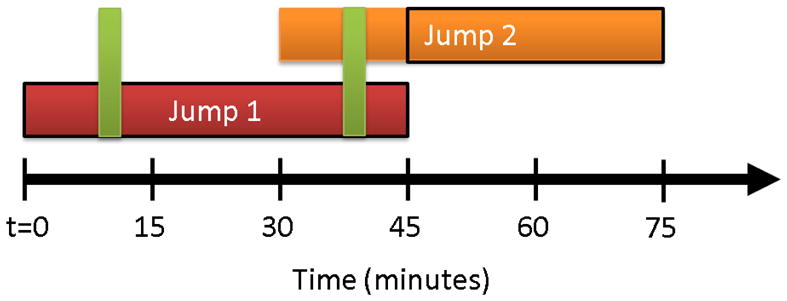
A schematic of respective verification windows for two lightning jumps (red and orange boxes). Following the verification methodology found in Schultz et al. (2009), only one jump can be verified at a given time with the given example storm reports (vertical green rectangles). Therefore, Jump 2 is not able to validate until after Jump 1’s verification period has ended. The black outlines indicate the valid time period for each jump.
In order to evaluate the algorithm, the skill scores of POD and FAR (Wilks 2011, 310–311) are calculated. In this process, a hit is defined as the grouped severe storm reports that occur during a verification window of a jump within the set bounds around a storm cluster (based on the radius from the edge of the cluster’s footprint). A miss is defined as a severe storm report group that occurs outside of a verification window. A false alarm is defined as a jump that is not followed by any severe storm reports within the associated verification window as well as the qualification involving subsequent jumps as described in the previous paragraph.
Verification methodology from Schultz et al. (2009, 2011) is not equivalent to that of the methodology employed by the National Weather Service (NWS) storm warning verification (NWS 2011). The main difference that exists between these two is the grouping of severe storm reports and the false alarm classification for subsequent jumps. A side by side comparison of these two methodologies can be seen in Table 3. Unlike Schultz et al. (2009), the NWS validates each warning separately even if they overlap. However, reports in the overlapping region only count as a single hit and not a hit for each warning. In an effort to more closely compare our results to the techniques used by the NWS, we included what we will call an alternative (in reference to Schultz et al. 2009) verification method. The discussion of our results will use both of these verification methods to evaluate the LJA algorithm and analyze sensitivity within the tunable parameters listed in Table 1.
3. Results
Numerous iterations of tunable parameter combinations (Table 1) are processed through the lightning jump system, analyzed, and evaluated using the skill score metrics of POD and FAR. The sensitivity analysis revealed the level of influence that individual parameters and parameter combinations have on the system performance. In addition, the verification methodology notably affected evaluation of the lightning jump system. The key results shown are the influence of spatial scale used in storm cluster tracking, the effect of sigma-level and the flash rate threshold on the LJA, and the impact verification methodology has on these results.
a. Spatial scale
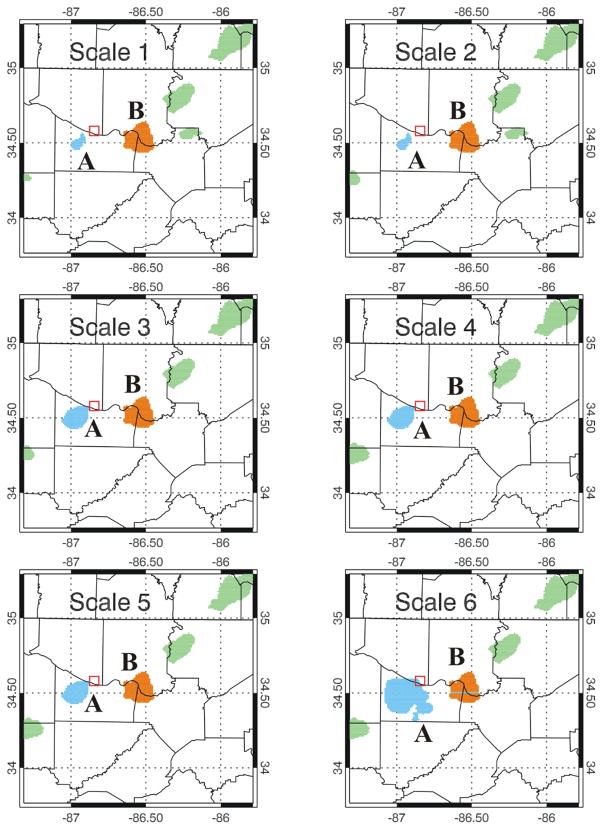
One component of the tracking methodology is choosing a representative storm scale size. However, storm size and appropriate scale size can greatly vary depending on storm mode. Scales ranging in areal size from scale 1 at 32 km2 to scale 6 at 243 km2 (Table 2) are tested. Figure 7 shows cluster footprints for all six scales discussed in this study at a given time (same date/time as Fig. 2). This figure depicts the similarities and differences inherent to the different tracking scales. Most notably different is cluster A on the left-hand side of the figures, which varies drastically in size from scale 1 to scale 6. Cluster B, remains the same size throughout the different scales. This consistent size is most likely due to a strong, active lightning core within this thunderstorm as can be noted by the influence of the lightning contribution to VILFRD as seen in Fig. 2a, b, and c.
Figure 7.
Cluster footprint comparisons for scale 1 (upper left) to scale 6 (lower right) at 1945 UTC on 10 Apr 2009, same time shown as Figure 2. Storm A is blue and the same as cluster 88 in Fig. 2d. Storm B is in orange and cluster 32 in Fig. 2d. Storm reports are plotted with the red square representing a missed wind report.
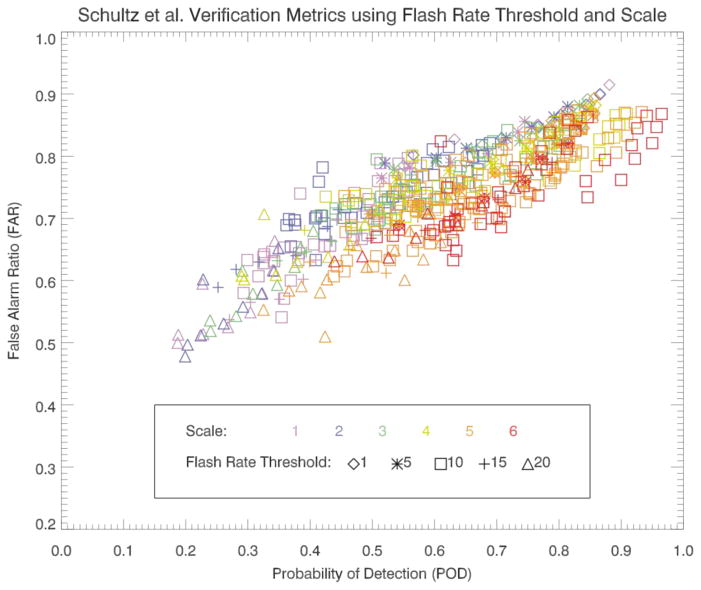
Figure 8 shows a color-coded comparison between the 6 different spatial scales that are used by WDSSII to track storm clusters. Each symbol represents one iteration of the algorithm for all event days for a given set of parameters. Larger spatial scales show increased POD values due mainly to the large areal extent of the storm clusters’ footprints. Quantitative evidence of this is shown in Tables 4 and 5. These larger areal extents allow for the inclusion of more lightning flashes and thus higher flash rates. Over 37 percent of time steps in the scale 6 database have flash rates over 20 flashes min−1. At the lower spatial scales, the flash rates often do not reach the minimum flash rate threshold (default of 10 flashes min−1). This is true for 87 percent of time steps for the entire scale 1 database. In contrast, only 22 percent of time steps at scale 6 have total flash rates below 10 flashes min−1. In scale 1, 4.5 percent of the database reaches a sigma-level of 2 but are not calculated as jumps because the flash rate is below 10 flashes min−1. Not meeting the minimum flash rate threshold prevents the LJA from activating and leads to any event occurring within the areal bounds set for that storm to be considered a miss. This causes both an increase in the number of misses and a decrease in the relative amount of hits as compared to larger scales and thus, leads to lower POD values in the smaller scales. POD values increase from a range of 0.19 to 0.88 at scale 1 to 0.44 to 0.97 at scale 6 (due to a variance of other parameters). The range of FAR values between scales shows less spread than POD. The range of values decreases with increasing spatial scales, from a range of 0.5 to 0.91 at scale 1 to 0.63 to 0.86 at scale 6.
Figure 8.
FAR vs. POD comparison of the 6 spatial scales (areal extent). Color represent the spatial scale at which storms are tracked and symbols represent flash rate thresholds for the Schultz et al. (2009) verification methodology. Each symbol represents one iteration of the algorithm for all event days for a set of given parameters.
Table 4.
Total scale attributes using the Schultz et al. verification and alternative verification methodologies.
| Scale | Clusters | Jumps | False Alarms | Hits | Misses | Alt. False Alarm | Alt. Hits |
|---|---|---|---|---|---|---|---|
| 1 | 1377 | 505 | 378 | 200 | 330 | 344 | 276 |
| 2 | 1121 | 724 | 567 | 233 | 311 | 519 | 323 |
| 3 | 978 | 949 | 760 | 274 | 259 | 705 | 279 |
| 4 | 842 | 1044 | 858 | 285 | 219 | 801 | 387 |
| 5 | 737 | 992 | 769 | 295 | 194 | 725 | 430 |
| 6 | 583 | 851 | 665 | 291 | 169 | 608 | 410 |
Table 5.
Normalized scale attributes by number of clusters using the Schultz et al. and alternative verification methodologies.
| Scale | Jumps | Hits | False Alarms | Misses | Verified Jumps | Alt. False Alarms | Alt. Hits |
|---|---|---|---|---|---|---|---|
| 1 | 0.37 | 0.15 | 0.27 | 0.24 | 0.09 | 0.25 | 0.20 |
| 2 | 0.65 | 0.21 | 0.51 | 0.28 | 0.14 | 0.46 | 0.29 |
| 3 | 0.97 | 0.28 | 0.78 | 0.26 | 0.19 | 0.72 | 0.29 |
| 4 | 1.24 | 0.34 | 1.02 | 0.26 | 0.22 | 0.95 | 0.46 |
| 5 | 1.35 | 0.40 | 1.04 | 0.26 | 0.30 | 0.98 | 0.58 |
| 6 | 1.46 | 0.50 | 1.14 | 0.29 | 0.32 | 1.04 | 0.70 |
During early investigation of the interplay between spatial scale and storm tracking, it is found that smaller scales are more ideal for isolated, small-scale thunderstorms as they are easier for the tracking algorithm to separate. Larger scales are more ideal for more complex and larger storms such as supercells. The larger scales are less likely to split apart a cluster that would naturally be considered as one entity although it may consist of multiple updrafts. In order to evaluate flash rate threshold and sigma-level, an optimal scale needs to be selected. Scale 5 (minimum areal size of 162 km2) is selected based on the balance of a high number of verified jumps per cluster (0.3, Table 5) with fewer missed events per cluster (0.26, Table 5). Scale 5 also balances the penalty of increasing FAR as it increases less than the POD increases with larger scales. While all scales 1 through 6 are explored in this research, scale 5 is fixed for analysis and comparisons shown here within.
b. Algorithm parameters: Flash rate threshold and sigma-level
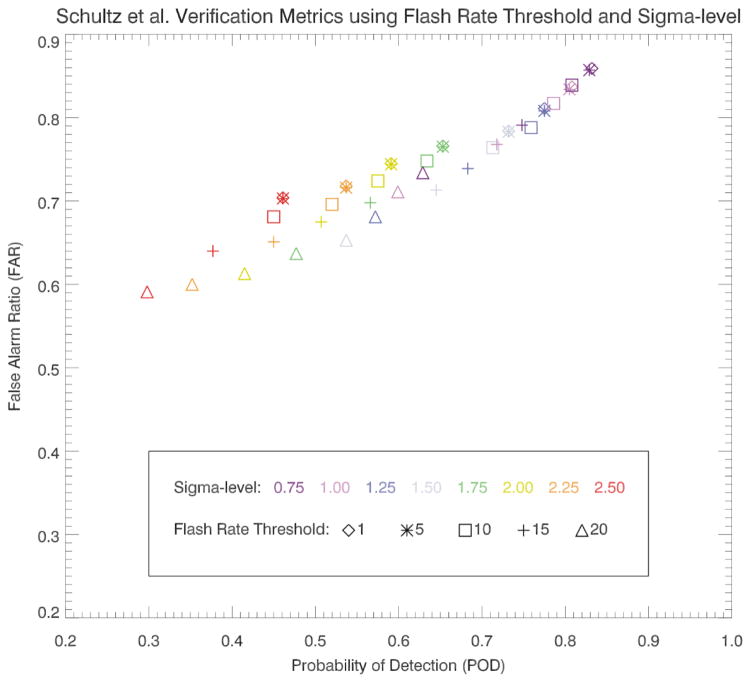
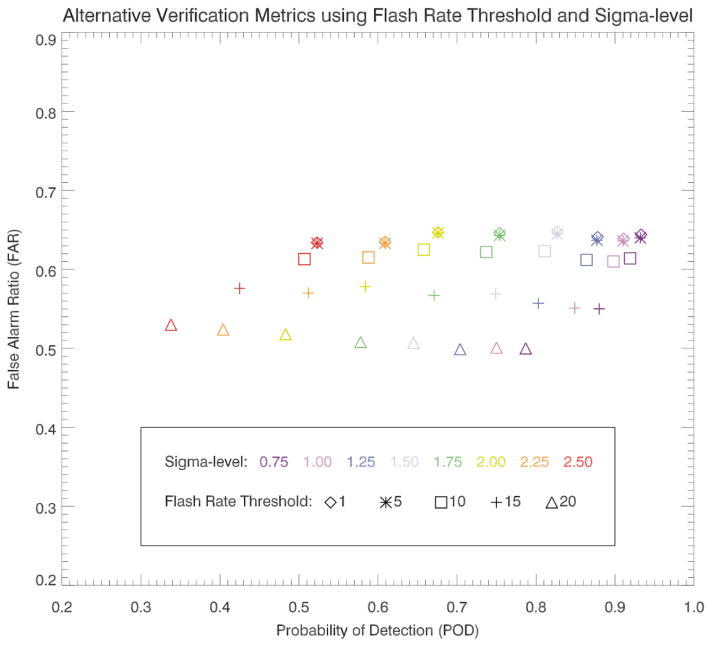
Compared to all the tunable parameters listed in Table 1, the combined effect of the flash rate threshold and sigma-level show the most promise in improving the LJA performance as evaluated by POD and FAR. The POD and FAR values for the sigma-level and flash rate thresholds for the Schultz et al. (2009) and alternative verification methods are shown in Figs. 9 and 10, respectively. The Schultz et al. (2009) verification methodology (Fig. 9) shows that decreasing sigma-level values (cooler colors) and lowering the flash rate threshold (symbols) results in the POD increasing slightly more than the increasing FAR. The POD and FAR are strongly coupled with a linear correlation coefficient of 0.95. In order to help break down the individual effects of sigma-level and flash rate towards POD and FAR, a linear regression model is applied at each constant sigma-level or flash rate. The trends of the slope of the linear regression models show that as the sigma-level decreases, the effect of flash rate become more pronounced (slope or rate of change of 0.88 at 2.5 sigma-level and 0.57 at 0.75 sigma-level). These slopes help reveal a smaller increase in FAR values with increasing POD values.
Figure 9.
FAR vs POD comparisons using the Schultz verification methodology showing the relationship of sigma-level (color) and flash rate threshold (symbols) on the algorithm’s performance at spatial scale 5. Flash rate threshold of 1 (diamond) and 5 (asterisk) flashes min−1 are very similar at each sigma-level and may be difficult to discern. A linear regression analysis (y=0.52x+0.40) for these data resulted in a strong correlation between POD and FAR (R2=0.95). A linear regression analysis while holding each sigma-level constant resulted in R2=0.99 and slopes ranging from 0.57 (at 0.75 sigma-level) to 0.88 (at 2.5 sigma-level).
Figure 10.
FAR vs POD comparisons using the alternative verification method showing the relationship of sigma-level (color) and flash rate threshold (symbols) on the algorithm’s performance at spatial scale 5. A linear regression analysis (y=0.16x+0.48) for these data resulted in almost no correlation between POD and FAR (R2=0.20). A linear regression analysis while holding each sigma-level constant resulted in correlation values above 0.9 (R2=0.93 to 0.99) and slopes ranging from 0.99 (at 0.75 sigma-level) to 0.59 (at 2.5 sigma-level).
The overall effect of sigma-level and flash rate threshold on the algorithm with the alternative verification (Fig. 10) shows a decoupled POD-FAR relationship (R2=0.20). This is noted by little change in the FAR and an increase in the POD with decreasing sigma-level values. In addition, decreasing the flash rate threshold leads to an increase in FAR and POD with FAR increasing at a slightly lower rate of change than the POD. The addition of more storms meeting the low flash rate requirements allow for jumps to be calculated (whereas the algorithm would not be initialized at higher flash rates) and more storm reports to be counted as potential hits. Linear regression analysis while holding the sigma-level constant reveals linear regression fits (or slopes) of 0.99 (at 0.75 sigma-level) to 0.59 (at 2.5 sigma-level). This quantifies the coupled effect flash rate threshold has on the POD-FAR relationship at low sigma-level values and the decoupling of this relationship with increasing values of the sigma-level. Thus, the sigma-level contributes to the overall decoupled POD-FAR relationship with the alternative verification.
c. Verification methodology
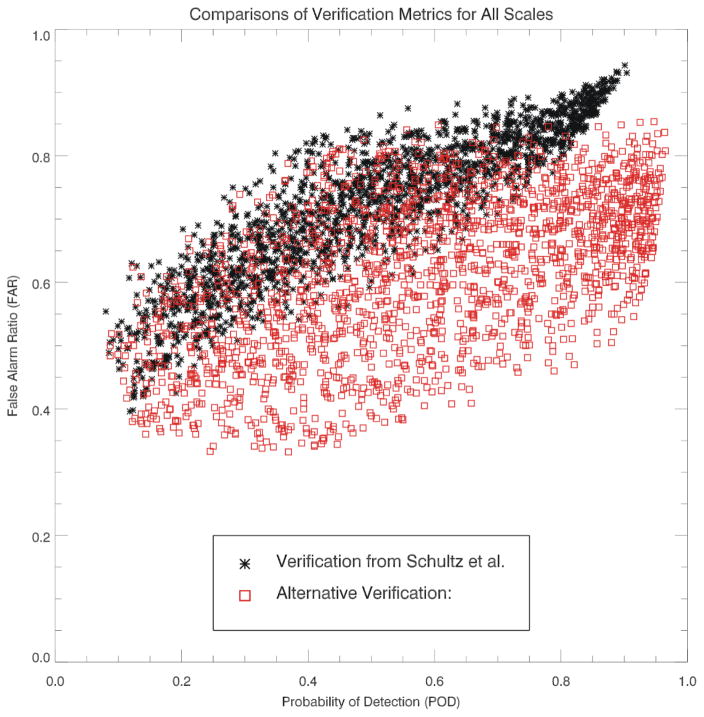
Two similar yet different verification methodologies are explored for this study. Figure 11 shows the spread of the verification methodology established in Schultz et al. (2009; black) and the alternative verification method (red) for all spatial scales. As mentioned, the Schultz et al. (2009) verification shows how closely coupled the relationship is between POD and FAR. The alternative method of verification shows improved performance of the LJA system on the order of reducing the FAR by 20% while maintaining a high POD. This is most likely due to the reduced amount of subsequent jumps classified as false alarms in Schultz et al.’s methodology (Table 4).
Figure 11.
A complete dataset distribution, from all ranges of sensitivity testing, showing for FAR vs POD comparisons of the differences between the verification Schultz et al. (2009; black) and alternative (red) verification methodologies.
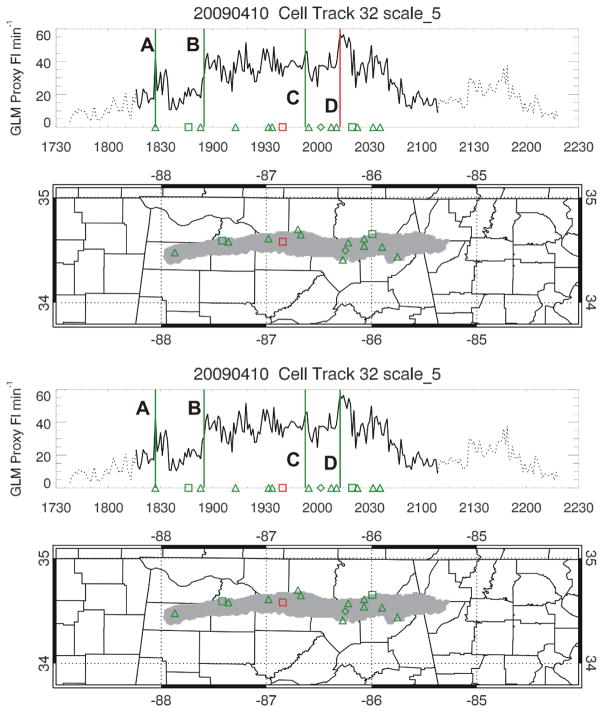
Figure 12 shows a comparison of the two methodologies for an individual cluster track. The difference comes in the classification of a jump that occurs during the verification window of a previous jump. The difference between the two methodologies is evident in the fourth jump or jump D. Under the methodology in Schultz et al. (2009), jump D is a false alarm because the severe events that follow jump D are also in the verification window of jump C. If an event is reported after the verification window of the previous jump then jump D would be a hit or verified jump in the Schultz et al. methodology. Jump D is a hit, or verified jump, in the alternative verification because that method removes the restriction of only allowing one jump to be verified at a given time. While false alarms and hits will be different between the two methodologies due to the reasons discussed above, the number of misses remain constant as no jumps are created or removed that could increase or reduce the number of misses.
Figure 12.
Similar to Fig. 2e except a comparison of verification methodology for a single example case. The top half of the figure shows Schultz et al. (2009) verification methodology and the bottom half shows the alternative verification methodology applied. The key difference is the classification of the fourth jump (jump D) as a false alarm in the top image and a hit in the bottom image.
4. Discussion and summary
Storm tracking is a challenging aspect of research at the storm scale. Previous tracking methodologies have involved radar reflectivity thresholds, radar reflectivity at specific temperature thresholds, satellite features, etc. This study has taken a new, unique approach and combined VIL and gridded lightning flash rate density to develop a trackable product. This product, VILFRD, helps track the portions of the storm where relevant ice production and lightning activity are occurring to focus on the intense portions of the storm. Most importantly, this method of utilizing lightning information in addition to radar derived parameters lays groundwork for future methods of tracking storms by lightning in the absence of radar information (e.g., over oceans, in terrain where radars encounter blockage). This type of tracking is potentially game changing from the perspective of GOES-R. With GOES-R, the community will have the ability for hemispheric tracking of storm systems with the added lightning capabilities of GLM, providing additional information on the intensity of storms not only over land, but also in data sparse regions.
One of the key points of this study is the testing of various spatial scales in storm tracking. Table 2 documents these various scales. As is noted, results differed based on spatial scale. A large part of this result is the inability for the lightning flash count within the smaller spatial scales to reach a minimum threshold. For some of the clusters in the smaller scales, the tracked feature is a more intense core within what is tracked as a larger multicell cluster at larger spatial scales. This is an advantage when trying to separate features to trackable sizes but a disadvantage when verification techniques are applied and smaller clusters perform poorly due to only covering a limited spatial area. There has been initial research and testing into combining different scales (Herzog et al. 2014).
Both sigma-level and flash rate play an important role in the lightning jump system’s ability to predict severe storms, especially based on the results shown for the Schultz et al. (2009, 2011) methodology. Recent work by Chronis et al. (2015) and Schultz et al. (2015) demonstrate both empirically and physically how these two parameters work in concert with each other and provide valuable information into the intensification of storms. The lightning jump provides lead time on the higher flash rates that are to come, and higher flash rates are physically and dynamically tied to the development and manifestation of severe weather at the surface. There are notable differences in skill scores between this study (~60% POD and ~73%) and Schultz et al. (2011; 79% POD and 35% FAR) despite using the same event days from the Tennessee Valley. The most obvious difference between the two studies is in the number of cluster/storms. The automated tracking employed in this study identified more storm clusters in the same event database at each spatial scale (Table 1) than the 555 storms identified in Schultz et al. (2011). Another key difference is the lightning data input. In general, the GLM proxy data has fewer number of flashes identified than the full LMA dataset used in Schultz et al. (2011). When the alternative methodology is applied, the sigma-level influences the performance of the algorithm to a larger extent than the flash rate threshold. Decreasing the sigma-level will increase the number of jumps and will increase the likelihood of event detection (increase in POD). In the alternative methodology, the algorithm is not penalized the same as the Schultz et al. methodology for repetitive or subsequent jumps that overlap with previous jump forecasts. Therefore, this increase in jumps does not increase FAR. In actuality, the FAR decreases with decreasing sigma-level because the added number of jumps associated with a lower sigma-level threshold are not penalized for overlapping.
For both verification methodologies, the increase of the flash rate threshold reduces the number of jumps. In turn, this change decreases FAR (jumps are not identified until they reach a higher flash rate) and POD because many severe events are counted as missed events due to no jump or forecast being issued. The change in FAR and POD are most notable at smaller spatial scales. Flash rate threshold changes, independent of sigma-level, weakly influences the skill score metrics more using the Schultz et al. verification methodology.
Finally, it is important to determine how this LJA system can be applied to real-time operations utilizing hemispheric lightning coverage with GOES-R GLM, as the launch of GOES-R approaches,. The LJA is shown to add value in the operational forecasting paradigm from a satellite, hemispheric perspective (e.g., Darden et al. 2010). Allowing forecasters the ability to evaluate the LJA through tracked clusters color-coded by sigma-level, as seen in the Hazardous Weather Testbed (HWT; Calhoun et al. 2014), also allows for individual assessment of the variations of sigma-level presented in this and other studies. Tracking methodologies also can greatly impact the usability of any algorithm including the LJA, as is shown by this study. This study has shown that the best results are achieved when there is balance between small and large feature tracking methods. Scale 5 (162 km2 or about 13 × 13 km cluster size) exhibited this balance and is just smaller than that used by the HWT tracking used for real-time lightning jump evaluation.
This work summarizes a technique that combines radar and lightning information to track thunderstorms to assess storm intensity for operational weather applications. Validation using Storm Data shows that key components of the algorithm (flash rate and sigma-level thresholds) have the greatest influence on the performance of the algorithm. The analysis of the lightning jump system using GLM proxy data has shown POD values around 60% with FAR around 73% using similar methodology to Schultz et al. (2011) which had a POD of 79% and a FAR of 36%. However, when applying verification methods similar to those employed by the National Weather Service, POD values increase slightly (69%, range of 35–95%) and FAR values decrease (63%, range of 48–66%). These results show the POD and FAR are highly correlated (R2=0.95) in the Schultz et al. verification but not in the alternative verification (R2=0.20). This evaluation also highlights the sensitivity of the algorithm’s evaluation based on verification methodologies involving storm reports.
Acknowledgments
This research has been supported by the GOES-R Risk Reduction Research (R3) program. In particular, the authors thank Dr. Steven Goodman, Senior (Chief) Scientist, GOES-R System Program, for his guidance and support throughout this effort.
Footnotes
The number of storm clusters is dependent upon the tracked feature size.
Contributor Information
ELISE V. SCHULTZ, University of Alabama in Huntsville, Huntsville, AL
CHRISTOPHER J. SCHULTZ, NASA/MSFC, Huntsville, AL
LAWRENCE D. CAREY, University of Alabama in Huntsville, Huntsville, AL
DANIEL J. CECIL, NASA/MSFC, Huntsville, AL
MONTE BATEMAN, USRA, Huntsville, AL.
References
- Bateman, Mach MD, McCaul EW, Bailey J, Christian HJ. A comparison of lightning flashes as observed by the lightning imaging sensor and the North Alabama lightning mapping array. Third Conf. on the Meteor. Appl. of Lightning Data; New Orleans, LA: Amer. Meteor. Soc; 2008. p. 8.6. [Google Scholar]
- Bateman M. A high-fidelity proxy dataset for the Geostationary Lightning Mapper (GLM). 6th Conf. on the Meteor Appl. of Lightning Data; Austin, TX: Amer. Meteor. Soc; 2013. p. 725. [Google Scholar]
- Calhoun KM, Smith TM, Kingfield DM, Gao J, Strensrud DJ. Forecaster use and evaluation of real-time 3DVAR analyses during severe thunderstorm and tornado warning operations in the Hazardous Weather Testbed. Wea Forecasting. 2014;29:601–613. [Google Scholar]
- Chronis T, Carey LD, Schultz CJ, Schultz EV, Calhoun KM, Goodman SJ. Exploring lightning jump characteristics. Wea Forecasting. 2015;30:23–37. [Google Scholar]
- Gatlin PN, Goodman SJ. A total lightning trending algorithm to identify severe thunderstorms. J Atmos Oceanic Technol. 2010;27:3–22. [Google Scholar]
- Goodman SJ, et al. The GOES-R Geostationary Lightning Mapper (GLM) Atmos Res. 2013;125–126:34–49. [Google Scholar]
- Herzog BS, Calhoun KM, MacGorman DR. Int’l Conf Atmos Electricity. Norman, OK: 2014. Total lightning information in a 5-year thunderstorm climatology. [Google Scholar]
- Koshak WJ, et al. North Alabama Lightning Mapping Array (LMA): VHF source retrieval algorithm and error analyses. J Atmos Oceanic Technol. 2004;21:543–558. [Google Scholar]
- Kummerow C, Barnes W, Kozu T, Shiue J, Simpson J. The Tropical Rainfall Measuring Mission (TRMM) sensor package. J Atmos Oceanic Technol. 1998;15:809–817. [Google Scholar]
- Lakshmanan V, Hondl K, Rabin R. An efficient, general-purpose technique for identifying storm cells in geospatial images. J Atmos Oceanic Technol. 2009;26:523–537. [Google Scholar]
- Lakshmanan V, Smith T, Hondl K, Stumpf GJ, Witt A. A real-time, three-dimensional, rapidly updating, heterogeneous radar merger technique for reflectivity, velocity, and derived products. Wea Forecasting. 2006;21:802–823. [Google Scholar]
- Lakshmanan V, Smith T, Stumpf G, Hondl K. The Warning Decision Support System – Integrated Information. Wea Forecasting. 2007;22:596–612. [Google Scholar]
- Mach DM, Christian HJ, Blakeslee RJ, Boccippio DJ, Goodman SJ, Boeck WL. Performance assessment of the Optical Transient Detector and Lightning Imaging Sensor. J Geophys Res. 2007;112:D09210. doi: 10.1029/2006JD007787. [DOI] [Google Scholar]
- McCaul EW, Goodman SJ, LaCasse KM, Cecil DJ. Forecasting lightning threat using cloud-resolving model simulations. Wea Forecasting. 2009;24:709–729. doi: 10.1175/2008WAF2222152.1. [DOI] [Google Scholar]
- Meyer VK, Holler H, Betz HD. Automated thunderstorm tracking: Utilization of three-dimensional lightning and radar data. Atmos Chem Phys. 2013;13:5137–5150. [Google Scholar]
- National Weather Service. Operations and Services Performance, NWSPD 10–16: Verification. 2011 http://www.nws.noaa.gov/directives/sym/pd01016001curr.pdf.
- Proch DA. MS Thesis. University of Alabama; Huntsville: 2010. Assessment of Lightning Jump Algorithm Using GOES-R GLM Proxy Data for Severe Weather Detection; p. 64. [Google Scholar]
- Rudlosky SD, Fuelberg HE. Documenting storm severity in the Mid-Atlantic region using lightning and radar information. Mon Wea Rev. 2013;141:3186–3202. doi: 10.1175/MWR-D-12-00287.1. [DOI] [Google Scholar]
- Schultz CJ, Carey LD, Schultz EV, Blakeslee RJ. Insight into the kinematic and microphysical processes that control lightning jumps. Wea Forecasting. 2015;30:1591–1621. [Google Scholar]
- Schultz CJ, Petersen WA, Carey LD. Preliminary development and evaluation of lightning jump algorithms for the real-time detection of severe weather. J Appl Meteor Climatol. 2009;48:2543–2563. [Google Scholar]
- Schultz CJ, Petersen WA, Carey LD. Lightning and severe weather: A comparison between total and cloud-to-ground lightning trends. Wea Forecasting. 2011;26:744–755. [Google Scholar]
- Smith TS, et al. Multi-Radar Multi-Sensor severe weather and aviation products: Initial Operating capabilities. Bull Amer Meteor Soc. 2016 doi: 10.175/BAMS-D-14-00173.1. Early Online Release. [DOI] [Google Scholar]
- Trapp RJ, Wheatly DM, Atkins NT, Przybylinkski RW, Wolf R. Buyer beware: Some words of caution on the use of severe wind reports in postevent assessment and research. Wea Forecasting. 2006;21:408–415. [Google Scholar]
- Wilks DS. Statistical Methods in the Atmospheric Sciences. 3. Academic Press; 2011. p. 676. [Google Scholar]
- Williams ER, et al. The behavior of total lightning activity in severe Florida thunderstorms. Atmos Res. 1999;51:245–265. [Google Scholar]
- Witt A, Eilts MD, Stumpf GJ, Johnson JT, Mitchell ED, Thomas KW. An enhanced hail detection algorithm for the WSR-88D. Wea Forecasting. 1998;13:286–303. [Google Scholar]


