Abstract
A recent revision of the NASA global ocean colour record shows changes in global ocean chlorophyll trends. This new 18-year time series now includes three global satellite sensors, the Sea-viewing Wide Field of view Sensor (SeaWiFS), Moderate Resolution Imaging Spectroradiometer (MODIS-Aqua), and Visible Infrared Imaging Radiometer Suite (VIIRS). The major changes are radiometric drift correction, a new algorithm for chlorophyll, and a new sensor VIIRS. The new satellite data record shows no significant trend in global annual median chlorophyll from 1998 to 2015, in contrast to a statistically significant negative trend from 1998 to 2012 in the previous version.
When revised satellite data are assimilated into a global ocean biogeochemical model, no trend is observed in global annual median chlorophyll. This is consistent with previous findings for the 1998–2012 time period using the previous processing version and only two sensors (SeaWiFS and MODIS). Detecting trends in ocean chlorophyll with satellites is sensitive to data processing options and radiometric drift correction. The assimilation of these data, however, reduces sensitivity to algorithms and radiometry, as well as the addition of a new sensor. This suggests the assimilation model has skill in detecting trends in global ocean colour.
Using the assimilation model, spatial distributions of significant trends for the 18-year record (1998–2015) show recent decadal changes. Most notable are the North and Equatorial Indian Oceans basins, which exhibit a striking decline in chlorophyll. It is exemplified by declines in diatoms and chlorophytes, which in the model are large and intermediate size phytoplankton. This decline is partially compensated by significant increases in cyanobacteria, which represent very small phytoplankton. This suggests the beginning of a shift in phytoplankton composition in these tropical and subtropical Indian basins.
1. Introduction
The global operational ocean colour time series is now over 18 years long, and has provided an unprecedented record of changes in the state of ocean biology. Starting in 1998 with the Sea-viewing Wide Field of view Sensor (SeaWiFS; launched in 1997), the series was followed by the Moderate Resolution Imaging Spectroradiometer (MODIS)-Aqua (launched in 2002) and then the Visible Infrared Imaging Radiometer Suite (VIIRS; launched in 2011). The mission series SeaWiFS-MODIS-VIIRS is designed for observational continuity, but detection of trends in ocean chlorophyll has been compounded by differences in mission and sensor design. Each has different band locations and widths, radiometric sensitivities and capabilities. These differences increase the difficulty of retrieving signals capable of detecting trends in a background of the relatively small changes seen in a limited time record. As more sensors are launched, reconciling differences in observations is compounded by the sheer number of issues that must be resolved.
Investigations into trends in global ocean chlorophyll from satellites have mostly focused on the first sensor in the series, SeaWiFS (Henson et al. 2010; Vantrepotte and Melin 2011; Siegel et al. 2013). Recently, Gregg and Rousseaux (2014) reported on global trends in the 15-year time series 1998–2012 using SeaWiFS and MODIS-Aqua. They found a statistically significant negative trend in global ocean chlorophyll using observations from the satellites. Differences between mission data sets were the likely source of the apparent decline, rather than natural variability. Using a global ocean coupled biogeochemical-circulation model and a chlorophyll-adjustment methodology along with data assimilation, they were able to reduce the global differences between the two sensors and provide a more consistent time series. This time series showed no significant change in the global chlorophyll trends from 1998 through 2012.
Here we compare global annual median chlorophyll data from three modern sensors, SeaWiFS, MODIS, and VIIRS, with the data assimilated into a global biogeochemical model. We also compare global trends from the most recent satellite version for 1998–2015 to the previous version for 1998–2012.
2. Methods
2.1. Satellite data changes
The most recent version of NASA ocean colour data products is R2014, which was completed in 2015. The previous version of MODIS was R2013.1 and for SeaWiFS R2010, named for the years in which the data processing was initiated.
The major changes in ocean colour satellite data processing since the R2013/R2010 versions are: 1) addition of data from a new sensor, VIIRS, 2) correction for radiometric drift of MODIS-Aqua data (Meister and Franz 2014), and 3) application of a new chlorophyll algorithm, the Ocean Colour Index (OCI; Hu, Lee, and Franz 2012). OCI is a mixture of the Chlorophyll Index approach (CI), which is a band-differencing algorithm, and the maximum band ratio chlorophyll algorithm (OCx, O’Reilly et al. 1998), which was the NASA standard prior to the revision. The CI component of the algorithm applies for chlorophyll values less than 0.15 mg m−3, and the new processing procedure switches to OCx above 0.2 mg m−3. Linear weighting connects these two concentration domains.
2.2. Global three-dimensional model
Global ocean dynamics are simulated by the NASA Ocean Biogeochemical Model (NOBM; Gregg and Casey 2007), which represents circulation/biogeochemical/radiative processes spanning latitudes 84°S to 72°N at 1.25° longitude by 2/3° latitude spatial resolution. It resolves only open (pelagic) ocean areas, where bottom depth greater than 200m. It contains four phytoplankton groups, diatoms, chlorophytes, cyanobacteria, and coccolithophores, to represent diversity in the global oceans. Total chlorophyll is the sum of the phytoplankton groups. We run the model 120 years under climatological atmospheric forcing and assimilation of climatological MODIS ocean chlorophyll data (Rousseaux and Gregg 2015). Then we run forward from September 1997 until 2015 using transient forcing, switching from SeaWiFS to MODIS in January 2003 and from MODIS to VIIRS in 2012.
2.3. Biases among satellite mission data sets
The revision of satellite ocean colour data products (R2014) available from NASA (Ocean Color Web, http://oceancolor.gsfc.nasa.gov/cms/reprocessing) shows improved mission-to-mission consistency. Global annual median chlorophyll differences for MODIS-SeaWiFS are <0.004 mg m−3 (2.4%) for the overlapping period 2003–2007 before SeaWiFS orbital drift became a significant issue. VIIRS-MODIS differences are 0.005 mg m−3 (3.4%) for the overlap in 2012, before radiometric issues on MODIS affected consistency. We suggest that 0.01 mg m−3 is a practical limit for satellite trend detection. In situ data sets of chlorophyll observations from 5 major international archives (see Acknowledgements) contain only 0.025% chlorophyll values less than 0.01 mg m−3 in 347,180 data records. In the southeast Pacific, where the lowest satellite chlorophyll values are found, reported in situ chlorophyll was 0.0195 mg m−3 (Morel et al. 2007) and 0.017 mg m−3 (Bricaud et al. 2010).
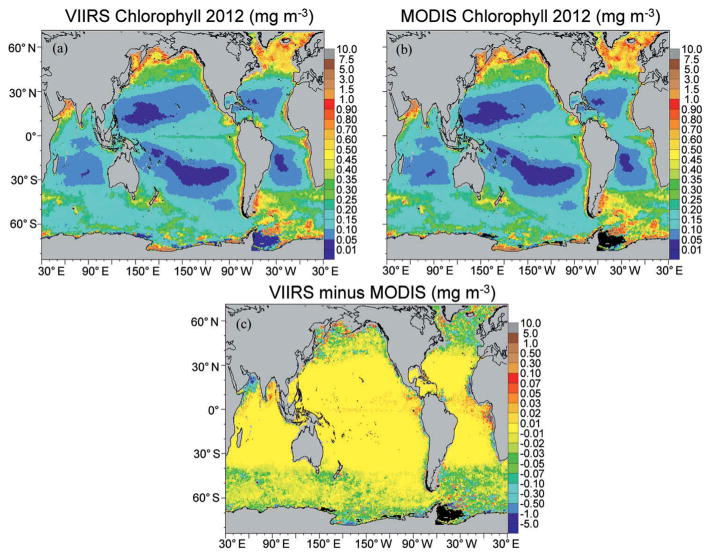
Regional and local differences, however, can be larger than this practical limit, especially in regions of higher chlorophyll concentrations (Figure 1) where the OCx component of the algorithm is applied. Although the CI component of the new algorithm exhibits less sensitivity to some biases, notably atmospheric correction errors (Hu, Lee, and Franz 2012), it is used only at lower chlorophyll concentrations.
Figure 1.
(a) VIIRS chlorophyll for 2012, (b) MODIS (top right), and (c) the difference (mg m-3).
Here we turn to the Empirical Satellite Radiance-In situ Data (ESRID) methodology (Gregg et al. 2009), which forces satellite radiances to agree with in situ data archives. It is updated using recent global in situ data archives (see Acknowledgements). ESRID is substituted for the OCx component of the standard algorithm for chlorophyll concentrations greater than 0.2 mg m−3.
There is insufficient in situ data in the major in situ archives to apply ESRID to VIIRS. Instead we utilize a modification where ESRID-MODIS retrieved chlorophyll is used instead of in situ data to derive empirical relationships with VIIRS satellite radiances. Called ESRIDS, with the second S for satellite, we find that a sixth-order polynomial provides the necessary consistency of VIIRS with MODIS needed here. We only use 2012 for the empirical characterization. ESRID and ESRIDS empirical coefficients are provided in the Appendix. As in Gregg and Rousseaux (2014), we remove all satellite chlorophyll where aerosol optical thickness at 660nm τa(660)>0.25 prior to data assimilation. In the Equatorial Atlantic the threshold is τa = 0.10.
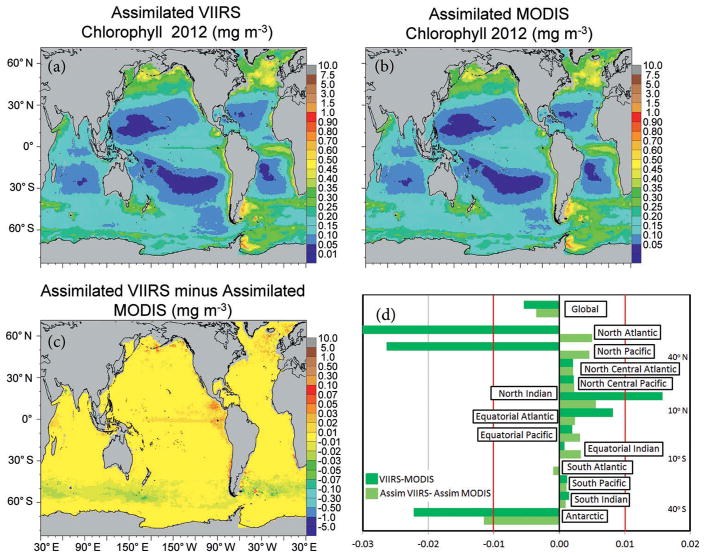
When we assimilate the OCI-ESRID(S) hybrid into the model, the consistency of regional chlorophyll between VIIRS and MODIS is improved (Figure 2). For the assimilated VIIRS-MODIS combination, all basins are now within the 0.01 mg m−3 chlorophyll threshold, with the minor exception of the Antarctic basin (Figure 2), where the basin difference is −0.0115 mg m−3.
Figure 2.
(a) Assimilated OCI-ESRID VIIRS chlorophyll for 2012, (b) Assimilated OCI-ESRID MODIS, (c) difference. (d) Assimilated and satellite differences for the 12 major oceanographic basins (mg m-3).
Unfortunately the northern high latitude basins, North Atlantic and North Pacific, still exhibit biases in the SeaWiFS-MODIS data assimilation combination. ESRID reduces the biases by about a fourth, but residuals are 0.0294 and 0.0311 mg m−3 (SeaWiFS higher), for the basins respectively. This exceeds the 0.01 mg m−3 threshold and is enough to produce a false negative trend in the 18-year time series for these basins. (This uncorrected bias also appears in Gregg and Rousseaux (2014) and thus trends reported there for these basins north of 40° latitude are erroneous. Global trends and other basins are not affected). This northern high latitude bias does not appear in the VIIRS-MODIS assimilation combination. The proximate causes are SeaWiFS low signal-to-noise ratio relative to MODIS, sampling (SeaWiFS is only 1/16th that of MODIS and VIIRS), and high solar zenith angles over a background of high chlorophyll, which reduces signal at the satellite.
To reduce residual inconsistencies between SeaWiFS and MODIS in the northern high latitudes, bias corrections are applied to SeaWiFS before data assimilation. These are: 1) reduce by 10% SeaWiFS observations north of 30°N, and 2) subtract 0.2 mg m−3 data in the far northeast North Atlantic, north of 65°N and east of 15°W. Additionally model weights for data assimilation (see Gregg 2008) in the northern basins are increased from 0.1 to 0.2 where monthly mean chlorophyll concentration (mchl)>0.5 mg m−3 and weight = 0.5 for mchl>0.75 mg m−3. Finally, the Sea of Okhotsk has sub-pixel-scale ice and clouds that adversely impact all the mission data. Here we assign model weights of 0.75 for mchl>0.2 mg m−3 and 0.9 for mchl>0.5 mg m−3 based on trial and error.
The assimilated OCI-ESRID hybrid with additional bias correction for SeaWiFS produces MODIS-SeaWiFS mission differences less than 0.01 mg m−3 (data not shown), which is the desired limit for our operational threshold. The limit is met in all 12 oceanographic basins.
2.4. Statistical treatment of trends
We derive trends using linear regression analysis on annual median chlorophyll data from the data assimilation, as in Gregg and Rousseaux (2014). A statistically significant trend exceeds the 95% confidence level. The time series is evaluated for autocorrelation and corrected for end-point bias.
3. Results and discussion
3.1. Changes in satellite and assimilation trends due to data set revision
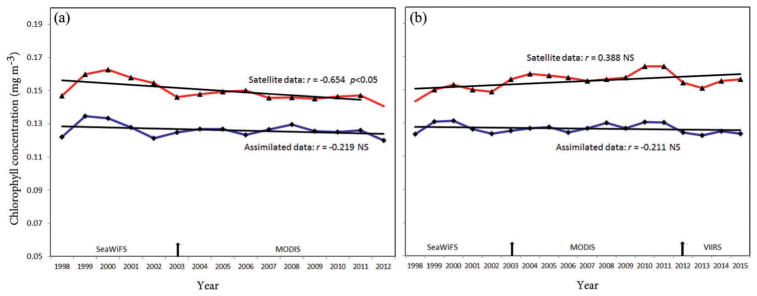
Multi-sensor trends for SeaWiFS-MODIS-VIIRS, with sensor switches in 2003 and 2012, show no significant trend in global ocean median chlorophyll (Figure 3). This is in contrast to the previous version, which showed a decreasing trend (p < 0.05). Assimilated global ocean chlorophyll trends are not significant in either the previous or most recent version, and the slope is similar (Figure 3b).
Figure 3.
Global annual median chlorophyll from 2013/2010 version processing (a) and 2015 revision (b). The more recent version includes 3 more years, for a time series record length of 18 years (1998–2015). Arrows indicate the year of switch in sensors for the time series. The missing markers for the satellite data trend in the earlier version (a) and the revision (b) indicate end-point bias removal. These are the lowest values in the respective time series. The trends are computed without these data, with associated reduction in degrees of freedom. r is the correlation coefficient, p is the probability, and NS indicates not statistically significant at p < 0.05.
The assimilated time series is less sensitive to the changes in chlorophyll algorithms and the addition of a new sensor (VIIRS) than the satellite data. This reduced sensitivity along with the consistency with past trends suggests stability in the assimilated record, which we believe enhances its skill for change detection in the global oceans. Thus, analysis of trends in the expanded 18-year time series 1998–2015 will use results from the assimilation model.
3.2. Chlorophyll trends 1998–2015 using assimilation model
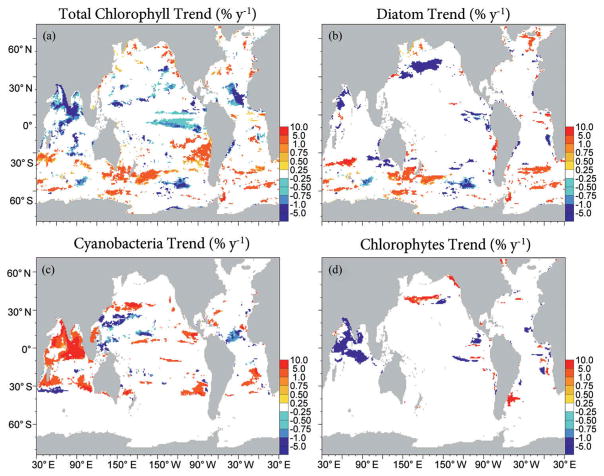
Trendmaps of annualmedian chlorophyll for the new assimilated satellite data record show major declines in the North and Equatorial Indian Oceans (Figure 4a) of −1.8% and −0.7% per year, respectively. This decline is reflected in diatom reductions near the Somalian coast (Figure 4b) and more widespread declines in chlorophytes (Figure 4c), which are intermediate phytoplankton between the large, fast-growing diatoms and the small, slow-growing cyanobacteria in the model. Cyanobacteria, in contrast, exhibit major widespread increases in the basins (Figure 4d). Declines in diatoms in recent decades have been reported here using in situ observations (Gomes et al. 2014), although they showed replacement by dinoflagellates. Our results also suggest changes in phytoplankton community structure, with the more nutrient-dependent diatoms and intermediate chlorophytes declining while smaller cyanobacteria, with lower nutrient requirements, are increasing. Whether this is part of a long term trend (Roxy et al. 2016) or a manifestation of the Indian Ocean Dipole (Currie et al. 2013) is not yet clear.
Figure 4.
Significant trends in a) total chlorophyll, b) diatoms, c) cyanobacteria, and d) chlorophytes over the period 1998–2015, using 3 ocean color satellites and an assimilation model (% y-1).
The eastern North Central Atlantic, offshore of Mauritania, also exhibits declines in total chlorophyll (Figure 4a). The region is dominated by cyanobacteria in the model, which also decline (Figure 4c). Agirbas et al. (2015) found no trend here for in situ chlorophyll from 2003–2010 and increasing trends in picoplankton, which correspond to our simulated cyanobacteria. This observation conflicts with our assimilation time series. When Agirbas et al. (2015) used a different phytoplankton algorithm (Uitz et al. 2006), they observed a decrease in small phytoplankton here, which supports our results.
There is evidence that the northeastern portion of the North Atlantic has experienced increasing chlorophyll (Raitsos et al. 2014). Rivero-Calle et al. (2015) also reported increasing trends of coccolithophore occurrence here. We observe significant increases of coccolithophores just west of the Bay of Biscay (data not shown), a region that overlaps much of the reported areas of increases. However, for most of the North Atlantic our results do not support observations of increasing chlorophyll. Our time record only partially overlaps with previous observations, suggesting that the results reported here may reflect a recent condition. There is conflicting evidence of diatoms trends. Hinder et al. (2012) reported increases relative to dinoflagellates, while Zhai et al. (2013) and Head and Pepin (2010) observed declines. The diatom decreases arise from the central-western portion of the basin, while the increasing abundance is mainly in the eastern portion. The results here largely disagree with respect to the central-western portion, but significant increases on the eastern side are supported in the assimilation model (Figure 4b).
The subpolar North Pacific exhibits contrasting trends for the 1998–2015 period. The northeastern portion exhibits significant increases, especially around the eastern periphery (Figure 4a). This is accompanied by increases in chlorophytes. This area is noteworthy for the warmwater anomaly (aka ‘the Blob’) that persisted from 2013 to 2016 (Cavole et al. 2016). Positive temperature anomalies (Cavole et al. 2016) are consistent with a shift from large phytoplankton represented by diatoms to intermediate phytoplankton such as chlorophytes.
The northern portion of the North Central Pacific shows strong declines in diatoms (Figure 4b), associated with increases in chlorophytes (Figure 4d), which are partially offset to the southwest. Farther south a patch of increasing cyanobacteria appears (Figure 4c). These results are consistent with increased temperatures and associated reduction in nutrients, possibly related to the Pacific Decadal Oscillation (McKibben et al. 2017).
Detection of trends in global ocean chlorophyll continues to be a challenge. New missions with new radiometric and sampling characteristics and radiometric drift on older missions are difficult issues that must be dealt with. This complicates the unequivocal separation between trends resulting from the sensors and trends that are occurring in nature. The assimilation of satellite data mitigates changes in sensors and radiometric drift, but it is still not insensitive. Nor should it be: corrections to errors in the data should have influence on the assimilation model. Assimilation is dependent on the quality of satellite data, but it brings its own information to the synthesis via dynamical response of global phytoplankton to transient forcing. The detection of trends may not be unambiguous using data assimilation, but the consistency across different satellite data versions is encouraging, and suggests a path forward for this important scientific objective.
Acknowledgments
We thank the NASA Ocean Color Processing Team for satellite data. We thank the SeaWiFS Bio-Optical Archive and Storage System, National Oceanographic Data Center, Atlantic Meridional Transect, Hawaii Ocean Time Series, and Biological and Chemical Oceanography Data Management Office for in situ data
Funding
This work was supported by NASA S-NPP, PACE, and MAP Programs. Assimilated data for the period 1998–2015 are available at the NASA Giovanni https://giovanni.gsfc.nasa.gov/giovanni and GMAO https://gmao.gsfc.nasa.gov/reanalysis/MERRA-NOBM/web sites.
Appendix Empirical coefficients for ESRID fourth-order polynomial used for SeaWiFS and MODIS, and ESRIDS sixth-order polynomial used for VIIRS
SeaWiFS and MODIS:
VIIRS:
chl = chlorophyll concentration (mg m−3)
R = maximum band ratio (O’Reilly et al. 1998)
| a0 | a1 | a2 | a3 | a4 | a5 | a6 | |
|---|---|---|---|---|---|---|---|
| SeaWiFS | 0.515 | −3.975 | 2.312 | 3.027 | −4.221 | Not used | Not used |
| MODIS | 0.288 | −3.150 | 1.994 | 0.778 | −2.142 | Not used | Not used |
| VIIRS | 0.335 | −3.165 | 2.842 | −0.660 | −7.293 | 13.878 | −8.265 |
References
- Agirbas E, Martinez-Vicente V, Brewin RJW, Racault M-J, Airs RL, Llewellyn CA. Temporal Changes in Total and Size-Fractioned Chlorophyll-A in Surface Waters of Three Provinces in the Atlantic Ocean (September to November) between 2003 and 2010. Journal of Marine Systems. 2015;150:56–65. doi: 10.1016/j.jmarsys.2015.05.008. [DOI] [Google Scholar]
- Bricaud A, Babin M, Claustre H, Ras J, Tièche F. Light Absorption Properties and Absorption Budget of Southeast Pacific Waters. Journal of Geophysical Research. 2010;115(C08009) doi: 10.1029/2009JC005517. [DOI] [Google Scholar]
- Cavole LM, Demko AM, Diner RE, Giddings A, Koester I, Pagniello CMLS, Paulsen M-L, et al. Biological Impacts of the 2013–2015 Warm-Water Anomaly in the Northeast Pacific: Winners, Losers, and the Future. Oceanography. 2016;29:273–285. doi: 10.5670/oceanog.2016.32. [DOI] [Google Scholar]
- Currie JC, Lengaigne M, Vialard J, Kaplan DM, Aumont O, Naqvi SWA, Maury O. Indian Ocean Dipole and El Niño/Southern Oscillation Impacts on Regional Chlorophyll Anomalies in the Indian Ocean. Biogeosciences. 2013;10:6677–6698. doi: 10.5194/bg-10-6677-2013. [DOI] [Google Scholar]
- Gomes HR, Goes JI, Matondkar SGP, Buskey EJ, Basu S, Parab S, Thoppil P. Massive Outbreaks of Noctiluca Scintillans Blooms in the Arabian Sea Due to Spread of Hypoxia. Nature Communications. 2014 doi: 10.1038/ncomms5862. [DOI] [PubMed] [Google Scholar]
- Gregg WW. Assimilation of SeaWiFS Ocean Chlorophyll Data into a Three-Dimensional Global Ocean Model. Journal of Marine Systems. 2008;69:205–225. doi: 10.1016/j.jmarsys.2006.02.015. [DOI] [Google Scholar]
- Gregg WW, Casey NW. Modeling Coccolithophores in the Global Oceans. Deep-Sea Research II. 2007;54:447–477. doi: 10.1016/j.dsr2.2006.12.007. [DOI] [Google Scholar]
- Gregg WW, Casey NW, O’Reilly JE, Esaias WE. An Empirical Approach to Ocean Color Data: Reducing Bias and the Need for Post-Launch Radiometric Re-Calibration. Remote Sensing of Environment. 2009;113:1598–1612. doi: 10.1016/j.rse.2009.03.005. [DOI] [Google Scholar]
- Gregg WW, Rousseaux CS. Decadal Trends in Global Pelagic Ocean Chlorophyll: A New Assessment Integrating Multiple Satellites, in Situ Data, and Models. Journal of Geophysical Research Oceans. 2014:119. doi: 10.1002/2014JC010158. [DOI] [PMC free article] [PubMed] [Google Scholar]
- Head E, Pepin P. Inter-Decadal Variability in Plankton Abundance and Composition in the Northwest Atlantic (1958–2006) Journal of Plankton Research. 2010;32:1633–1648. doi: 10.1093/plankt/fbq090. [DOI] [Google Scholar]
- Henson SA, Sarmiento JL, Dunne JP, Bopp L, Lima I, Doney SC, John J, Beaulieu C. Detection of Anthropogenic Climate Change in Satellite Records of Ocean Chlorophyll and Productivity. Biogeosciences. 2010;7:621–640. doi: 10.5194/bg-7-621-2010. [DOI] [Google Scholar]
- Hinder SL, Hays GC, Edwards M, Roberts EC, Walne AW, Gravenor MB. Changes in Marine Dinoflagellate and Diatom Abundance under Climate Change. Nature Climate Change. 2012;2:271–275. doi: 10.1038/nclimate1388. [DOI] [Google Scholar]
- Hu C, Lee Z, Franz B. Chlorophyll A Algorithms for Oligotrophic Oceans: A Novel Approach Based on Three-Band Reflectance Difference. Journal of Geophysical Research. 2012;117(C01011) doi: 10.1029/2011JC007395. [DOI] [Google Scholar]
- McKibben SM, Peterson W, Wood AM, Trainer VL, Matthew Hunter M, White AE. Climatic Regulation of the Neurotoxin Domoic Acid. Proceedings of the National Academy of Sciences. 2017;114:239–244. doi: 10.1073/pnas.1606798114. [DOI] [PMC free article] [PubMed] [Google Scholar]
- Meister G, Franz BA. Corrections to the MODIS Aqua Calibration Derived from MODIS Aqua Ocean Color Products. IEEE Transactions on Geoscience and Remote Sensing. 2014;52:6534–6541. doi: 10.1109/TGRS.2013.2297233. [DOI] [Google Scholar]
- Morel M, Gentili B, Claustre H, Babin M, Bricaud A, Ras J, Tièche F. Optical Properties of the “Clearest” Natural Waters. Limnology and Oceanography. 2007;52:217–229. doi: 10.4319/lo.2007.52.1.0217. [DOI] [Google Scholar]
- O’Reilly JE, Maritorena S, Mitchell BG, Siegel DA, Carder KL, Garver SA. Ocean Color Chlorophyll Algorithms for SeaWiFS. Journal of Geophysical Research. 1998;103:24937–24953. [Google Scholar]
- Raitsos DE, Pradhan Y, Lavender SJ, Hoteit I, McQuatters-Gollop A, Reid PC, Richardson AJ. From Silk to Satellite. Half a Century of Ocean Colour Anomalies in the Northeast Atlantic. Global Change Biology. 2014;20:2117–2123. doi: 10.1111/gcb.12457. [DOI] [PubMed] [Google Scholar]
- Rivero-Calle S, Gnanadesikan A, Del Castillo CE, Balch W, Guikema SD. Multidecadal Increase in North Atlantic Coccolithophores and the Potential Role of Rising CO2. Science Express. 2015 doi: 10.1126/science.aaa8026. [DOI] [PubMed] [Google Scholar]
- Rousseaux CS, Gregg WW. Recent Decadal Trends in Global Phytoplankton Composition. Global Biogeochemical Cycles. 2015;29:1674–1688. doi: 10.1002/2015GB005139. [DOI] [Google Scholar]
- Roxy MK, Modi A, Murtugudde R, Valsala V, Panickal S, Kumar SP, Ravichandran M, Vichi M, Lévy M. A Reduction in Marine Primary Productivity Driven by Rapid Warming over the Tropical Indian Ocean. Geophysical Research Letters. 2016;43:826–833. doi: 10.1002/2015GL066979. [DOI] [Google Scholar]
- Siegel DA, Behrenfeld MJ, Maritorena S, McClain CR, Antoine D, Bailey SW, Bontempi PS, et al. Regional to Global Assessments of Phytoplankton Dynamics from the SeaWiFS Mission. Remote Sensing of Environment. 2013;135:77–91. doi: 10.1016/j.rse.2013.03.025. [DOI] [Google Scholar]
- Uitz J, Claustre H, Morel A, Hooker SB. Vertical Distribution of Phytoplankton Communities in Open Ocean: An Assessment Based on Surface Chlorophyll. Journal of Geophysical Research Oceans. 2006;111(C8):1–23. [Google Scholar]
- Vantrepotte V, Melin F. Inter-Annual Variations in the SeaWiFS Global Chlorophyll a Concentration (1997–2007) Deep-Sea Research I. 2011;58:429–441. doi: 10.1016/j.dsr.2011.02.003. [DOI] [Google Scholar]
- Zhai L, Platt T, Tang C, Sathyendranath S, Walne A. The Response of Phytoplankton to Climate Variability Associated with the North Atlantic Oscillation. Deep-Sea Research II. 2013;93:159–168. doi: 10.1016/j.dsr2.2013.04.009. [DOI] [Google Scholar]


