Abstract
In chronic lymphocytic leukemia (CLL) cells, both interleukin-6 (IL-6) and the B-cell receptor (BCR) activate Janus kinase 2 (JAK2) and induce the phosphorylation of signal transduction and activator of transcription 3 (STAT3) on tyrosine 705 residues. However, whereas IL-6 phosphorylates STAT3 within 15 minutes, stimulation of the BCR with anti–immunoglobulin M (IgM) antibodies phosphorylates STAT3 in 2–4 hours. Here we show that this process takes longer because it requires transcriptional activity of NF-κB. Using an electromobility shift assay, we found that incubation with IgM antibodies for 4 or 18 hours, but not 15 minutes, increased NF-κB DNA-binding of CLL cells and increased binding was translated to increased transcriptional activity. Hence, 42% of the 83 NF-κB target genes were constitutively expressed in all CLL cells prior to any inducible stimuli. However, activation of the BCR increased the number of NF-κB target genes with detectable expression by 23%. Remarkably, prolonged incubation with anti-IgM antibodies induced a time-dependent transcription, production, and secretion of IL-6 protein. The IgM-induced production of IL-6 prompted the phosphorylation of STAT3 on tyrosine residues. This effect was inhibited by the JAK1/2 inhibitor of the JAK/STAT3 pathway ruxolitinib. Taken together, these results suggest that in CLL cells, constitutive tonic activation of NF-κB can be further enhanced by the BCR and that the BCR-induced activation of the JAK/STAT3 pathway depends on the NF-κB–induced production of IL-6.
Keywords: nuclear factor κB (NF-κB), signal transducer and activator of transcription 3 (STAT3), phosphorylation, chronic lymphocytic Leukemia (CLL)
Introduction
In chronic lymphocytic leukemia (CLL), signal transducer and activator of transcription 3 (STAT3) is constitutively phosphorylated on serine 727 residues and provides CLL cells with a survival advantage 1-7. Interleukin-6 (IL-6), typically secreted by T lymphocytes and macrophages, induces the phosphorylation of STAT3 on tyrosine 705 residues in various cell types 8, 9, including CLL-cells 1. In a recent study, we found that, similar to IL-6, anti–immunoglobulin M (IgM) antibodies that stimulate the B-cell receptor (BCR) induce the phosphorylation of Janus kinase 2 (JAK2) and consequently the tyrosine phosphorylation of STAT3 in CLL cells 1. However, whereas anti-IgM antibodies induce STAT3-tyrosine phosphorylation within 2–4 hours, IL-6 exerts the same effect within 15 minutes 1. Why stimulation with anti-IgM antibodies takes so much longer than IL-6 to induce the phosphorylation of STAT3 on tyrosine residues is unknown. We hypothesized that this process takes longer because BCR-mediated-STAT3 phosphorylation requires transcriptional activity. Specifically, because stimulation of the BCR activates the transcriptional activity of nuclear-factor-kappa-light-chain-enhancer-of-activated-B-cells (NF-κB), and because IL-6 is an NF-κB-target gene we hypothesized that IgM stimulates the BCR, activates the transcriptional activity NF-κB, and induces the transcription of IL-6. As a result, IL-6 protein is produced and excreted, binds to its corresponding extracellular receptors, and activates JAK2, which in turn phosphorylates STAT3, a process that requires hours to complete.
Materials and Methods
Cell fractionation
Peripheral blood (PB) cells were obtained from untreated CLL patients who were followed at The University of Texas MD Anderson Cancer Center Leukemia Center from 2013 to 2016 after the patients gave Institutional Review Board approved informed consent to participate in the study. The cells were fractionated using Ficoll Hypaque 1077 (Sigma, St. Louis], MO). The low-density cellular fraction was used immediately or frozen for additional studies.
Western blot analysis
Western blot analysis was performed as described previously 10. Briefly, cell lysates were assayed for their protein concentrations using the BCA protein assay reagent (Pierce Chemical, Rockford, IL). The lysates were mixed with 4x Laemmli sample buffer and then denatured by boiling for 5 minutes. Forty micrograms of lysates were separated using 8% sodium dodecyl sulfate–polyacrylamide gel electrophoresis and then transferred to a nitrocellulose membrane. The membranes were blocked with 5% dried milk dissolved in 50 mL of PBS. After blocking, the membrane was incubated with the following primary antibodies: anti-STAT3 antibodies (BD Biosciences, San Jose, CA), anti-Tyr705 STAT3 antibodies (Cell Signaling, Danvers, MA), anti–NF-κB p65 antibodies (Millipore, Charlottesville, VA), and mouse anti-human β-actin antibodies (Sigma-Aldrich, St. Louis, MO). After incubation with horseradish peroxidase–conjugated secondary antibodies (GE Healthcare, Buckinghamshire, UK) for 1 hour, the blots were visualized with an enhanced chemiluminescence detection system (GE Healthcare).
RNA extraction
For RNA extraction, cells were first thawed in hot water and then washed twice with RPMI (Thermo Fischer, Waltham, MA). Trizol (Invitrogen, Carlsbad, CA) was then added to the cells according to the manufacturer's protocol. RNA quality and concentration were analyzed with an ND-1000 spectrophotometer (NanoDrop Technologies, Wilmington, DE).
NF-κB target gene profile
To profile the expression of the NF-κB target genes, we used an RT2 Profiler PCR Array kit (Qiagen Sciences, Germantown, MD) This 96-well assay profiles the expression of 83 NF-κB target genes and has wells for 3 different housekeeping genes, a genomic DNA contamination control, 3 replicate reverse transcription controls, and 3 replicates of positive polymerase chain reaction (PCR). Real-time PCR was performed according to the manufacturer's instructions. The threshold (CT) value for each gene in the array was normalized to the CT value of GAPDH that had the minimum variance across the plates. In each array, the genes were ordered according to the normalized CT value and were considered to be expressed if the CT value was equal to or below the 75th percentile. We used the Partek Genomics Suite 6.6 software program (Partek Inc., St. Louis, MO) to generate a heat map based on the normalized CT values and the Venny 2.1 software program (http://bioinfogp.cnb.csic.es/tools/venny/) to compare gene lists. To compare gene expression at baseline and after treatment with anti-IgM antibodies we used the comparative CT method 11.
Quantitative reverse-transcription PCR
We used 500 ng of total RNA in 1-step quantitative reverse-transcription PCR (Applied Biosystems, Foster City, CA) analysis with an ABI Prism 7700 sequence detection system (Applied Biosystems) using a TaqMan gene expression assay for IL-6 and IL-8 according to the manufacturer's instructions. Samples were run in triplicate, and relative quantification was performed using the comparative CT method11.
Electromobility shift assay
We used an electromobility shift assay (EMSA) to measure NF-κB DNA-binding activity. Nuclear extracts were prepared using a NE-PER extraction kit (Thermo Scientific Pierce, Rockford, IL). Nuclear protein extracts were incubated with biotin-labeled NF-κB-promoter DNA probes synthesized by Sigma-Genosys (The Woodlands, TX) in binding buffer for 30 minutes on ice. Following incubation, the samples were separated on a 5% polyacrylamide gel, transferred onto a nylon membrane, and fixed on the membrane via ultraviolet cross-linking. The biotin-labeled probe was detected with streptavidin-horseradish peroxidase (Gel-Shift Kit; Panomics, Fremont, CA). The controls consisted of 7-fold excess unlabeled cold probe or the addition of anti–p65 NF-κB antibodies. Densitometry analysis was performed using the Epson Expression 1680 Scanner. The fraction of bound DNA ([bound DNA]/ [total DNA]) was estimated as 1 minus the fraction of unbound probe relative to the lane in which no protein was added (1 – [unbound DNA]/ [free DNA]).
Enzyme-linked immunosorbent assay
To measure IL-6 protein levels in the cell culture media we performed an enzyme-linked immunosorbent assay (ELISA, Pierce Thermo, Rockford, IL) according to the manufacturer's instructions. We assessed levels of IL-6 by comparing the color intensity of the tested samples with that of the standard IL-6 protein levels provided in the kit using a microplate reader (model #EL309, Bio-Tek Instruments, Winooski, VT).
Incubation of CLL cells with IL-6 neutralizing antibodies
We placed 1×10⁶ cells/ml into flasks in alpha modification MEM (Invitrogen) supplemented with 10% BCS (Hyclone Laboratories, Rockford, IL). IL-6–neutralizing antibodies (BD Biosciences) were added at a concentration of 1.0–2.5 ng/mL. Cells were incubated at 37°C for 16 hours and then harvested for further studies.
Results
NF-κB target genes are expressed in CLL cells
To assess the NF-κB gene signature in CLL, we used a PCR array that includes 83 known NF-κB target genes and profiled the expression of these genes in CLL cells from 6 different patients (Figure 1A, upper panel). Our PCR array analysis revealed that 35 (42%) of the 83 NF-κB target genes were expressed in CLL cells from all patients. Annotation analysis revealed 3 pathways that were significantly enriched in commonly expressed genes, including “positive regulation of the NF-κB cascade” (P = 9.0 × e-8), “negative regulation of apoptosis” (P = 5.1 × e-9), and “inflammation” (P = 1.0 × e-10) (Figure 1A, lower panel).
Figure 1.
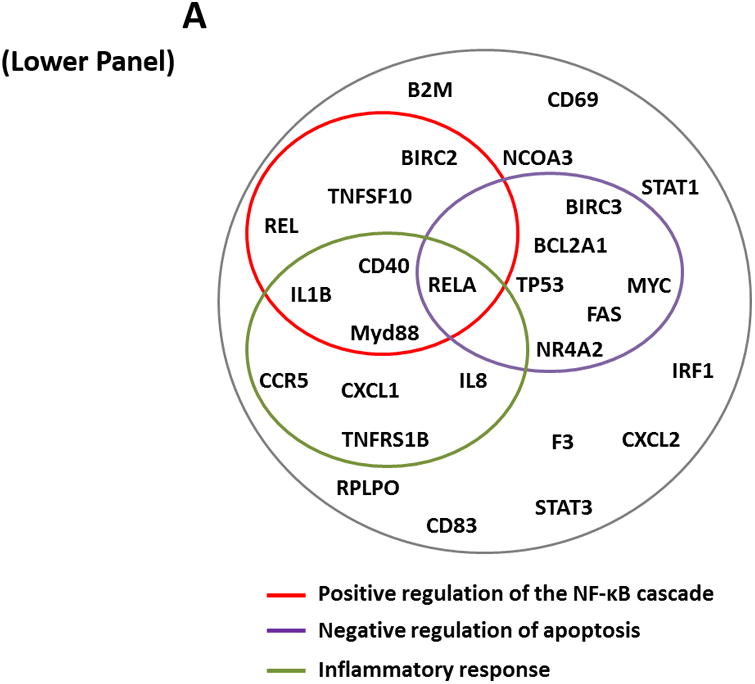
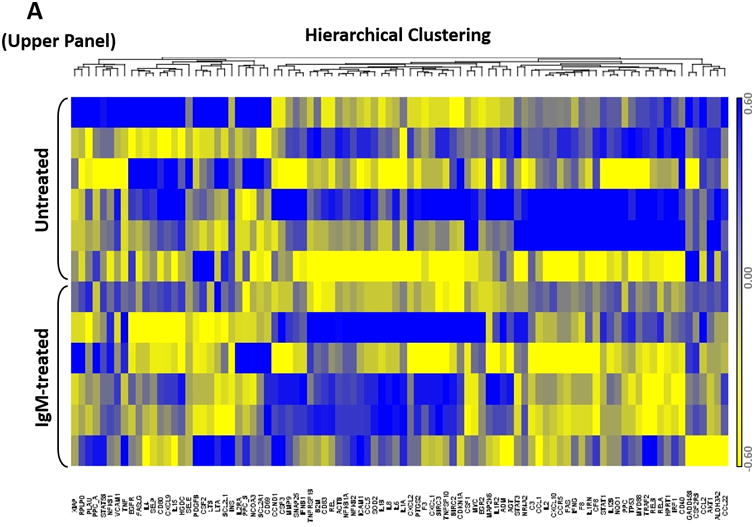
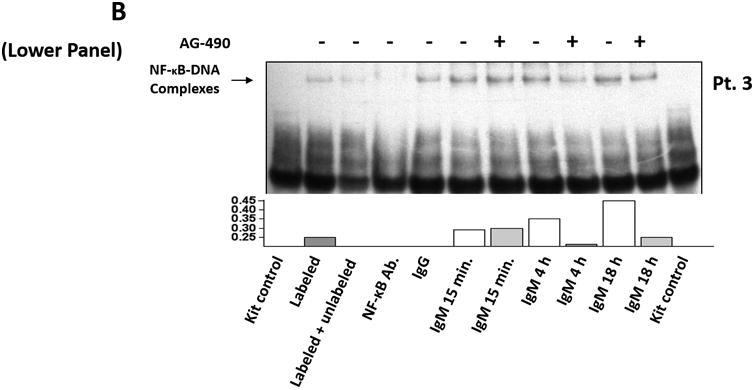
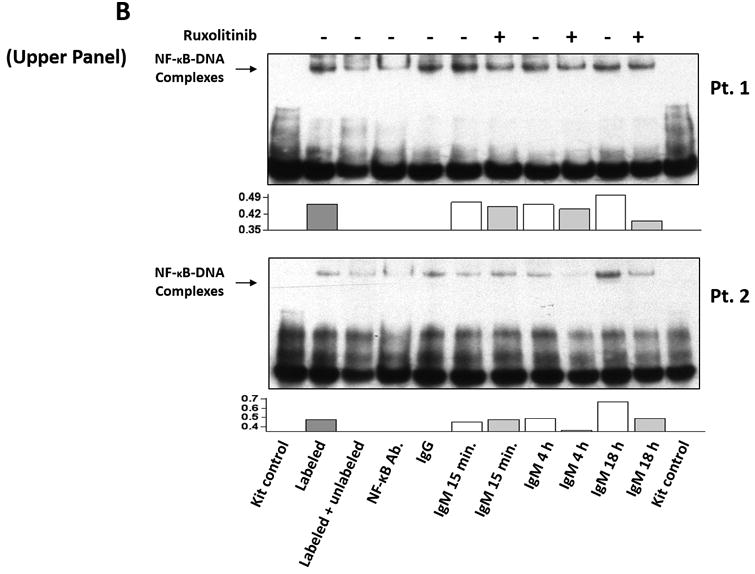
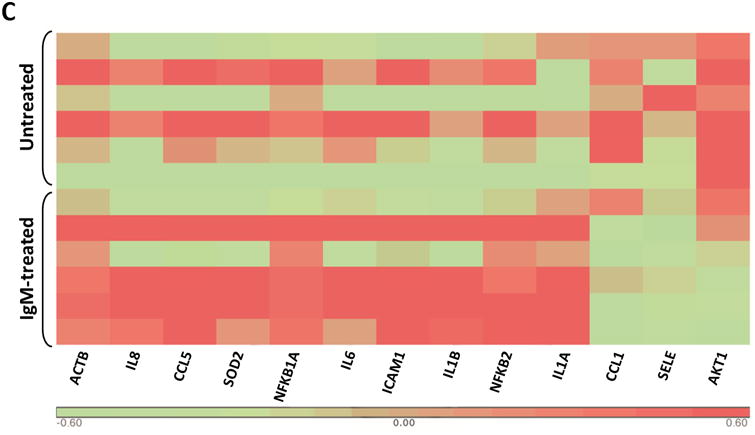
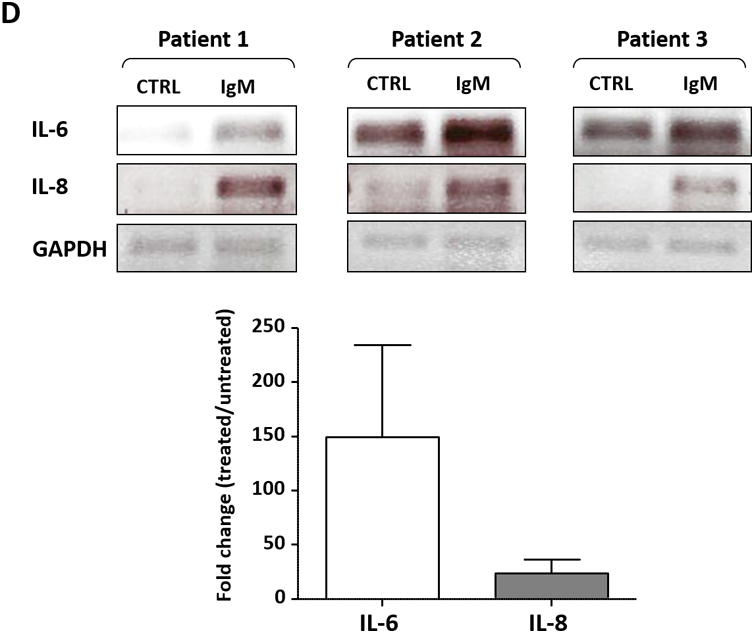
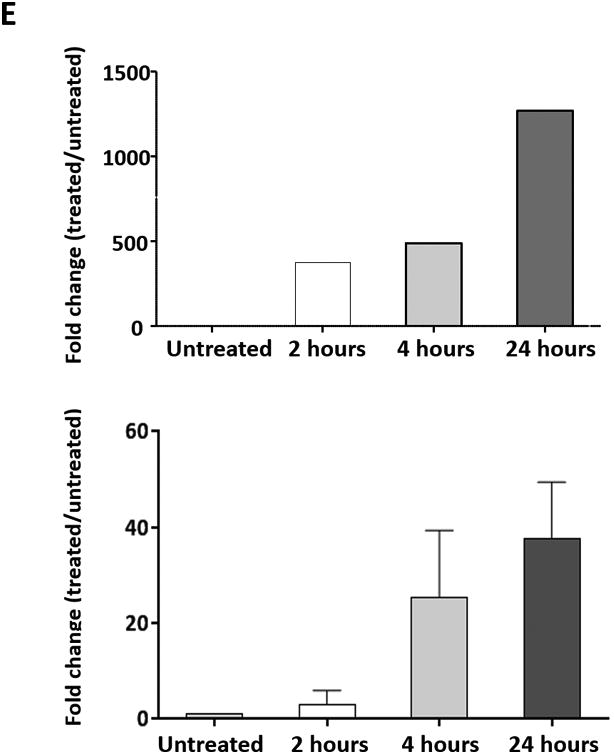
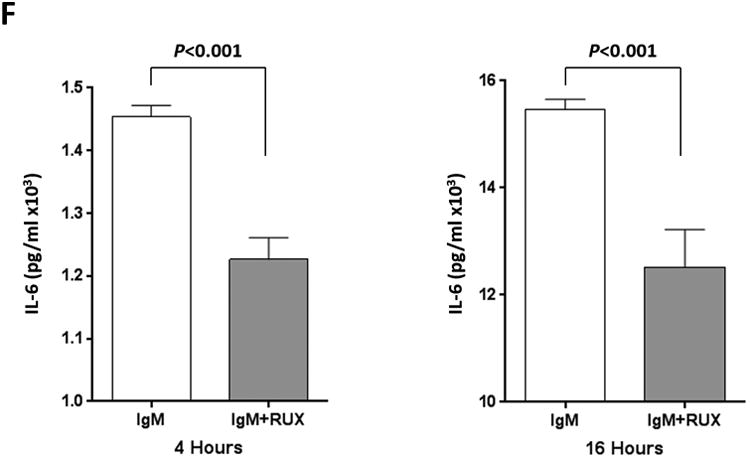
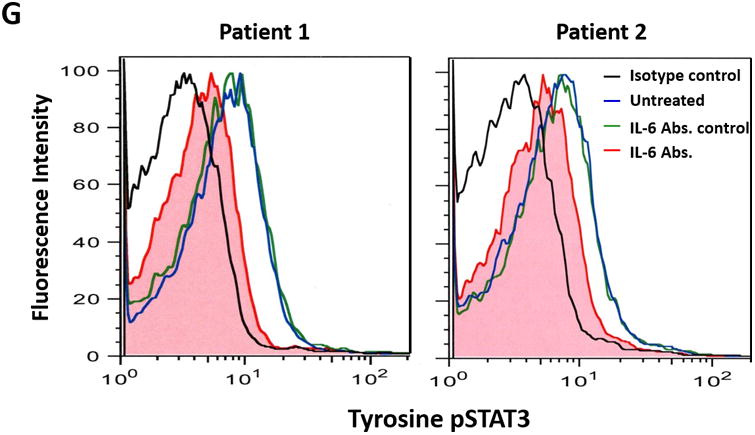
(A) The expression profile of 83 NF-κB target genes in CLL cells from 6 different patients (upper panel) and the 27 commonly expressed genes in the 3 annotated pathways that were upregulated in CLL cells from these patients (lower panel). (B) NF-κB DNA-binding activity in CLL cell nuclear extracts from 2 patients. Nuclear extracts of CLL cells from 3 patients were incubated with or without anti-IgM antibodies for 15 minutes, 4 hours, or 18 hours in the presence or absence of ruxolitinib (upper panel) or AG-490 (lower panel). An electromobility shift assay with a commercially available biotinylated NF-κB (p65) probe was used to detect NF-κB-DNA binding. The assay revealed that extracts from all patients bound to the NF-κB DNA–labeled probe and that stimulation with anti-IgM antibodies for 4 or 18 hours but not for 15 minutes increased NF-κB DNA-binding activity. Ruxolitinib (1.0 μM) or AG-490 (25 μM) disrupted the NF-κB DNA-binding activity. Bar graphs depict the fraction of bound to unbound DNA of their corresponding lanes. (C) Effect of anti-IgM antibodies on NF-κB-regulated gene levels. Heatmap analysis of 10 mostly upregulated genes and 3 mostly downregulated genes after stimulation with anti-IgM antibodies. (D) Effect of anti-IgM antibodies on IL-6 and IL-8 levels. Upper panel: CLL cells from 3 patients were incubated with anti-IgM antibodies for 4 hours. IL-6 and IL-8 mRNA levels increased after stimulation with IgM. GAPDH was used as the internal control (CTRL). Lower panel: Quantitative RT-PCR was used to determine the relative expression of IL-6 and IL-8 after IgM stimulation in cells from 3 CLL patients using the delta-delta CT assay. The means ± standard deviations of the fold changes in IL expression levels are depicted. (E) IL-6 mRNA levels in CLL cells following incubation with anti-IgM antibodies for 2, 4, or 24 hours. The relative expression of IL-6 quantified (upper panel) and by quantitative reverse-transcription PCR performed in triplicate using samples from 2 different patients (lower panel) is shown. (F) Effect of anti-IgM antibodies and ruxolitinib on IL-6 produced by CLL cells. CLL cells from 3 patients were cultured in triplicate without or with anti-IgM antibodies for 4 hours (left graph) or 16 hours (right graphs) in the presence or absence of 1.0 μM Ruxolitinib (RUX). The median level of IL-6 in culture media of CLL cells incubated without IgM was 8 pg/ml. Anti-IgM antibodies significantly increased IL-6 levels in the culture media of cultured CLL cells, and ruxolitinib significantly reduced IL-6 levels. Mean IL-6 levels ± SD are depicted. (G) Effect of anti-IgM antibodies and IL-6–neutralizing antibodies on phosphotyrosine STAT3 levels. Incubation of CLL cells with anti-IgM antibodies induced the phosphorylation of STAT3, and IL-6–neutralizing antibodies reversed this effect. The results of flow cytometry analyses of CLL cells from 2 patients are depicted. Levels of phosphotyrosine STAT3 in CLL cells incubated with anti-IgM antibodies for 4 hours increased, and they were markedly reduced by the addition of IL-6–neutralizing antibodies.
Stimulation of the BCR increases NF-κB transcriptional activity in CLL cells
Although NF-κB is constitutively activated in unstimulated CLL cells 3, less than half of the NF-κB target genes were consistently transcribed in untreated CLL cells. To determine whether stimulation of the BCR increases the transcriptional activity of NF-κB, we incubated CLL cells from 2 patients with or without anti-IgM antibodies and, using EMSA, assessed the binding of CLL cell nuclear extracts to a labeled NF-κB DNA probe. With this assay we detected NF-κB DNA-binding activity in the nuclear extracts from both CLL cells treated with IgM and those not treated with IgM. However the DNA-binding was much higher in CLL cells that were incubated with anti-IgM antibodies for 4 and 18 hours but not in those incubated for 15 minutes (Figure 1B). Because we recently found that stimulation of the BCR activates JAK2 1, we wondered whether addition of the JAK1/2 inhibitor ruxolitinib will inhibit the NF-κB DNA-binding activity. Remarkably, ruxolitinib and AG-490, used as a JAK2 inhibitor control, significantly attenuated the NF-κB-DNA binding in extracts from CLL cells that were incubated with anti-IgM antibodies for 4 or 18 hours but not those incubated for 15 minutes (Figure 1B). This higher level of NF-κB-DNA binding activity translated into a 23% more NF-κB target genes detectable after 4 hour incubation with anti-IgM antibodies compared with untreated CLL cells (Figure 1C).
NF-κB–transcribed IL-6 enhances the phosphorylation of STAT3 on tyrosine residues
Although NF-κB is constitutively activated in CLL cells and IL-6 is an NF-κB–regulated gene, IL-6 transcripts were not detected in 3 of the 6 untreated CLL cell samples obtained from patients with similar clinical characteristics. However, IL-6 transcripts were detected in all 6 samples after anti-IgM stimulation (Figure 1C). Furthermore, IL-6 and IL-8 transcript levels increased with longer exposure to IgM antibodies in a time-dependent manner (data not shown). To confirm the array results, we obtained PB CLL cells from 3 patients and analyzed them by PCR, which revealed low IL-6 and IL-8 mRNA levels in unstimulated CLL cells. Incubation of these cells for 4 hours with anti-IgM antibodies increased both IL-6 and IL-8 mRNA levels (Figure 1D), and IgM stimulation significantly increased IL-6 mRNA levels in a time-dependent manner (Figure 1E).
To determine whether incubation of CLL cells with anti-IgM antibodies also increases IL-6 protein production, we incubated CLL cells from 3 different CLL patients for 4 or 16 hours with or without anti-IgM antibodies. Because IL-6 is a secreted protein, we measured IL-6 protein levels in the cells' culture media using enzyme-linked immunosorbent assay. The supernatant of untreated CLL cells had low IL-6 levels (mean level, 8 pg/mL), whereas the supernatant of cells incubated with anti-IgM antibodies had significantly increased IL-6 levels and the JAK1/2 inhibitor ruxolitinib markedly reduced IL-6 levels in the supernatant of IgM-stimulated cells (Figure 1F). Then, to determine whether IL-6 induces tyrosine phosphorylation of STAT3 in IgM-stimulated CLL cells, we incubated CLL cells from 2 patients with anti-IgM antibodies. Using flow cytometry, we found that anti-IgM antibodies induced the phosphorylation of STAT3 on tyrosine residues and IL-6–neutralizing antibodies markedly reduced phosphotyrosine STAT3 levels (Figure 1G). Taken together, these data suggest that stimulation of the BCR induces the production of high IL-6 levels and that IL-6 induces the phosphorylation of STAT3 on tyrosine residues.
Discussion
Here we show that constitutive tonic activation of NF-κB results in the production of low levels of IL-6, whereas stimulation of the BCR induces further activation of NF-κB, which in turn activates the transcription and production of IL-6, thereby inducing the phosphorylation of STAT3 on tyrosine residues (Figure 2).
Figure 2.
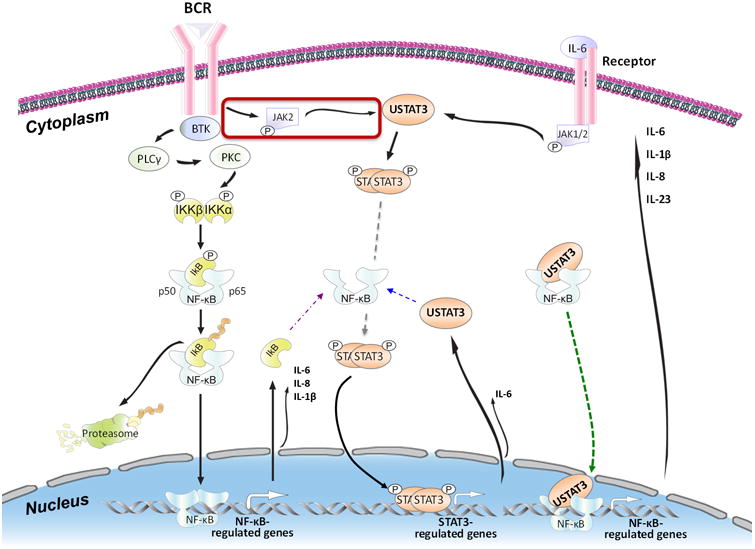
Schematic model of BCR-induced successive activation of NF-κB and STAT3 in CLL cells. Activation of the BCR of CLL cells (left upper corner) phosphorylates the Bruton tyrosine kinase (BTK). Phosphorylated BTK activates phospholipase C-γ (PCLγ) and consequently protein kinase C (PKC). PKC phosphorylates IκB kinase (IKK)-α and -β, which form a complex that phosphorylates and induces the degradation of IκB, which is removed by the proteasome system (left lower corner). As a result, the NF-κB p50 and p65 complex becomes phosphorylated and migrates to the nucleus, where it binds to DNA and activates NF-κB–regulated genes, one of which is IκB. Cytoplasmic IκB protein binds and inactivates NF-κB (purple arrow). However, constitutively phosphorylated STAT3 constantly activates STAT3-regulated genes such as STAT3. Cytosolic unphosphorylated STAT3 (USTAT3) binds NF-κB in competition with IκB (blue arrow) and, because USTAT3 moves freely in and out of the nucleus, the USTAT3–NF-κB complex translocates to the nucleus, binds to DNA, and activates NF-κB–regulated genes (green arrow). As a result, several inflammatory cytokines are produced. Secreted IL-6 binds to its corresponding extracellular receptors (right upper corner) and induces the phosphorylation of JAK1 and JAK2. JAK2 phosphorylates STAT3, and STAT3 dimers migrate to the nucleus bind and activate STAT3-regulated genes, including STAT3. USTAT3 binds to and activates NF-κB and re-starts a process that results in the abundant production and secretion of various chemokines and cytokines, such as IL-6.
Previous studies demonstrated that the NF-κB pathway is constitutively activated in PB CLL cells 3, 12. Other studies showed that the levels of NF-κB-target genes are higher in lymph node-derived CLL cells than in PB-derived CLL cells 13. Because the BCR is thought to be activated in lymph node CLL cells, we compared the NF-κB gene expression signature of BCR-stimulated PB CLL cells to that of BCR-unstimulated PB CLL cells. Although we found a significant overlap in the NF-κB target gene expression profiles of the BCR-stimulated and -unstimulated PB CLL cells, the BCR-stimulated CLL cells expressed 23% more NF-κB-target genes than the BCR-unstimulated cells did, suggesting that NF-κB activation is not an “all-or-none” phenomenon. Indeed, a “chronic” antigen-independent activation of the BCR in CLL has been described 14. This tonic activation provides a substrate for further activation of NF-κB and NF-κB-target genes 15, 16. Our data show that basal-state activated NF-κB induces the expression of NF-κB-target genes whose activation establishes an inflammatory environment (Figure 1A).
In accordance with our findings of basal NF-κB activity that is augmented by BCR stimulation, accumulating evidence suggests that, in addition to basal antigen-independent activation of the BCR, antigen-dependent activation of the BCR, assessed primarily in the lymph nodes, provides CLL cells with a proliferation capacity 13, 17. Previous studies showed that an in-vitro response to surface immunoglobulin cross-linking might be detected in CLL-cells from some CLL patients in whom CLL-cells remain anergic 18, 19. This lack of responsiveness is likely partial. Our data suggest that such lack of responsiveness does not prevent the constitutive activation of NF-κB. Furthermore, we found that regardless of the BCR activation status, constitutive tonic activation of NF-κB in CLL-cells was detected in PB CLL cells and that stimulation of these cells with anti-IgM antibodies further increased NF-κB activity and the expression of additional NF-κB–regulated gene transcripts in all analyzed samples. Similar to others who have reported that the mRNA and protein levels of IL-6 are mildly increased in the plasma of CLL patients 20, 21, we detected low IL-6 protein levels in the supernatant of unstimulated cultured CLL cells. However, stimulation of the BCR increased IL-6 mRNA and secreted IL-6 protein levels and induced the tyrosine phosphorylation of STAT3. IL-6–neutralizing antibodies reduced the levels of phosphotyrosine STAT3, suggesting that stimulation of the BCR induces the production of IL-6 and that extracellular IL-6 binds to its corresponding receptors and induces the phosphorylation of STAT3 on tyrosine residues. Likewise, the proinflammatory cytokine IL-8, typically released from macrophages and endothelial cells 22, 23, was found to be aberrantly expressed in BCR-stimulated CLL cells 24. IL-8, known to induce cancer cell proliferation in an autocrine manner 23, might induce similar effects in BCR-stimulated CLL cells.
Finally, our findings provide further evidence that the NF-κB and the JAK/STAT pathways have overlapping functions and intertwined activities in CLL cells. We previously demonstrated that unphosphorylated STAT3, found in abundance in CLL cells, activates the NF-κB pathway 3. In the present study, we found that NF-κB activates STAT3 in an indirect manner. Stimulation of the BCR activates NF-κB, which induces IL-6 production. In a process that requires 2–4 hours to complete, IL-6 protein is produced, is excreted, binds to its corresponding receptors, and rapidly induces the phosphorylation of STAT3 on tyrosine residues 1, 6. However, because IL-6 is a target gene of both NF-κB and STAT3 25, the activation of STAT3 further enhances the production of IL-6 protein. Indeed, we found that ruxolitinib, a potent inhibitor of the JAK/STAT pathway, markedly reduced the levels of IL-6 protein secreted by BCR-stimulated CLL cells.
Conclusion
Our data suggest that IL-6 is aberrantly expressed in CLL cells. Stimulation of the BCR significantly increases the constitutive activation of NF-κB, and NF-κB induces the production of IL-6, which successively phosphorylates STAT3 on tyrosine residues in an autocrine or paracrine manner (Figure 2). These findings uncover a novel perspective of the function of STAT3 and NF-κB signaling pathways in CLL and provide novel targets for therapeutic intervention in CLL.
Novelty and Impact.
Traditionally, signaling pathway activation has been classified as either constitutive or inducible. Herein, we show that NF-κB activation is not an “all-or-none” phenomenon. Rather, constitutively activated NF-κB can be further activated by the BCR in CLL cells. Furthermore, the functions of NF-κB and STAT3 are intertwined. Whereas unphosphorylated STAT3 induces tonic NF-κB activation in CLL cells, prolonged stimulation of the BCR further activates NF-κB, which, by inducing IL-6 production, indirectly phosphorylates STAT3 on tyrosine residues.
Acknowledgments
We thank Joseph Munch for editing our manuscript.
Financial support: This study was supported by a grant from the CLL Global Research Foundation and the Cancer Center Support Grant from the NIH/NCI, P30 CA016672.
References
- 1.Rozovski U, Wu JY, Harris DM, Liu Z, Li P, Hazan-Halevy I, Ferrajoli A, Burger JA, O'Brien S, Jain N, Verstovsek S, Wierda WG, et al. Stimulation of the B-cell receptor activates the JAK2/STAT3 signaling pathway in chronic lymphocytic leukemia cells. Blood. 2014;123:3797–802. doi: 10.1182/blood-2013-10-534073. [DOI] [PMC free article] [PubMed] [Google Scholar]
- 2.Rozovski U, Grgurevic S, Bueso-Ramos C, Harris DM, Li P, Liu Z, Wu JY, Jain P, Wierda W, Burger J, O'Brien S, Jain N, et al. Aberrant LPL Expression, Driven by STAT3, Mediates Free Fatty Acid Metabolism in CLL Cells. Mol Cancer Res. 2015;13:944–53. doi: 10.1158/1541-7786.MCR-14-0412. [DOI] [PMC free article] [PubMed] [Google Scholar]
- 3.Liu Z, Hazan-Halevy I, Harris DM, Li P, Ferrajoli A, Faderl S, Keating MJ, Estrov Z. STAT-3 activates NF-kappaB in chronic lymphocytic leukemia cells. Mol Cancer Res. 2011;9:507–15. doi: 10.1158/1541-7786.MCR-10-0559. [DOI] [PMC free article] [PubMed] [Google Scholar]
- 4.Li P, Harris D, Liu Z, Rozovski U, Ferrajoli A, Wang Y, Bueso-Ramos C, Hazan-Halevy I, Grgurevic S, Wierda W, Burger J, O'Brien S, et al. STAT3-activated GM-CSFRalpha translocates to the nucleus and protects CLL cells from apoptosis. Mol Cancer Res. 2014;12:1267–82. doi: 10.1158/1541-7786.MCR-13-0652-T. [DOI] [PMC free article] [PubMed] [Google Scholar]
- 5.Li P, Grgurevic S, Liu Z, Harris D, Rozovski U, Calin GA, Keating MJ, Estrov Z. Signal transducer and activator of transcription-3 induces MicroRNA-155 expression in chronic lymphocytic leukemia. PLoS One. 2013;8:e64678. doi: 10.1371/journal.pone.0064678. [DOI] [PMC free article] [PubMed] [Google Scholar]
- 6.Hazan-Halevy I, Harris D, Liu Z, Liu J, Li P, Chen X, Shanker S, Ferrajoli A, Keating MJ, Estrov Z. STAT3 is constitutively phosphorylated on serine 727 residues, binds DNA, and activates transcription in CLL cells. Blood. 2010;115:2852–63. doi: 10.1182/blood-2009-10-230060. [DOI] [PMC free article] [PubMed] [Google Scholar]
- 7.Frank DA, Mahajan S, Ritz J. B lymphocytes from patients with chronic lymphocytic leukemia contain signal transducer and activator of transcription (STAT) 1 and STAT3 constitutively phosphorylated on serine residues. J Clin Invest. 1997;100:3140–8. doi: 10.1172/JCI119869. [DOI] [PMC free article] [PubMed] [Google Scholar]
- 8.Heinrich PC, Behrmann I, Haan S, Hermanns HM, Muller-Newen G, Schaper F. Principles of interleukin (IL)-6-type cytokine signalling and its regulation. The Biochemical journal. 2003;374:1–20. doi: 10.1042/BJ20030407. [DOI] [PMC free article] [PubMed] [Google Scholar]
- 9.Wang Y, van Boxel-Dezaire AH, Cheon H, Yang J, Stark GR. STAT3 activation in response to IL-6 is prolonged by the binding of IL-6 receptor to EGF receptor. Proc Natl Acad Sci U S A. 2013;110:16975–80. doi: 10.1073/pnas.1315862110. [DOI] [PMC free article] [PubMed] [Google Scholar]
- 10.Ferrajoli A, Faderl S, Van Q, Koch P, Harris D, Liu Z, Hazan-Halevy I, Wang Y, Kantarjian HM, Priebe W, Estrov Z. WP1066 disrupts Janus kinase-2 and induces caspase-dependent apoptosis in acute myelogenous leukemia cells. Cancer Res. 2007;67:11291–9. doi: 10.1158/0008-5472.CAN-07-0593. [DOI] [PubMed] [Google Scholar]
- 11.Schmittgen TD, Livak KJ. Analyzing real-time PCR data by the comparative C(T) method. Nature protocols. 2008;3:1101–8. doi: 10.1038/nprot.2008.73. [DOI] [PubMed] [Google Scholar]
- 12.Lopez-Guerra M, Colomer D. NF-kappaB as a therapeutic target in chronic lymphocytic leukemia. Expert Opin Ther Targets. 2010;14:275–88. doi: 10.1517/14728221003598930. [DOI] [PubMed] [Google Scholar]
- 13.Herishanu Y, Perez-Galan P, Liu D, Biancotto A, Pittaluga S, Vire B, Gibellini F, Njuguna N, Lee E, Stennett L, Raghavachari N, Liu P, et al. The lymph node microenvironment promotes B-cell receptor signaling, NF-kappaB activation, and tumor proliferation in chronic lymphocytic leukemia. Blood. 2011;117:563–74. doi: 10.1182/blood-2010-05-284984. [DOI] [PMC free article] [PubMed] [Google Scholar]
- 14.Duhren-von Minden M, Ubelhart R, Schneider D, Wossning T, Bach MP, Buchner M, Hofmann D, Surova E, Follo M, Kohler F, Wardemann H, Zirlik K, et al. Chronic lymphocytic leukaemia is driven by antigen-independent cell-autonomous signalling. Nature. 2012;489:309–12. doi: 10.1038/nature11309. [DOI] [PubMed] [Google Scholar]
- 15.Zanesi N, Balatti V, Riordan J, Burch A, Rizzotto L, Palamarchuk A, Cascione L, Lagana A, Dupuy AJ, Croce CM, Pekarsky Y. A Sleeping Beauty screen reveals NF-kB activation in CLL mouse model. Blood. 2013;121:4355–8. doi: 10.1182/blood-2013-02-486035. [DOI] [PMC free article] [PubMed] [Google Scholar]
- 16.Stadanlick JE, Kaileh M, Karnell FG, Scholz JL, Miller JP, Quinn WJ, 3rd, Brezski RJ, Treml LS, Jordan KA, Monroe JG, Sen R, Cancro MP. Tonic B cell antigen receptor signals supply an NF-kappaB substrate for prosurvival BLyS signaling. Nat Immunol. 2008;9:1379–87. doi: 10.1038/ni.1666. [DOI] [PMC free article] [PubMed] [Google Scholar]
- 17.Oppezzo P, Dighiero G. Role of the B-cell receptor and the microenvironment in chronic lymphocytic leukemia. Blood Cancer J. 2013;3:e149. doi: 10.1038/bcj.2013.45. [DOI] [PMC free article] [PubMed] [Google Scholar]
- 18.Lanham S, Hamblin T, Oscier D, Ibbotson R, Stevenson F, Packham G. Differential signaling via surface IgM is associated with VH gene mutational status and CD38 expression in chronic lymphocytic leukemia. Blood. 2003;101:1087–93. doi: 10.1182/blood-2002-06-1822. [DOI] [PubMed] [Google Scholar]
- 19.Muzio M, Apollonio B, Scielzo C, Frenquelli M, Vandoni I, Boussiotis V, Caligaris-Cappio F, Ghia P. Constitutive activation of distinct BCR-signaling pathways in a subset of CLL patients: a molecular signature of anergy. Blood. 2008;112:188–95. doi: 10.1182/blood-2007-09-111344. [DOI] [PubMed] [Google Scholar]
- 20.Robak T, Wierzbowska A, Blasinska-Morawiec M, Korycka A, Blonski JZ. Serum levels of IL-6 type cytokines and soluble IL-6 receptors in active B-cell chronic lymphocytic leukemia and in cladribine induced remission. Mediators Inflamm. 1999;8:277–86. doi: 10.1080/09629359990289. [DOI] [PMC free article] [PubMed] [Google Scholar]
- 21.Yan XJ, Dozmorov I, Li W, Yancopoulos S, Sison C, Centola M, Jain P, Allen SL, Kolitz JE, Rai KR, Chiorazzi N, Sherry B. Identification of outcome-correlated cytokine clusters in chronic lymphocytic leukemia. Blood. 2011;118:5201–10. doi: 10.1182/blood-2011-03-342436. [DOI] [PMC free article] [PubMed] [Google Scholar]
- 22.Wolff B, Burns AR, Middleton J, Rot A. Endothelial cell “memory” of inflammatory stimulation: human venular endothelial cells store interleukin 8 in Weibel-Palade bodies. J Exp Med. 1998;188:1757–62. doi: 10.1084/jem.188.9.1757. [DOI] [PMC free article] [PubMed] [Google Scholar]
- 23.Brew R, Erikson JS, West DC, Kinsella AR, Slavin J, Christmas SE. Interleukin-8 as an autocrine growth factor for human colon carcinoma cells in vitro. Cytokine. 2000;12:78–85. doi: 10.1006/cyto.1999.0518. [DOI] [PubMed] [Google Scholar]
- 24.Waugh DJ, Wilson C. The interleukin-8 pathway in cancer. Clin Cancer Res. 2008;14:6735–41. doi: 10.1158/1078-0432.CCR-07-4843. [DOI] [PubMed] [Google Scholar]
- 25.Kang JW, Park YS, Lee DH, Kim JH, Kim MS, Bak Y, Hong J, Yoon DY. Intracellular interaction of interleukin (IL)-32alpha with protein kinase Cepsilon (PKCepsilon) and STAT3 protein augments IL-6 production in THP-1 promonocytic cells. J Biol Chem. 2012;287:35556–64. doi: 10.1074/jbc.M112.400911. [DOI] [PMC free article] [PubMed] [Google Scholar]


