

Abstract
Three-dimensional nanoarchitectures of Co3O4@multi-walled carbon nanotubes (Co3O4@MWNTs) were synthesized via a one-step process with hydrothermal growth of Co3O4 nanoparticles onto MWNTs. The structure and morphology of the Co3O4@MWNTs were characterized by X-ray diffraction, Fourier transform infrared spectroscopy, Brunauer–Emmett–Teller, scanning electron microscopy and transmission electron microscopy. The electrocatalytic mechanism of the Co3O4@MWNTs was studied by X-ray photoelectron spectroscopy and cyclic voltammetry. Co3O4@MWNTs exhibited high electrocatalytic activity towards glucose oxidation in alkaline medium and could be used in nonenzymatic electrochemical devices for glucose oxidation. The open circuit voltage of the nonenzymatic glucose/O2 fuel cell was 0.68 V, with a maximum power density of 0.22 mW cm−2 at 0.30 V. The excellent electrochemical properties, low cost, and facile preparation of Co3O4@MWNTs demonstrate the potential of strongly coupled oxide/nanocarbon hybrid as effective electrocatalyst in glucose fuel cells and biosensors.
Keywords: Co3O4 nanoarchitecture, multi-walled carbon nanotubes, nonenzymatic, glucose biosensor, glucose biofuel cell
1. Introduction
Glucose biofuel cells (GBFCs) have received much attention as promising next-generation energy storage systems [1–4], due to the abundance of glucose sources (e.g. starch, cellulose [5], body fluids [6]) and very high energy (−2.87 × 10³ kJ mol−1) produced after complete glucose oxidation [7]. However, the performance of GBFCs strongly depends on the catalysts, which are crucial for the glucose oxidation reaction (GOR) [1]. Generally, two kinds of catalysts are used in GBFCs: biological and non-biological [8]. Biological catalysts are specific enzymes for the anodic oxidation of glucose molecules. However, enzymes are restricted in their application to GBFCs, due to their poor stability [6], poor immobilization techniques [8], susceptibility to the operating environment and vulnerability with long-term running [9]. These problems must be overcome for the development of enzymatic GBFCs [5]. Examples of non-biological catalysts include precious metals (Pd [10] and Au [6,11,12]) and metal oxides (Co3O4 [13] and CuO [14]), which possess exceptional catalytic properties for oxidation of glucose [15–17].
Recently, cobalt oxide (Co3O4) has attracted attention as a non-biological catalyst due to its low cost and good electrochemical and catalytic properties [18–21]. A recent report described Co3O4 hollow nanododecahedra having excellent catalytic abilities towards glucose oxidation in GBFCs [13], opening the possibility of using Co3O4 as an appropriate alternative for glucose enzymes. However, the electrical conductivity of Co3O4 is poor, and conductive carbon-based supports are generally employed when exploring the catalytic performance of Co3O4.
Extensive efforts have focused on the design of metal/metal oxide and carbon composites to enhance catalytic activity. Among the explored carbon-based nanomaterials, carbon nanotubes (CNTs) with high electrical conductivity, large surface area, high mechanical strength and structural flexibility [22], are promising substrates for composite catalysts [23–25]. Metal oxide/CNTs nanocomposites, combining the advanced properties of each component, have drawn interest for use in catalysis, sensor and energy storage. The reactions occurring to multi-walled CNTs cannot destroy the inner graphitic walls of multi-walled carbon nanotubes, thus ensuring a good conducting network [22]. When Co3O4 was coupled with CNTs, it showed better performance than MWNTs, cubic spinel Co3O4, or their physical mixture [4].
In this study, we constructed three-dimensional (3D) nanoarchitectures of Co3O4@MWNTs by a facile hydrothermal method. The prepared Co3O4@MWNTs nanocomposites exhibited high electrocatalytic activity and outstanding stability for glucose biosensors and glucose fuel cells (GFCs) (scheme 1).
Scheme 1.
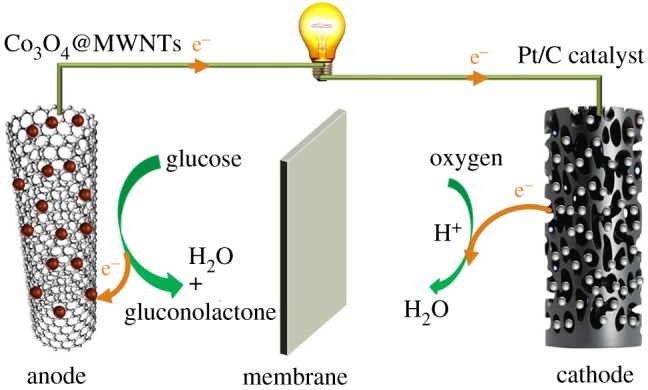
Schematic diagram of the glucose-powered fuel cell based on 3D Co3O4@MWNTs material as anode and cathode.
2. Material and methods
2.1. Materials
MWNTs functionalized with carboxylic acid groups (CNTs, greater than 95%, 8–15 nm in diameter, approximately 50 µm in length, produced by the chemical vapour deposition (CVD) method) were purchased from Aladdin. NH4OH (25–28%) and KOH were obtained from Xilong Scientific. Alcohol, glucose and Co(Ac)2·4H2O were obtained from Sinopharm Chemical Reagent Co., Ltd, China. Nafion® 117 solution was purchased from Sigma-Aldrich. The proton exchange membrane and carbon fibre sheet were obtained from Sigma-Aldrich. All chemicals and solvents were used without further purification.
2.2. Synthesis of samples
Co3O4@MWNTs composite was synthesized by a simple one-step hydrothermal reaction. MWNTs (0.1 g) were dispersed in 60 ml of alcohol under ultrasonication for 30 min. A certain amount of Co(Ac)2·4H2O was added to the dispersion with continued ultrasonication for 20 min. NH4OH and deionized water were successively added dropwise to the dispersion with ultrasonication for 10 min. The dispersion was conducted by backflow in oil at 80°C for 10 h before being transferred into a 200 ml Teflon autoclave. After hydrothermal reaction at 150°C for 3 h, black precipitate was collected by centrifugation and washed several times with deionized water and alcohol, as shown in electronic supplementary material, scheme S1. The final product was dried at 80°C for 3 h in a vacuum oven and directly used as the GOR catalyst without any further treatment. Co3O4 was synthesized with the same method but without the addition of MWNTs.
2.3. Apparatus measurements
Field-emission scanning electron microscopy (SEM; JEOL, JSM-6701) observation was performed. Transmission electron microscopy (TEM; JEOL, JEM-2010) and high-resolution transmission electron microscopy (HRTEM) images were obtained with an energy dispersive X-ray spectroscopy detector. X-ray diffraction (XRD) patterns were collected by using an X-ray diffractometer (Rigaku Ultima IV) with Cu Kα radiation (λ = 1.5406 Å). Fourier transform infrared spectroscopy (FTIR) was measured on a 470 FTIR spectrometer. Brunauer–Emmett–Teller (BET) was conducted on a Micromeritics Instrument Corporation sorption analyser (Micromeritics TriStar II 3020). X-ray photoelectron spectroscopy (XPS) measurements were carried out on a PHI Quantera SXM model spectrometer, to obtain the composition of the materials. Binding energies reported in this study were revised by the C 1 s peak (284.8 eV).
2.4. Electrochemical measurements
The modified electrode was prepared through three steps. (i) The glassy carbon electrode (GCE) was polished with alumina slurry and ultrasonically cleaned in deionized water and ethanol, respectively. (ii) A 10 mg aliquot of the prepared material was dispersed in 1 ml of deionized water and ultrasonically dispersed for 10 min. (iii) A 5 μl aliquot of dispersion liquid was dropped onto the surface of the GCE. After the GCE was dried, 5 µl of Nafion solution (0.5%) was dropped onto the surface of the GCE, which was dried at room temperature. This method was also used to prepare the electrode of the GFC.
Electrochemical measurements were performed with a CHI 660E electrochemical workstation (Beijing, China). Cyclic voltammetry (CV) measurements were made in the 0–0.7 V region with an electrolyte of 0.1 M KOH, by using the conventional three-electrode system, with the modified GCE as the working electrode, Pt sheet as the counter electrode, and Ag/AgCl electrode as the reference electrode [13].
The GFC, with organic glass as the shell material, was separated into anodic and cathodic compartments by a proton exchange membrane. Solutions filling the anode and cathode chambers were argon-saturated 0.1 M KOH/0.1 M glucose solution and oxygen-saturated buffer solution, respectively. The anode was prepared by smearing a carbon fibre sheet (active area: 1 × 1 cm2) with the suspension liquid mentioned above. The open circuit voltage (Eocv) was measured by a digital multimeter. The power density of the fuel cell was calculated by the voltage on the variable external resistance linking the fuel cell and the current through it.
3. Results and discussion
3.1. Morphology and structure
Figure 1a shows the XRD patterns of pure Co3O4 (blue line) and Co3O4@MWNTs composite (red line). Diffraction peaks at 2θ = 19.0°, 31.3°, 36.8°, 38.6°, 44.8°, 55.7°, 59.4°, 65.2° and 77.3° can be well assigned to the (111), (220), (311), (222), (400), (422), (511), (440) and (533) crystal planes of the Co3O4 (JCPDS no. 73–1701) and 26.2° assigned to the (002) crystal plane of graphite (JCPDS no. 75–1621) from the red line. The Co3O4@MWNTs were considered to be synthesized successfully, because there were no other diffraction peaks observed except those of the CNTs (red line) and Co3O4 (blue line). The Co3O4 crystallites on the CNTs were smaller than the pure Co3O4 crystallites from the broader and weaker XRD peaks of the Co3O4@MWNTs compared to the peaks of the pure Co3O4 (blue line).
Figure. 1.

XRD pattern of the Co3O4@MWNTs and Co3O4 (a) and FTIR spectra for Co3O4@MWNTs and MWNTs (b).
The FTIR spectra of Co3O4@MWNTs and MWNTs were recorded in figure 1b to study the formation mechanism of Co3O4. On comparison, the IR spectrum of MWNTs displays a distinct peak at 1700 cm−1 that originate from the stretching vibration of C = O of carboxyl, while the IR spectrum of Co3O4@MWNTs displays two distinct peaks at 577 cm−1 and 666 cm−1. The peak at 577 cm−1 relates to the OB3 vibration in the spinel lattice, where B denotes Co3+ in an octahedral hole, and the other peak at 666 cm−1 is connected with the ABO3 vibration, where A denotes the Co2+ in a tetrahedral hole [26]. When the two metal–oxygen bonds appeared, the C = O bond disappeared. Hence, we can draw the conclusion that the formation of Co3O4 takes place on carboxyl groups of the MWNTs.
The N2 adsorption–desorption isotherms of the Co3O4 and Co3O4@MWNTs were shown in electronic supplementary material, figure S3, in which the adsorption isotherm and desorption isotherm were superposed, demonstrating that there was no pore existing on the surface of the materials. The BET surface area of Co3O4 and Co3O4@MWNTs were 67.2 m² g−1 and 70.0 m² g−1, respectively, indicating the specific area increased after the composition of Co3O4 and MWNTs.
SEM image of the Co3O4@MWNTs composites consisted of 3D CNTs with uniformly attached Co3O4 nanoparticles (figure 2a), whereas SEM image of pure Co3O4 revealed a lump of powder with a disordered structure (electronic supplementary material, figure S1a). And the Co3O4 particles on Co3O4@MWNTs were 3–6 nm in size (figure 2b), smaller than that of the pure Co3O4 particles (figure 2c), which were about 8.5–10 nm. The rate of nucleation of Co3O4 was higher with the existence of MWNTs, leading to smaller particle size of Co3O4.
Figure 2.

SEM image of Co3O4@MWNTs (a), TEM images of Co3O4@MWNTs (b) and Co3O4 (c), HRTEM image of Co3O4@MWNTs (d), energy dispersive X-ray spectroscopy spectrum (e) and distribution of Co atoms.
Typical HRTEM images of Co3O4@MWNTs showed lattice fringes with interplanar spacings of 0.22 and 0.246 nm, assignable to the (222) and (311) lattice planes of Co3O4, respectively (figure 2d), as with the pure Co3O4 (electronic supplementary material, figure S1b). These findings were consistent with the XRD results (figure 1a), indicating that Co3O4 had a good crystalline structure. The Co atoms showed a uniform distribution on the Co3O4@MWNTs (figure 2e), confirming that the Co3O4 particles were distributed equably on the surface of CNTs.
3.2. Reaction processes
To investigate the reaction mechanism of Co in the electrocatalysis, CV and XPS were conducted on Co3O4@MWNTs after different CV processes. We observed a pair of redox peaks at 0.57 V (oxidation) and 0.50 V (reduction). Interestingly, a weak oxidation peak appeared at about 0.32 V in the first cycle but disappeared in subsequent cycles (figure 3a).
Figure 3.

CV results of Co3O4@MWNTs in the first three cycles in 0.1 M KOH (a), survey XPS spectra of Co3O4@MWNTs (b), Co 2p core-levelled XPS spectrum of original Co3O4@MWNTs (c) and Co 2p core-levelled XPS spectrum of Co3O4@MWNTs after CV processes (0–0.4 V (d), 0–0.7 V (e) and 0.7–0 V (f)) shown in the insets, respectively.
The chemical composition of the Co3O4@MWNTs nanomaterial was detected by using XPS to characterize the Co oxidation state. Peaks corresponding to cobalt, oxygen and carbon were detected in the XPS spectra (figure 3b). The best deconvolution of the Co 2p profile was achieved with the assumption of seven species, including two pairs of spin-orbit doublets (indicating the coexistence of Co2+ and Co3+) and their three shakeup satellites (denoted as ‘sat’) [27]. The regional Co 2p spectrum revealed a high-energy band at 795.7 eV (Co 2p1/2) and a low-energy band at 780.4 eV (Co 2p3/2). These findings indicate the formation of Co3O4 on CNTs [28], as shown in figure 3c.
According to the CV results, the XPS measurement was conducted in three phases. Three identical electrodes were prepared as mentioned in the Electrochemical measurements section. CV experiments were performed at a scan rate of 1 mV s−1 with the three prepared electrodes as the working electrode in the range of 0–0.4, 0.4–0.7 and 0.7–0 V, respectively. Electrodes were removed from the electrolyte, cleaned with deionized water, dried at room temperature and subjected to XPS. The Co 2p core-levelled XPS spectrum of Co3O4@MWNTs and corresponding electrochemical processes are shown in figure 3d–f. When the CV of the original Co3O4@MWNTs was run to 0.32 V versus Ag/AgCl (inset of figure 3d), an oxidation peak appeared only in the first cycle. The ratio of Co2+ to Co3+ decreased from the Co 2p spectra in figure 3d compared to that in figure 3c, which indicates that Co2+ in Co3O4 was oxidized into Co3+ gradually in the electrochemical reaction. The reaction can be indexed to equation (3.1), as follows [13]:
| 3.1 |
As the reaction proceeded, an oxidation peak appeared at 0.57 V (inset of figure 3e), suggesting the oxidation of Co3+ into Co4+. This reaction can be indexed to the following equation (3.2) [13]:
| 3.2 |
However, Co4+ species were not found on the Co 2p spectra in figure 3e, perhaps due to the rapid reduction of CoO2 into Co3+ in air.
When the potential reached 0.7 V, where Co3O4@MWNTs were adequately oxidized, the negative scan was started. A reduction peak was observed at 0.5 V versus Ag/AgCl (inset of figure 3f), corresponding to the reverse reaction of equation (3.2). After completion of the first cycle (inset of figure 3f), the XPS of the material was detected again. The resulting Co 2p spectrum in figure 3f was similar to that in figure 3d because the CoOOH experienced quasi-reversible oxidation and reduction and finally reformed CoOOH.
3.3. Electrochemical performance
To investigate the electrochemical performance of the materials, CV measurements were conducted. Electronic supplementary material, figure S2 shows the CV results of Co3O4@MWNTs at different scan rates from 1 to 50 mV s−1. As scan rate decreased, the difference between the oxidation and reduction peaks (ΔEp) decreased, indicating the quasi-reversible oxidation and reduction of the composite. CV results of Co3O4@MWNTs (black line) and Co3O4 (blue line) were obtained under the same conditions, with 0.1 M KOH as electrolyte, scan rate of 5 mV s−1 and voltage range of 0–0.65 V. We added 3 mM glucose solution to the electrolyte to study the electrochemical catalytic activity of the materials. The results were shown in figure 4a, where the current density of Co3O4@MWNTs was much higher than that of Co3O4, for two reasons: on the one hand, Co3O4@MWNTs have better conductivity than that of pure Co3O4; on the other hand, smaller size of Co3O4 particles in Co3O4@MWNTs leads to higher contact area with the electrolyte. In figure 4a, the current density of the electrode loading Co3O4 and Co3O4@MWNTs shifted overall in the positive direction after the addition of 3 mM glucose solution. This shift can be explained as follows: in the oxidation reaction, once the glucose solution was added, the oxidation product CoO2 near the anode would be consumed, as indicated by equation (3.3) [13]. Thus, the concentration of the reactant CoOOH would increase, resulting in an increase of the oxidation current density. Similarly, in the reduction reaction, once the glucose solution was added, the reactant CoO2 would decrease, resulting in a decrease of the reduction current density [13]. Thus, the observed shift of the current density in the positive direction indicates that Co3O4 catalysed the GOR.
| 3.3 |
Figure 4.

(a) CV results of Co3O4@MWNTs and Co3O4 in 0.1 M KOH with 3.0 mM glucose or without glucose. (b) CV of Co3O4@MWNTs for 100 cycles in 0.1 M KOH. (c) Typical amperometric response of Co3O4@MWNTs/GCE at 0.55 V to successive addition of glucose in 0.1 M KOH. (d) Calibration curve versus glucose concentration.
The current density of the electrode loading the Co3O4@MWNTs had a stronger upward offset of 48.4% after 3 mM glucose was added to the electrolyte. This finding indicates that catalysis of the GOR by Co3O4@MWNTs was more effective than catalysis by pure Co3O4. The rapid reaction of CoO2 verified the phenomenon in figure 3e that there was no Co4+ observed, because CoO2 has a very strong oxidization and is reduced rapidly into Co3+. What is more, the cycle stability of the prepared Co3O4@MWNTs was detected by the CV for 100 cycles, as shown in figure 4b. There was nearly no decay with the curves, indicating a good cycle stability.
The real-time amperometric response of Co3O4@MWNTs to glucose was obtained by successive addition of increasing concentrations of glucose to the stirred 0.1 M KOH at 0.55 V (figure 4c). The fast response should be attributed to the contribution of the large surface of the Co3O4@MWNTs, excellent conductivity of CNTs, and good catalytic ability of the Co3O4 attached to the MWNTs. The electrode loading Co3O4@MWNTs responds linearly to glucose up to 5.8 mM, which can be used for the determination of glucose in blood samples (3–8 mM) [11]. The limit of detection is as low as 2 µM (S/N = 3). The linear range of the electrode loading Co3O4@MWNTs is up to 11 mM (correlation coefficient greater than 0.9823). Compared with some reported materials used for the determination of glucose, shown in table 1, Co3O4@MWNTs exhibit wider linear range, lower limit of determination and good sensitivity.
Table 1.
The performance of different electrode materials used for glucose biosensor.
3.4. Performance of the fuel cell
A GFC was constructed with Co3O4@MWNTs as the anode material, due to its excellent ability to catalyse the GOR. As shown in figure 5a, our enzyme-free GFC is highly stable. The open circuit voltage drops only 27%. Figure 5b presents the voltage–current relation of the fuel cell with varying load resistance and corresponding power output, in the presence of 100 mM glucose. Some reported materials used for the glucose fuel cell were listed in table 2, from which the Co3O4@MWNTs showed higher open circuit voltage, short-circuit current density and power density. The glucose–O2 fuel cell exhibited an open circuit voltage of 0.68 V and short-circuit current density of 1.46 mA cm−2. The maximum power density of the glucose–O2 fuel cell was 0.22 mW cm−2 at 0.30 V.
Figure 5.

(a) The open circuit voltage from one cell over 15 days. (b) Voltage–current relation and power output of the fuel cell in the presence of 100 mM glucose. Blue line is the fitting of the power output.
Table 2.
The performance of different electrode materials used for glucose fuel cell.
4. Conclusion
We successfully fabricated a high-performance nonenzymatic catalyst of Co3O4@MWNTs by a facile hydrothermal method. We studied the electrocatalytic mechanism of Co3O4@MWNTs through the state of the Co atoms. This mechanism can be explained as follows: Co3O4 are translated into CoOOH in KOH solution, and subsequently cycle between CoOOH and CoO2 in the electrochemical catalytic reactions. The Co3O4@MWNTs nanoarchitectures show high electrocatalytic activity for glucose oxidation. With its high open circuit voltage of 0.68 V and short-circuit current density of 1.46 mA cm−2, the Co3O4@MWNTs can be used as electrode materials in a GFC.
Supplementary Material
Data accessibility
The datasets supporting this article have been uploaded as part of the electronic supplementary material.
Authors' contributions
K.J. and Y.J. carried out the laboratory work, participated in data analysis, participated in the design of the study and drafted the manuscript; Z.K., R.P. and S.J. collected field data; Z.H. conceived of the study, designed the study, coordinated the study and helped draft the manuscript. All authors gave final approval for publication.
Competing interests
We have no competing interests.
Funding
This work was supported by National Natural Science Foundation of China through grants 81301345 and 61402486.
References
- 1.Chen Y, Prasad KP, Wang X, Pang H, Yan R, Than A, Chan-Park MB, Chen P. 2013. Enzymeless multi-sugar fuel cells with high power output based on 3D graphene–Co3O4 hybrid electrodes. Phys. Chem. Chem. Phys. 15, 9170–9176. (doi:10.1039/c3cp51410b) [DOI] [PubMed] [Google Scholar]
- 2.Moehlenbrock MJ, Minteer SD. 2008. Extended lifetime biofuel cells. Chem. Soc. Rev. 37, 1188–1196. (doi:10.1039/b708013c) [DOI] [PubMed] [Google Scholar]
- 3.Cooney MJ, Svoboda V, Lau C, Martin G, Minteer SD. 2008. Enzyme catalysed biofuel cells. Energy Environ. Sci. 1, 320–337. (doi:10.1039/b809009b) [Google Scholar]
- 4.Liu Y, Higgins DC, Wu J, Fowler M, Chen Z. 2013. Cubic spinel cobalt oxide/multi-walled carbon nanotube composites as an efficient bifunctionalelectrocatalyst for oxygen reaction. Electrochem. Commun. 34, 125–129. (doi:10.1016/j.elecom.2013.05.035) [Google Scholar]
- 5.Spets JP, Lampinen MJ, Kiros Y, Rantanen J, Anttila T. 2012. Direct glucose fuel cell with the anion exchange membrane in the near-neutral-state electrolyte. Int. J. Electrochem. Sci. 7, 11696. [Google Scholar]
- 6.Chu M, Zhang Y, Yang L, Tan Y, Deng W, Ma M, Su X, Xie Q, Yao S. 2013. A compartment-less nonenzymatic glucose–air fuel cell with nitrogen-doped mesoporous carbons and Au nanowires as catalysts. Energy Environ. Sci. 6, 3600 (doi:10.1039/c3ee41904e) [Google Scholar]
- 7.Elouarzaki K, Le Goff A, Holzinger M, Thery J, Cosnier S. 2012. Electrocatalytic oxidation of glucose by rhodium porphyrin-functionalized MWCNT electrodes: application to a fully molecular catalyst-based glucose/O2 fuel cell. J. Am. Chem. Soc. 134, 14 078–14 085. (doi:10.1021/ja304589m) [DOI] [PubMed] [Google Scholar]
- 8.Zhao Y, Fan L, Gao D, Ren J, Hong B. 2014. High-power non-enzymatic glucose biofuel cells based on three-dimensional platinum nanoclusters immobilized on multiwalled carbon nanotubes. Electrochim. Acta 145, 159–169. (doi:10.1016/j.electacta.2014.09.006) [Google Scholar]
- 9.Ci S, Wen Z, Mao S, Hou Y, Cui S, He Z, Chen J. 2015. One-pot synthesis of high-performance Co/graphene electrocatalysts for glucose fuel cells free of enzymes and precious metals. Chem. Commun. 51, 9354–9357. (doi:10.1039/C5CC01462J) [DOI] [PubMed] [Google Scholar]
- 10.Slaughter G, Kulkarni T. 2016. Fabrication of palladium nanowire array electrode for biofuel cell application. Microelectron. Eng. 149, 92–96. (doi:10.1016/j.mee.2015.09.019) [Google Scholar]
- 11.Yang L, Zhang Y, Chu M, Deng W, Tan Y, Ma M, Su X, Xie Q, Yao S. 2014. Facile fabrication of network film electrodes with ultrathin Au nanowires for nonenzymatic glucose sensing and glucose/O2 fuel cell. Biosens. Bioelectron. 52, 105–110. (doi:10.1016/j.bios.2013.08.038) [DOI] [PubMed] [Google Scholar]
- 12.Lin Y, Ren J, Qu X. 2014. Nano-gold as artificial enzymes: hidden talents. Adv. Mater. 26, 4200–4217. (doi:10.1002/adma.201400238) [DOI] [PubMed] [Google Scholar]
- 13.Zhang E, Xie Y, Ci S, Jia J, Wen Z. 2016. Porous Co3O4 hollow nanododecahedra for nonenzymatic glucose biosensor and biofuel cell. Biosens. Bioelectron. 81, 46–53. (doi:10.1016/j.bios.2016.02.027) [DOI] [PubMed] [Google Scholar]
- 14.Liu XW, Pan P, Zhang ZM, Guo F, Yang ZC, Wei J, Wei Z. 2016. Ordered self-assembly of screen-printed flower-like CuO and CuO/MWCNTs modified graphite electrodes and applications in non-enzymatic glucose sensor. J. Electroanal. Chem. 763, 37–44. (doi:10.1016/j.jelechem.2015.12.039) [Google Scholar]
- 15.Zhou ZY, Tian N, Li JT, Broadwell I, Sun SG. 2011. Nanomaterials of high surface energy with exceptional properties in catalysis and energy storage. Chem. Soc. Rev. 40, 4167–4185. (doi:10.1039/c0cs00176g) [DOI] [PubMed] [Google Scholar]
- 16.Liu X, Wang D, Li Y. 2012. Synthesis and catalytic properties of bimetallic nanomaterials with various architectures. Nano Today 7, 448–466. (doi:10.1016/j.nantod.2012.08.003) [Google Scholar]
- 17.Gu J, Zhang YW, Tao F. 2012. Shape control of bimetallic nanocatalysts through well-designed colloidal chemistry approaches. Chem. Soc. Rev. 41, 8050–8065. (doi:10.1039/c2cs35184f) [DOI] [PubMed] [Google Scholar]
- 18.Liang Y, Li Y, Wang H, Zhou J, Wang J, Regier T, Dai H. 2011. Co3O4 nanocrystals on graphene as a synergistic catalyst for oxygen reduction reaction. Nat. Mater. 10, 780–786. (doi:10.1038/nmat3087) [DOI] [PubMed] [Google Scholar]
- 19.Xie X, Li Y, Liu ZQ, Haruta M, Shen W. 2009. Low-temperature oxidation of CO catalysed by Co3O4 nanorods. Nature 458, 746–749. (doi:10.1038/nature07877) [DOI] [PubMed] [Google Scholar]
- 20.Xie X, Shen W. 2010. Morphology control of cobalt oxide nanocrystals for promoting their catalytic performance. Nanoscale 41, 50. [DOI] [PubMed] [Google Scholar]
- 21.Lu H, Huang Y, Yan J, Fan W, Liu T. 2015. Nitrogen-doped graphene/carbon nanotube/Co3O4 hybrids: one-step synthesis and superior electrocatalytic activity for the oxygen reduction reaction. Rsc Adv. 5, 94 615–94 622. (doi:10.1039/C5RA17759F) [Google Scholar]
- 22.Liang Y, et al. 2012. Oxygen reduction electrocatalyst based on strongly coupled cobalt oxide nanocrystals and carbon nanotubes. J. Am. Chem. Soc. 134, 15 849–15 857. (doi:10.1021/ja305623m) [DOI] [PubMed] [Google Scholar]
- 23.Guo S, Dong S. 2011. Graphene nanosheet: synthesis, molecular engineering, thin film, hybrids, and energy and analytical applications. Chem. Soc. Rev. 40, 2644 (doi:10.1039/c0cs00079e) [DOI] [PubMed] [Google Scholar]
- 24.Sgobba V, Guldi DM. 2009. Carbon nanotubes—electronic/electrochemical properties and application for nanoelectronics and photonics. Chem. Soc. Rev. 38, 165–184. (doi:10.1039/B802652C) [DOI] [PubMed] [Google Scholar]
- 25.Eder D. 2010. Carbon nanotube—inorganic hybrids. Chem. Rev. 110, 1348–1385. (doi:10.1021/cr800433k) [DOI] [PubMed] [Google Scholar]
- 26.Xu J, Gao P, Zhao TS. 2012. Non-precious Co3O4 nano-rod electrocatalyst for oxygen reduction reaction in anion-exchange membrane fuel cells. Energy Environ. Sci. 5, 5333–5339. (doi:10.1039/C1EE01431E) [Google Scholar]
- 27.Fu L, Liu Z, Liu Y, Han B, Hu P, Cao L, Zhu D. 2005. Beaded cobalt oxide nanoparticles along carbon nanotubes: towards more highly integrated electronic devices. Adv. Mater. 17, 217–221. (doi:10.1002/adma.200400833) [Google Scholar]
- 28.Fang Y, et al. 2015. Ultrasonication-assisted ultrafast preparation of multiwalled carbon nanotubes/Au/Co3O4 tubular hybrids as superior anode materials for oxygen evolution reaction. J. Power Sources 300, 285–293. (doi:10.1016/j.jpowsour.2015.09.049) [Google Scholar]
- 29.Wang X, Dong X, Wen Y, Li C, Xiong Q, Chen P. 2012. A graphene–cobalt oxide based needle electrode for non-enzymatic glucose detection in micro-droplets. Chem. Commun. 48, 6490 (doi:10.1039/c2cc32674d) [DOI] [PubMed] [Google Scholar]
- 30.Wang L, Zhang Y, Xie Y, Yu J, Yang H, Miao L, Song Y. 2017. Three-dimensional macroporous carbon/hierarchical Co3O4 nanoclusters for nonenzymatic electrochemical glucose sensor. Appl. Surf. Sci. 402, 47–52. (doi:10.1016/j.apsusc.2017.01.062) [Google Scholar]
- 31.Li Y, Song YY, Yang C, Xia XH. 2007. Hydrogen bubble dynamic template synthesis of porous gold for nonenzymatic electrochemical detection of glucose. Electrochem. Commun. 9, 981–988. (doi:10.1016/j.elecom.2006.11.035) [Google Scholar]
- 32.Meng F, Shi W, Sun Y, Zhu X, Wu G, Ruan C, Liu X, Ge D. 2013. Nonenzymatic biosensor based on CuxO nanoparticles deposited on polypyrrole nanowires for improving detection range. Biosens. Bioelectron. 42, 141–147. (doi:10.1016/j.bios.2012.10.051) [DOI] [PubMed] [Google Scholar]
- 33.Wang C, Yin L, Zhang L, Gao R. 2010. Ti/TiO2 nanotube array/Ni composite electrodes for nonenzymatic amperometric glucose sensing. J. Phys. Chem. C 114, 4408–4413. (doi:10.1021/jp912232p) [Google Scholar]
- 34.Liu C, Alwarappan S, Chen Z, Kong X, Li CZ. 2010. Membraneless enzymatic biofuel cells based on graphene nanosheets. Biosens. Bioelectron. 25, 1829 (doi:10.1016/j.bios.2009.12.012) [DOI] [PubMed] [Google Scholar]
Associated Data
This section collects any data citations, data availability statements, or supplementary materials included in this article.
Supplementary Materials
Data Availability Statement
The datasets supporting this article have been uploaded as part of the electronic supplementary material.