

Abstract
PURPOSE
To measure choroidal thickness on spectral-domain optical coherence tomography (SD OCT) images using automated algorithms and to correlate choroidal pathology with retinal changes attributable to diabetic macular edema (DME).
DESIGN
Post hoc analysis of multicenter clinical trial baseline data.
METHODS
SD OCT raster scans/fluorescein angiograms were obtained from 284 treatment-naïve eyes of 142 patients with clinically significant DME and from 20 controls. Three-dimensional (3D) SD OCT images were evaluated by a certified independent reading center analyzing retinal changes associated with diabetic retinopathy. Choroidal thicknesses were analyzed using a fully automated algorithm. Angiograms were assessed manually. Multiple endpoint correction according to Bonferroni-Holm was applied. Main outcome measures were average retinal/choroidal thickness on fovea-centered or peak of edema (thickest point of edema)–centered Early Treatment Diabetic Retinopathy Study grid, maximum area of leakage, and the correlation between retinal and choroidal thicknesses.
RESULTS
Total choroidal thickness is significantly reduced in DME (175 ± 23 μm; P = .0016) and nonedematous fellow eyes (177 ± 20 μm; P = .009) of patients compared with healthy control eyes (190 ± 23 μm). Retinal/choroidal thickness values showed no significant correlation (1-mm: P = .27, r2 = 0.01; 3-mm: P = .96, r2 < 0.0001; 6-mm: P = .42, r2 = 0.006). No significant difference was found in the 1- or 3-mm circle of a retinal peak of edema–centered grid. All other measurements of choroidal/retinal thickness (DME vs healthy, DME vs peak of edema–centered, DME vs fellow, healthy vs fellow, peak of edema–centered vs healthy, peak of edema–centered vs fellow eyes) were compared but no statistically significant correlation was found. By tendency a thinner choroid correlates with larger retinal leakage areas.
CONCLUSIONS
Automated algorithms can be used to reliably assess choroidal thickness in eyes with DME. Choroidal thickness was generally reduced in patients with diabetes if DME is present in 1 eye; however, no correlation was found between choroidal/retinal pathologies, suggesting different pathogenetic pathways.
Half a century ago, yanoff proposed that the choroid influences the pathogenesis of diabetic retinopathy,1 and for almost 30 years it has been known that choroidal vasculopathy plays an important role in the pathogenesis of diabetic retinopathy.2 The choroidal vasculature, especially the choriocapillaris, is critical for maintenance of the neurosensory retina because it supplies the outer retina with nutrition and oxygen. It is most important in the foveal avascular zone.3,4
Before 3-dimensional optical coherence tomography (OCT) was introduced in the 1990s, choroidal structures could be examined 3-dimensionally only in enucleated or post mortem eyes or 2-dimensionally, where indocyanine green angiography was the only available method. However, angiography images and findings from enucleated eyes are difficult to interpret.5 Recently, OCT and related new analysis techniques provided the first opportunity to image the retina and underlying tissues, including the choroid, in vivo and to assess choroidal vessels in patients with diabetic retinopathy. Thus, the choroid can now be monitored in different stages of diabetic retinopathy.
OCT is a noninvasive, cross-sectional imaging technique for biological material such as the human retina and uses low-coherence interferometry to produce an image from optical scattering.6 New imaging techniques including long-wavelength OCT, polarization-sensitive OCT, and standard spectral-domain (SD) OCT with an enhanced depth-imaging mode allow more detailed observation of choroidal thickness.7–11 These possibilities have triggered a substantial scientific interest in the choroidal vasculature in ocular pathology, especially in retinal vascular diseases such as diabetic retinopathy and diabetic macular edema (DME).
Earlier studies suggest that choroidal thickness is decreased in DME, but the studies were usually limited by manual analysis or a small number of patients or acquired scans. Therefore the relevance of these observations needs to be tested more objectively in larger data sets and using dense raster scanning OCT.7,8,12
Clinical application of quantitative choroidal analysis is limited by the need for specific scanning protocols or equipment, the laborious evaluation process and variability of manual delineation, or use of single scans. Thus, automated segmentation of the choroid has been developed and validated.13 In this study, we investigated the choroidal vasculature in diabetic macular edema using automated 3-dimensional segmentation in standard clinical SD OCT images. The level of potential choroidal pathology in this disease was measured over the entire posterior pole and correlated with concomitant retinal vascular alteration to gain insight into a possible association between retinal and choroidal pathology in a disease that is one of the leading causes of blindness in the elderly, a large and growing population.
Some studies have automatically segmented the choroid using different algorithms on standard SD OCT, but exclusively in healthy people or patients with dry age-related macular disease.11,13 To our knowledge, the present study is the first to automatically evaluate choroidal thickness on standard SD OCT over the entire posterior pole and correlate the findings at the choroidal level with the presence and extent of diabetic macular disease in a large and representative group of patients.
METHODS
PATIENT GROUP
SD OCT raster scans (512 × 128) (Cirrus; Carl Zeiss Meditec, Dublin, California, USA; software version 3.0.0.64 or later) and corresponding fluorescein angiograms from 142 patients with treatment-naïve DME in the study eye were analyzed. Images in the baseline data sets of a large multicenter clinical study were processed by the Vienna Reading Center. The data used were from patients with DME and no other confounding retinal disease. Ethical approval was obtained from the institution’s review board. Each patient gave informed consent before inclusion in the study. The study adhered to the tenets of the Declaration of Helsinki and the standards of Good Scientific Practice of the Medical University of Vienna. The images were taken at each study site according to the same predetermined scanning protocol to guarantee a standardized procedure.
Inclusion criteria for the study were age over 18 years, treatment naivety (for at least 3 months before scanning with OCT), and DME attributable to nonproliferative diabetic retinopathy. At least 1 eye had to be affected by clinically significant DME (as diagnosed by the investigator, an ophthalmologist trained in diagnosis of clinically significant macular edema) with a central retinal thickness (CRT) >300 μm. Clinically significant macular edema was defined as ‘‘retinal thickening that involves or threatens the center of the macula (even if visual acuity is not yet reduced)’’ according to the Early Treatment Diabetic Retinopathy Study Report 1.14 Exclusion criteria were ocular opacity attributable to cataract, vitreous opacification or corneal opacities that might lead to poor image quality, history of any other vitreoretinal disease or treatment, and high myopia ≥8 diopters. The control group comprised healthy volunteers of whom at least 50% were aged 50 years or older. The healthy control and patient groups had no history of ocular disease and no ocular opacity attributable to cataract or vitreous opacification that might lead to poor image quality. Study patients’ eyes were divided into 3 groups: study eyes with DME, non-study fellow eyes with DME, and non-study fellow eyes without DME.
SPECTRAL-DOMAIN OPTICAL COHERENCE TOMOGRAPHY ANALYSIS OF RETINAL AND CHOROIDAL ALTERATION
OCT images underwent automatic analysis at the University of Iowa and manual evaluation by certified graders of the Vienna Reading Center. As a first step, the retinal layer segmentation of 10 intraretinal surfaces and Bruch’s membrane were detected automatically using the graph-based multilayer segmentation approach, called the Iowa Reference Algorithm.15,16 Errors in the segmentation of the Bruch’s membrane were systematically evaluated and large deviations were corrected manually by the reading center (Figure 1, Top). Afterwards the fully automated choroidal volume assessment could be performed. After flattening the image along the Bruch’s membrane (to reduce geometric distortion; Figure 1, Upper center), an automated vessel segmentation algorithm was applied to identify vessel shadowing effects and to smoothen the images to prevent shadows being identified as choroidal vessels (Figure 1, Lower center).13
FIGURE 1.

Choroidal volume assessment on standard spectral-domain optical coherence tomography by a 4-step process of automated choroidal thickness calculation. Images underwent automatical analysis. The figure shows the segmentation on a Cirrus 512 × 128 macular cube scan by a single B-scan. The entire segmentation was performed 3-dimensionally. As a first step, the retinal layer segmentation including Bruch’s membrane (blue line) was detected automatically. Errors in the segmentation of the Bruch’s membrane were corrected manually (Top). This was followed by the fully automated choroidal volume assessment. After flattening the image along the Bruch’s membrane (Upper center), an automated vessel segmentation algorithm was applied to identify vessel shadowing effects and to smoothen the images to prevent shadows being identified as choroidal vessels (Lower center). A pair of thin-plate splines was fitted on each side of the choroidal vasculature (red and green lines), which allowed quantification of choroidal thickness for each A-scan (Bottom). The thickness between the red and blue lines shows the choriocapillaris equivalent thickness.
As a next step, the entire choroidal vasculature was segmented using an automated method for 3-dimensional segmentation of choroidal vasculature13 that includes Hessian detection of 3-dimensional cylindrical features and probabilistic identification of vasculature seed points. Region-growing segmentation to determine choroidal vasculature followed (Figure 2). A pair of thin-plate splines was fitted on each side of the choroidal vasculature, which allowed quantification of choroidal thickness for each A-scan (Figure 1, Bottom, thickness between the red and green lines).17 Similarly, the distance between the inner surface (thin-plate spline) of the choroidal vasculature and the Bruch’s membrane was defined as the choriocapillaris equivalent, and its thickness was calculated automatically for each A-scan (Figure 1, Bottom, thickness between the blue and red lines).13 The sum of the 2 choroidal layers was defined as choroidal thickness in this study.
FIGURE 2.

Choroidal vessel detection illustrated on the en face choroidal image from the macular cube scan without segmentation, with the projection of the segmentation into the en face image and the 3-dimensional reconstruction of the vessels. The entire choroidal vasculature was segmented using an automated method for 3-dimensional segmentation of choroidal vasculature that includes Hessian detection of 3-dimensional cylindrical features and probabilistic identification of vasculature seed points. Region-growing segmentation to determine choroidal vasculature followed. The figure shows the en face choroidal image before segmentation (Left), the choroidal vessel segmentation (Center), and the 3-dimensional segmentation projection image as a result (Right).
To assure grading of the same position at the posterior pole, the fovea was checked and, if necessary, manually replotted by experienced graders from the Vienna Reading Center to ensure that the Early Treatment Diabetic Retinopathy Study (ETDRS) grids were in the same position in each image stack (Figure 3, Top). Image stacks with obvious segmentation errors in the Bruch’s membrane were corrected manually or excluded if manual repositioning of this surface’s segmentation was not possible (eg, owing to poor image quality). All images with an insufficient quality of Bruch’s membrane or where parts of the data set were missing (eg, fluorescein angiograms) were excluded from statistical analysis. The retinal and choroidal thicknesses between the internal limiting membrane and Bruch’s membrane and between the Bruch’s membrane and the outer choroidal limiting membrane were calculated automatically in all 9 subfields. A second grid was centered at the peak of edema to allow comparison of the values from the grids to each other and to retinal and choroidal values in the peak region (Figure 3, Bottom). All values were calculated in micrometers (μm). Finally, all insufficient segmentation results (defined as segmentation where >50% of choroidal vessels in 6 mm × 6 mm could not be detected automatically) were identified manually (Figure 4).
FIGURE 3.

Process of Early Treatment Diabetic Retinopathy Study (ETDRS) grid positioning distinguishing between fovea-centered and edema-centered grid positions. The fovea was checked and, if necessary, manually replotted by experienced graders from the Vienna Reading Center to ensure that the ETDRS grids were in the same position in each image stack and to assure grading of the same position at the posterior pole (Top). A second grid was centered at the peak of edema (thickest point of edema) to allow comparison of the values from the grids to each other (Bottom). The figure shows the central B-scan of each grid position (right; fovea or peak of edema; yellow, center point; light blue, 1 mm subcircle; blue, 3 mm subcircle; dark blue, 6 mm subcircle of grid) and the corresponding retinal surface image (Left) with the retinal thickness map and the ETDRS grid plotted on it (thick-normal-thin equals red-yellow-green on the thickness map; see above for grid subcircle colors).
FIGURE 4.

Examples of segmentation failure cases after choroidal volume assessment on standard spectral-domain optical coherence tomography by automated choroidal thickness calculation. After segmentation of choroidal thickness in all scans, all insufficient segmentation results, where >50% of choroidal vessels could not be detected automatically, were identified manually. These segmentation failure cases were excluded. The figure shows 1 sufficient segmentation result (Left) and 2 insufficient segmentation results of different severity (Center, Right). For each example 1 B-scan (Top) with the resulting 3-dimensional segmentation result (Bottom) of the entire macula cube is displayed.
ANGIOGRAPHIC DELINEATION OF LEAKAGE AREAS
Analysis of fluorescein angiograms was confined to measurement of the maximum area of leakage in the late phase. The timing of the late phase is strictly set within a standardized reading center trial and was therefore the same for each angiogram. The measurements were performed within a reading center setting. The pixel number and size were standardized in all images before inclusion of study sites in the multicenter trial using the Vienna Reading Center’s test eye procedure to allow measurement of the area in mm2 with reference to the SISPOT test eye. To define the maximum area of leakage, the total area of hyperfluorescence of the macula in the late-phase image compared with the early-phase image was marked manually with ImageJ (Version 1.46r)18 by experienced and certified graders of the Vienna Reading Center under continuous supervision by senior retinal specialists. Staining areas and window defects were not included.
CORRELATION OF RETINAL AND CHOROIDAL DISEASE
Retinal and choroidal (choriocapillaris) mean thickness values were calculated in all ETDRS subcircles of eyes with DME manually centered on the fovea or on the peak of edema, and in non-DME fellow eyes, DME fellow eyes, and healthy eyes. The correlation between each retinal and choroidal thickness value in the same patient group at the same position was calculated. As a next step, choroidal thickness values were compared between the patient groups, that is, values of DME fovea-centered vs DME peak of edema–centered ETDRS grids, DME fovea-centered vs non-DME fellow eyes, DME fovea-centered vs DME fellow eyes, DME fovea-centered vs healthy eyes, DME peak of edema–centered vs non-DME fellow eyes, DME peak of edema–centered vs DME fellow eyes, DME peak of edema–centered vs healthy eyes, non-DME fellow vs DME fellow eyes, non-DME fellow vs healthy eyes, and DME fellow vs healthy eyes. Furthermore, mean leakage area was calculated and compared with choroidal thickness values to assess differential effects of diabetic conditions on the retinal and the choroidal vasculature.
STATISTICAL ANALYSIS
Statistical comparisons were done by nonparametric methods: Mann-Whitney tests for comparison of independent groups and Wilcoxon matched-pairs tests for within-participant comparisons. Relations between continuous variables were inspected by scatterplots and, if found, linear Pearson correlation coefficients were computed. In all tests, P values below .05 were considered significant. Multiple endpoint correction according to Bonferroni-Holm was applied, and P values were adjusted for significance.
RESULTS
A total of 142 patients were included in the study Twenty-seven patients (19%) were excluded because of poor image quality, preventing segmentation of the Bruch’s membrane (automatically or manually), or because of missing fluorescein angiograms. Accordingly, data from 115 patients (81%) were processed by automated analysis. In less than 5% of the images the Bruch’s membrane was not segmented correctly.
The Table shows the mean retinal and choroidal thicknesses in all ETDRS grid subcircles centered on the fovea and centered on the peak of edema in the study eyes with DME. The Table also shows the mean retinal and choroidal thicknesses in all ETDRS grid subcircles centered on the fovea in the fellow eyes without DME and the overall choroidal thickness in the healthy control group.
TABLE.
Retinal and Choroidal Thicknesses in Fovea-Centered and Edema-Centered Early Treatment Diabetic Retinopathy Study Grid Fields in Eyes of Patients With Diabetic Macular Edema, Their Fellow Eyes, and Eyes of the Healthy Control Groupa
| 1 mm | 3 mm | 6 mm | 1 mm | 3 mm | 1 mm | 3 mm | 6 mm | 6 mm | |
|---|---|---|---|---|---|---|---|---|---|
| Fovea | Fovea | Fovea | Edema | Edema | Fellow | Fellow | Fellow | Healthy | |
| Retina | 427 | 415 | 380 | 442 | 391 | 426 | 415 | 381 | n/a |
| Choroid | 170 | 173 | 175 | 155 | 158 | 171 | 174 | 177 | 190 |
The table shows the mean retinal and choroidal thicknesses in all Early Treatment Diabetic Retinopathy Study grid subcircles centered on the fovea and centered on the peak of edema (thickest point of edema) in the study eyes with diabetic macular edema. The table also shows the mean retinal and choroidal thicknesses in all Early Treatment Diabetic Retinopathy Study grid subcircles centered on the fovea in the fellow eyes without diabetic macular edema and the overall choroidal thickness in the healthy control group, also centered on fovea; all values are mean thicknesses in micrometers (μm).
Mean overall choroidal thickness in the 6-mm region on the foveal grid was 175 ± 23 μm in eyes with DME, 190 ± 23 μm in healthy eyes, and 177 ± 20 μm in fellow eyes without DME. Accordingly, a statistically significant difference was shown between the overall choroidal thickness in the central 6-mm region in eyes of patients with DME and those of the healthy control group, with the choroidal layer statistically significantly thinner in DME than in healthy eyes (Figure 5, Mann-Whitney U test, P = .0016, corrected after Bonferroni-Holm P = .003). Figure 6 shows 4 examples of choroidal thicknesses in all ETDRS grid subfields from the group of patients with DME.
FIGURE 5.
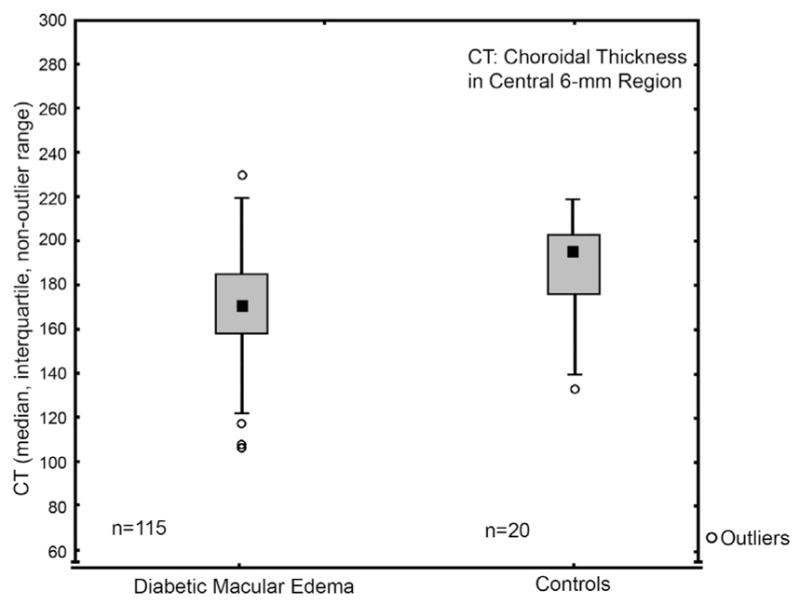
Choroidal thickness comparisons of patients’ eyes with diabetic macular edema to healthy controls’ eyes over the entire posterior pole (6-mm region). Mean overall choroidal thickness in the 6-mm region on the foveal grid was 175 ± 23 μm in patients’ eyes with diabetic macular edema and 190 ± 23 μm in the controls’ healthy eyes. Accordingly, a statistically significant difference was shown between the overall choroidal thickness in the central 6 mm in eyes of patients with DME and those of the healthy control group, with the choroidal layer statistically significantly thinner in diabetic macular edema than in healthy eyes (Mann-Whitney U test, P = .0016, corrected after Bonferroni-Holm P = .003).
FIGURE 6.

Four examples of choroidal thicknesses in patients with diabetic macular edema after automated choroidal thickness calculation in 9 Early Treatment Diabetic Retinopathy Study (ETDRS) grids centered on the fovea. The pattern of choroidal thickness observed in earlier studies, where choroidal thickness values are usually highest subfoveally and decrease nasally and sometimes inferiorly, can be observed.
There was no statistically significant difference in overall choroidal thickness between patients’ study eyes with DME and their fellow eyes without DME (Figure 7, Mann-Whitney U test, P > .3–.7).
FIGURE 7.
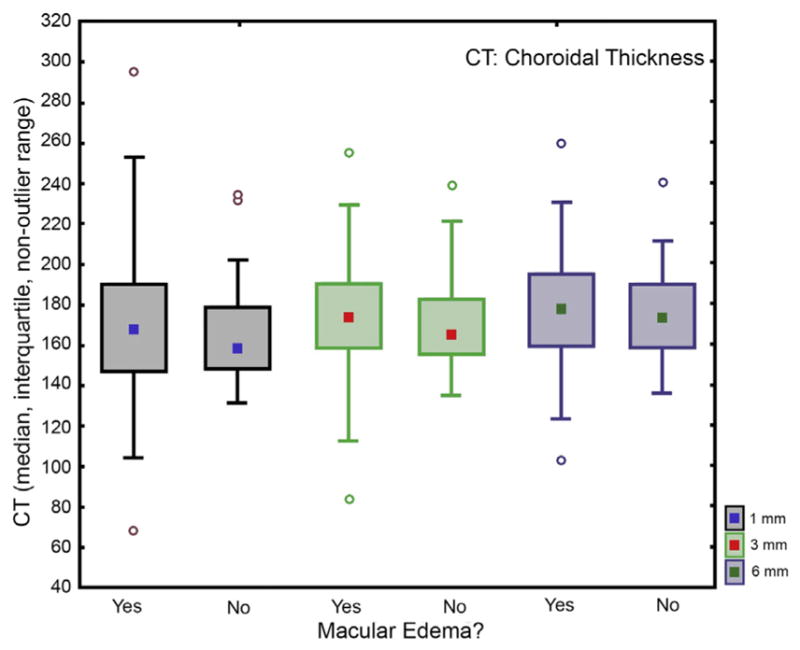
Choroidal thickness comparison of patients’ eyes with diabetic macular edema to their fellow eyes without diabetic macular edema over the entire posterior pole (6-mm region). Mean overall choroidal thickness in the 6-mm region on the foveal grid was 175 ± 23 μm in patients’ eyes with diabetic macular edema and 177 ± 20 μm in their fellow eyes without diabetic macular edema. Accordingly, no statistically significant difference was shown between the overall choroidal thickness in the central 6-mm region in patients’ eyes with diabetic macular edema and their fellow eyes without macular edema, with the choroidal layer statistically of same thickness in both groups (Mann-Whitney U test, P >.3–.7).
A statistically significant difference was also found between the overall choroidal thickness in the central 6-mm region in eyes of patients’ non-DME fellow eyes and those of the healthy control group, with the choroidal layer statistically significantly thinner in patients’ eyes than in healthy eyes (Mann-Whitney U test, P = .009).
Choroidal thickness maps revealed the typical choroidal thickness distribution (nasal vs temporal, superior vs inferior).17 This pattern was the same for healthy control and affected eyes. In eyes with choroidal thinning, a similar reduction was seen over the entire posterior pole. There was no statistically significant difference in choroidal thinning between eyes with a nonedematous retina and those with retinal edema overlying the choroid.
Retinal and choroidal thicknesses were calculated individually for choroidal thickness vs retinal thickness over the central foveal millimeter: r = 0.1037; P = .2703; choroidal thickness vs retinal thickness 3 mm diameter from ETDRS grid: r = −0.0053; P = .9554; choroidal thickness vs retinal thickness 6 mm diameter from ETDRS grid: r = −0.0759; P = .4202. No statistically significant correlation could be detected (linear Pearson correlation). In addition, no statistically significant correlation could be detected between retinal and choroidal thicknesses at the center or at the peak of edema, except for a trend toward thinning choroid in thickened retina (Figure 8, P = .06, Wilcoxon matched-pairs test). No significant correlation could be detected for the 5 fields comprising the 3-mm sub-field around the peak of edema (Figure 8, P = .34, Wilcoxon matched-pairs test).
FIGURE 8.
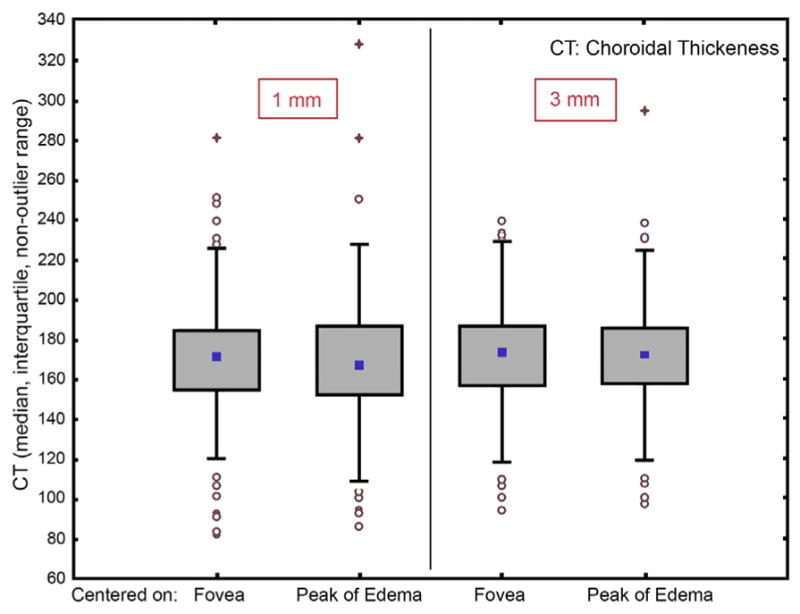
Correlation of choroidal thickness with the level of diabetic macular edema represented by retinal thickness after automated calculation of both thicknesses in fovea-centered and edema-centered grids. Retinal and choroidal thicknesses were calculated individually for an Early Treatment Diabetic Retinopathy Study grid centered on the fovea in comparison to a second grid centered on the peak of edema (thickest point of edema). No statistically significant correlation could be detected between these 2 grids except for a trend toward thinning choroid in thickened retina (P = .06, Wilcoxon matched-pairs test), nor could a significant correlation be detected for the 5 fields comprising the 3-mm subfield around the peak of edema (P = .34, Wilcoxon matched-pairs test).
All other measurements of choroidal and retinal thicknesses (diabetic macular edema vs healthy control eyes, diabetic macular edema vs peak of edema eyes, diabetic macular edema vs fellow eyes, healthy control vs fellow eyes, peak of edema vs healthy control eyes, peak of edema vs fellow eyes) were compared but no statistically significant correlation was found.
The mean retinal leakage area in the study eyes with DME was 23 mm2. A minimal negative correlation was found between leakage area and choroidal thickness in these eyes (P = .26, r2 = 0.01, linear Pearson correlation). Therefore, a tendency for a thinner choroidal layer with larger leakage areas can be assumed.
When retinal images identified as poor-quality fully automated choroidal segmentation were excluded (approximately one fifth of the data sets), none of the results were any different from those obtained when including poor-quality fully automated choroidal segmentation images.
DISCUSSION
Until recently, manual segmentation has been used in all clinical studies based on SD OCT to determine choroidal thickness in pathologic conditions.8,10,19 From long reading center experience, manual segmentation is less prone to serious segmentation errors when readers are well trained, as shown by intra- and inter-reading center reproducibility studies,20,21 but no individual reader can locate a clearly outlined border as accurately as a standardized algorithm, especially if complete data sets of 3-dimensional information are included. Moreover, data from large samples and huge populations are not accessible for manpower-based analysis. The advantages of automated analysis are high reproducibility, zero intra- and inter-observer variability, and full use of the 3-dimensional information available in the scan volume. In comparison to earlier studies that usually use only 1 single subfoveal measurement, this study used over 65 000 available scanning points (512 × 128 = 65 536 scanning points) from the entire available set of B-scans.7,12,22 With our approach of ‘‘manually controlled’’ automated segmentation, we can potentially achieve optimum outcomes by using human expertise combined with algorithmic accuracy.
This clinical study is the first investigation to analyze choroidal thickness in patients with DME in a large group of patients (n = 142 patients, n = 284 eyes). Other scientific studies have analyzed small groups (n = 18–63 patients) or used experimental types of OCT technologies only.7,8,10,12 As far as we know, previous studies used high-resolution line scans as the only analysis feature, because manual segmentation is time consuming and is not accurate in low-quality images.12,22 Analyses using high-resolution line scans are also inadequate in many respects. High-resolution line scans do not image the choroid as a whole or provide a 3-dimensional ‘‘volumetric’’ overview of regions, as pointed out by the ETDRS group.14 No account is taken of the rotation of the eye, which means that if the rotation is slightly different between patients, different regions of the eye are scanned in each patient. The center of the scan is not corrected according to the definition of the fovea; instead only the central scan is used without a clear anatomical definition of its position. Both rotation and foveal replotting can be important when measuring retinal thickness because the measurements may be false if these two are not standardized.23 Accordingly, we consider that these features are also important for calculating choroidal thickness. Therefore the center point was regularly replotted. Rotation was not important in our study because we scanned the entire posterior pole.
Solid automated results have been obtained in some studies using newly developed technical methods such as long-wavelength SD OCT.7,9 These results are promising for future developments, but the techniques are not currently practicable for clinical application because the research devices are very large and are not easy to handle, and the first devices to be sold on the market are not widely used. With our technique, every clinician can easily measure choroidal volume using a standard SD OCT raster scan obtained in a few seconds.
A major difference between the finding with our automated and other manual segmentation techniques is that the choroidal thickness measurements with the automated method were overall thinner than those in other studies (eg, the study by Shin and associates24). Unlike the manual segmentation technique described by Shin’s group, automated segmentation delineates the choroidal vessels only and does not segment the choroidalscleral interface, which is located deeper below the choroid than the outer vessel boundary.13 Another explanation for the difference in the thickness measurements might be that we analyzed the entire posterior pole and therefore included measurements in the outer grid areas (at a distance of 3–6 mm from the fovea), where the choroid is known to be thinner than subfoveally.7 Furthermore, we analyzed data from more patients, and a large data set is less influenced by outliers. Additionally, only patients with type 2 diabetes were included in our study, and outliers are more frequent when combined data from patients with type 1 and type 2 diabetes are analyzed because choroidal thinning is age related and type 1 diabetes is more prevalent among young than in old people. Our measurements of central choroidal thickness (~175 μm) are not statistically significantly different from those reported by Regatieri and associates (~170 μm). Their patients, like ours, presented with type 2 diabetes and nonproliferative diabetic retinopathy with macular edema.12
A weakness of our study is that we did not match diseased and control eyes for axial eye length as done by Esmaeelpour and associates.7,8 However, the refractive deviation was minimized by primarily excluding eyes with high myopia. We also did not specifically match for age in a subject-to-subject manner but gathered an overall healthy control group with at least 50% older than 50 years. Securing a healthy control group of 142 people matched to our patient group for age and axial eye length would have exceeded the scope of our study. It was decided not to record a large control group because normal choroidal thickness has been reported on extensively in the literature.25 Therefore a consistent small comparison group seemed appropriate. The duration of disease was not considered and the type of treatment, if any, earlier than 3 months before the study could not be assessed because it was not collected within the multicenter trial, but no statistically significant difference between choroidal thinning in eyes with DME and fellow eyes without DME was noted, which supports the notion that choroidal thinning is disease rather than retinal edema dependent. This notion is also supported by findings from earlier studies12,26,27 that the choroid of patients with diabetic retinopathy, regardless of its form (nonproliferative, edema, proliferative), is statistically significantly thinner than that of age-matched healthy people, but why the systemic diabetic condition affects the choroid independently of retinal vascular alteration is not explained.
This notion is strengthened by a post mortem analysis of 10 eyes with choriocapillaris degeneration by Cao and associates.28 In this study 5 eyes were from patients with diabetes mellitus and 5 from patients without diabetes mellitus. Choriocapillaris degeneration was found in all eyes from patients with diabetes mellitus in a significantly higher amount (4-fold) than in eyes from patients without diabetes mellitus. The amount of degeneration was not associated with their retinal state (the choriocapillaris degeneration of the patient with the most severe retinopathy was not different from that of the patient with the least signs of diabetic retinopathy). Another study showed that choroidal blood flow is also reduced in patients with type 2 diabetes, even before diabetic retinopathy can be seen.29 Both findings suggest that different mechanisms of vasculopathy are responsible for retinal changes in the form of swelling (DME) and choroidal changes in the form of occlusive processes (choroidal thinning), and also suggest that choroidal changes precede retinal changes.
The findings of Kim and associates30 and Xu and associates22 contradict those from our study with respect to choroidal thickness. Kim and associates retrospectively compared patients with and without DME and found a thicker choroid in patients with DME.30 The main difference from our study is that they measured choroidal thickness only at selected points of interest. They compared patients without DME who had no, mild, and moderate to severe nonproliferative diabetic retinopathy with patients with DME (cystoid, diffuse, or edema with serous retinal detachment). More than one third of the patients without DME were classified as ‘‘no diabetic retinopathy,’’ leaving it unclear whether the non-DME fellow eyes from DME patients were included or—most likely—these ‘‘no diabetic retinopathy’’ eyes were from patients without DME in both eyes. As all patients examined for diabetic retinopathy were included in the study, these eyes were probably from patients without DME in either eye. Many of these patients probably underwent only regular screening and did not have any eye disease. We only compared patients who were diagnosed with diabetes and already had DME in 1 eye. Kim and associates’ standard deviations were also statistically significantly higher (up to 143 μm) than ours (around 20 μm), which implies that our measurements are more accurate, most probably because of the standardized automated procedure we used.
Xu and associates analyzed data from the Beijing Eye Study and concluded that subfoveal choroidal thickness is increased in patients with diabetic retinopathy.22 Theirs was a population-based epidemiologic cross-sectional study carried out in Northern China in 2001 and 2006. From 3468 study participants, 246 patients had diabetes mellitus and only 23 patients had diabetic retinopathy. The authors do not state how many of those suffered from DME, but out of 23 patients 15 eyes were diagnosed with mild nonproliferative diabetic retinopathy. These were highly unlikely to have had DME; consequently only 8 of the patients in this study might have had DME. This clearly underpowers the measurements for any conclusions on DME. Another weakness of Xu and associates’ study is again that the authors measured only 1 point of interest in widely spaced line scans and they did this manually. Nevertheless, the results of the study in addition to ours indicate that the choroid thickens as a systemic process that can also lead to DME. After this thickening period, the systemic disease then transitions into choroidal thinning. This theory is also supported by Vujosevic and associates’ findings of progressive thinning with progressive diabetic retinopathy. Furthermore, they did not detect any difference in subfoveal choroidal thickness between patients with DME and those with diabetes and without macular edema but a poor internal diabetic status.31
Another finding of this study was the missing correlation between retinal and choroidal thicknesses and the missing correlation between leaking areas on fluorescein angiograms (retinal vessels) and choroidal thickness, which might be attributable to the different vessel flow origins of the retina and the choroid.
In conclusion, this study of a large number of DME patients with high statistical power showed a clear association between diabetic disease and choroidal thinning. Moreover, choroidal thinning was demonstrated over the entire posterior pole in patients with DME. This consistent thinning equally affected also fellow eyes without macular edema, suggesting a systemic pathophysiologic mechanism unrelated to the presence of retinal disease. This finding was further supported by the fact that choroidal changes did not correlate with the level of retinal pathology. For the first time, automated 3-dimensional segmentation algorithms based on standard clinical SD OCT images were successfully used for measuring choroidal thickness in patients with DME where choroidal thickness measurements were not compromised by segmentation failures when surveying a large study population. With these fast and reliable automated procedures, large populations can be analyzed and choroidal disease can be quantified reliably and correlated with associated retinal disease in an attempt to further improve our understanding of ocular vascular disease in diabetes.
Biography
 Bianca S. Gerendas coordinates the young international and interdisciplinary OPTIMA group (Ophthalmic Image Analysis) with the aim of individualized treatment for retinal diseases, especially anti-VEGF therapy, based on automated image analysis and population based models from large-scale multimodal imaging data. Her primary research interests are retinal imaging, image analysis and translational ophthalmic research. She is a supervisor at the Vienna Reading Center and a resident at the Department of Ophthalmology, Medical University of Vienna, Austria.
Footnotes
ALL AUTHORS HAVE COMPLETED AND SUBMITTED THE ICMJE FORM FOR DISCLOSURE OF POTENTIAL CONFLICTS OF INTEREST and reported the following disclosures: The Christian Doppler Laboratory for Ophthalmic Image Analysis (OPTIMA) receives funding by the Austrian Federal Ministry of Economy, Family and Youth (Gerendas, Waldstein, Simader, Zhang, Bogunovic, Abramoff, Sonka, Schmidt-Erfurth). Sonka and Abramoff receive National Institutes of Health funding for their institution and are inventors of United States patents with regard to n-dimensional graph search, from which they receive royalties. Abramoff receives funding from the Veterans Administration for his institution and is the owner of IDx LLC, where he serves as board member and consultant. Kundi serves as consultant for Baxter, Novartis, Sanofi, and GlaxoSmithKline; provides expert testimony for Ashkraft&Gerel LLT, and receives payments from the Austrian Chamber of Physicians and the European Union. Schmidt-Erfurth is a board member for Alcon, Bayer, and Novartis; serves as consultant for Alcon, Bayer, Novartis, and Boehringer-Ingelheim; and receives payments for lectures from Novartis and Bayer. Funding/support: Austrian Federal Ministry of Economy, Family and Youth and the National Foundation for Research, Technology and Development, Vienna, Austria (Gerendas, Waldstein, Simader, Zhang, Bogunovic, Abramoff, Sonka, Schmidt-Erfurth). Contributions of authors: design and conduct of the study (B.S.G., S.M.W., C.C.S., M.K., U.M.S.-E.); collection, management, analysis, and interpretation of the data (B.S.G., S.M.W., C.C.S., G.G.D., B.H., L.Z., H.B., M.D.A., M.K., M.S., U.M.S.-E.); preparation, review, and approval of the manuscript (B.S.G., S.M.W., C.C.S., G.G.D., B.H., L.Z., H.B., M.D.A., M.K., M.S., U.M.S.-E.).
References
- 1.Yanoff M. Ocular pathology of diabetes mellitus. Am J Ophthalmol. 1969;67(1):21–38. doi: 10.1016/0002-9394(69)90004-x. [DOI] [PubMed] [Google Scholar]
- 2.Hidayat AA, Fine BS. Diabetic choroidopathy. Light and electron microscopic observations of seven cases. Ophthalmology. 1985;92(4):512–522. [PubMed] [Google Scholar]
- 3.Alm A. Ocular Circulation. In: Hart WM, editor. Adler’s Physiology of the Eye. 9. St Louis, MO: CV Mosby; 1992. pp. 198–227. [Google Scholar]
- 4.McLeod DS, Lutty GA. High-resolution histologic analysis of the human choroidal vasculature. Invest Ophthalmol Vis Sci. 1994;35(11):3799–3811. [PubMed] [Google Scholar]
- 5.Weinberger D, Kramer M, Priel E, Gaton DD, Axer-siegel R, Yassur Y. Indocyanine green angiographic findings in nonproliferative diabetic retinopathy. Am J Ophthalmol. 1998;126(2):238–247. doi: 10.1016/s0002-9394(98)00148-2. [DOI] [PubMed] [Google Scholar]
- 6.Huang D, Swanson EA, Lin CP, et al. Optical coherence tomography. Science. 1991;254(5035):1178–1181. doi: 10.1126/science.1957169. [DOI] [PMC free article] [PubMed] [Google Scholar]
- 7.Esmaeelpour M, Brunner S, Ansari-Shahrezaei S, et al. Choroidal thinning in diabetes type 1 detected by 3-dimensional 1060 nm optical coherence tomography. Invest Ophthalmol Vis Sci. 2012;53(11):6803–6809. doi: 10.1167/iovs.12-10314. [DOI] [PubMed] [Google Scholar]
- 8.Esmaeelpour M, Považay B, Hermann B, et al. Mapping choroidal and retinal thickness variation in type 2 diabetes using three-dimensional 1060-nm optical coherence tomography. Invest Ophthalmol Vis Sci. 2011;52(8):5311–5316. doi: 10.1167/iovs.10-6875. [DOI] [PubMed] [Google Scholar]
- 9.Torzicky T, Pircher M, Zotter S, Bonesi M, Götzinger E, Hitzenberger CK. Automated measurement of choroidal thickness in the human eye by polarization sensitive optical coherence tomography. Opt Express. 2012;20(7):7564–7574. doi: 10.1364/OE.20.007564. [DOI] [PMC free article] [PubMed] [Google Scholar]
- 10.Querques G, Lattanzio R, Querques L, et al. Enhanced depth imaging optical coherence tomography in type 2 diabetes. Invest Ophthalmol Vis Sci. 2012;53(10):6017–6024. doi: 10.1167/iovs.12-9692. [DOI] [PubMed] [Google Scholar]
- 11.Hu Z, Wu X, Ouyang Y, Ouyang Y, Sadda SR. Semiautomated segmentation of the choroid in spectral-domain optical coherence tomography volume scans. Invest Ophthalmol Vis Sci. 2013;54(3):1722–1729. doi: 10.1167/iovs.12-10578. [DOI] [PubMed] [Google Scholar]
- 12.Regatieri CV, Branchini L, Carmody J, Fujimoto JG, Duker JS. Choroidal thickness in patients with diabetic retinopathy analyzed by spectral-domain optical coherence tomography. Retina. 2012;32(3):563–568. doi: 10.1097/IAE.0b013e31822f5678. [DOI] [PMC free article] [PubMed] [Google Scholar]
- 13.Zhang L, Lee K, Niemeijer M, Mullins RF, Sonka M, Abramoff MD. Automated segmentation of the choroid from clinical SD-OCT. Invest Ophthalmol Vis Sci. 2012;53(12):7510–7519. doi: 10.1167/iovs.12-10311. [DOI] [PMC free article] [PubMed] [Google Scholar]
- 14.Early Treatment Diabetic Retinopathy Study research group. Photocoagulation for diabetic macular edema. Early Treatment Diabetic Retinopathy Study report number 1. Arch Ophthalmol. 1985;103(12):1796–1806. [PubMed] [Google Scholar]
- 15.Garvin MK, Abramoff MD, Kardon R, Russell SR, Wu X, Sonka M. Intraretinal layer segmentation of macular optical coherence tomography images using optimal 3-D graph search. IEEE Trans Med Imaging. 2008;27(10):1495–1505. doi: 10.1109/TMI.2008.923966. [DOI] [PMC free article] [PubMed] [Google Scholar]
- 16.Quellec G, Kyungmoo L, Dolejsi M, Garvin MK, Abramoff MD, Sonka M. Three-dimensional analysis of retinal layer texture: identification of fluid-filled regions in SD-OCT of the macula. IEEE Trans Med Imaging. 2010;29(6):1321–1330. doi: 10.1109/TMI.2010.2047023. [DOI] [PMC free article] [PubMed] [Google Scholar]
- 17.Bookstein FL. Principle warps-thin-plate splines and the decomposition of deformations. IEEE Trans Pattern Anal Mach Intell. 1989;11:567–585. [Google Scholar]
- 18.Abramoff MD, Magelhaes PJ, Ram SJ. Image processing with ImageJ. Biophotonics International. 2004;11(7):36–42. [Google Scholar]
- 19.Ouyang Y, Heussen FM, Mokwa N, et al. Spatial distribution of posterior pole choroidal thickness by spectral domain optical coherence tomography. Invest Ophthalmol Vis Sci. 2011;52(9):7019–7026. doi: 10.1167/iovs.11-8046. [DOI] [PMC free article] [PubMed] [Google Scholar]
- 20.DeCroos FC, Toth CA, Stinnett SS, Heydary CS, Burns R, Jaffe GJ. Optical coherence tomography grading reproducibility during the Comparison of Age-related Macular Degeneration Treatments Trials. Ophthalmology. 2012;119(12):2549–2557. doi: 10.1016/j.ophtha.2012.06.040. [DOI] [PMC free article] [PubMed] [Google Scholar]
- 21.Ritter M, Elledge J, Simader C, et al. Evaluation of optical coherence tomography findings in age-related macular degeneration: a reproducibility study of two independent reading centres. Br J Ophthalmol. 2011;95(3):381–385. doi: 10.1136/bjo.2009.175976. [DOI] [PMC free article] [PubMed] [Google Scholar]
- 22.Xu J, Xu L, Du KF, et al. Subfoveal choroidal thickness in diabetes and diabetic retinopathy. Ophthalmology. 2013;120(10):2023–2028. doi: 10.1016/j.ophtha.2013.03.009. [DOI] [PubMed] [Google Scholar]
- 23.Hwang YH, Lee JY, Kim YY. The effect of head tilt on the measurements of retinal nerve fibre layer and macular thickness by spectral-domain optical coherence tomography. Br J Ophthalmol. 2011;95(11):1547–1551. doi: 10.1136/bjo.2010.194118. [DOI] [PubMed] [Google Scholar]
- 24.Shin JW, Shin YU, Lee BR. Choroidal thickness and volume mapping by a six radial scan protocol on spectral-domain optical coherence tomography. Ophthalmology. 2012;119(5):1017–1023. doi: 10.1016/j.ophtha.2011.10.029. [DOI] [PubMed] [Google Scholar]
- 25.Tan CS, Cheong KX, Lim LW, Li KZ. Topographic variation of choroidal and retinal thicknesses at the macula in healthy adults. Br J Ophthalmol. 2014;98(3):339–344. doi: 10.1136/bjophthalmol-2013-304000. [DOI] [PubMed] [Google Scholar]
- 26.Adhi M, Brewer E, Waheed NK, Duker JS. Analysis of morphological features and vascular layers of choroid in diabetic retinopathy using spectral-domain optical coherence tomography. JAMA Ophthalmol. 2013;131(10):1267–1274. doi: 10.1001/jamaophthalmol.2013.4321. [DOI] [PMC free article] [PubMed] [Google Scholar]
- 27.Lee HK, Lim JW, Shin MC. Comparison of choroidal thickness in patients with diabetes by spectral-domain optical coherence tomography. Korean J Ophthalmol. 2013;27(6):433–439. doi: 10.3341/kjo.2013.27.6.433. [DOI] [PMC free article] [PubMed] [Google Scholar]
- 28.Cao J, McLeod S, Merges CA, Lutty GA. Choriocapillaris degeneration and related pathologic changes in human diabetic eyes. Arch Ophthalmol. 1998;116(5):589–597. doi: 10.1001/archopht.116.5.589. [DOI] [PubMed] [Google Scholar]
- 29.Nagaoka T, Kitaya N, Sugawara R, et al. Alteration of choroidal circulation in the foveal region in patients with type 2 diabetes. Br J Ophthalmol. 2004;88(8):1060–1063. doi: 10.1136/bjo.2003.035345. [DOI] [PMC free article] [PubMed] [Google Scholar]
- 30.Kim JT, Lee DH, Joe SG, Kim J-G, Yoon YH. Changes in choroidal thickness in relation to the severity of retinopathy and macular edema in type 2 diabetic patients. Invest Ophthalmol Vis Sci. 2013;54(5):3378–3384. doi: 10.1167/iovs.12-11503. [DOI] [PubMed] [Google Scholar]
- 31.Vujosevic S, Martini F, Cavarzeran F, Pilotto E, Midena E. Macular and peripapillary choroidal hickness in diabetic patients. Retina. 2012;32(9):1781–1790. doi: 10.1097/IAE.0b013e31825db73d. [DOI] [PubMed] [Google Scholar]