

Abstract
Ion mobility spectrometry-mass spectrometry (IMS-MS) techniques are used to study the general effects of phosphorylation on peptide structure. Cross sections for a library of 66 singly phosphorylated peptide ions from 33 pairs of positional isomers, and unmodified analogues were measured. Intrinsic size parameters (ISPs) derived from these measurements yield calculated collision cross sections for 85% of these phosphopeptide sequences that are within ±2.5% of experimental values. The average ISP for the phosphoryl group (0.64 ± 0.05) suggests that in general this moiety forms intramolecular interactions with the neighboring residues and peptide backbone, resulting in relatively compact structures. We assess the capability of ion mobility to separate positional isomers (i.e., peptide sequences that differ only in the location of the modification) and find that more than half of the isomeric pairs have >1% difference in collision cross section. Phosphorylation is also found to influence populations of structures that differ in the cis/trans orientation of Xaa–Pro peptide bonds. Several sequences with phosphorylated Ser or Thr residues located N-terminally adjacent to Pro residues show fewer conformations compared to the unmodified sequences.
Keywords: Ion mobility, Phosphorylation, Peptide structure, Proline isomerization
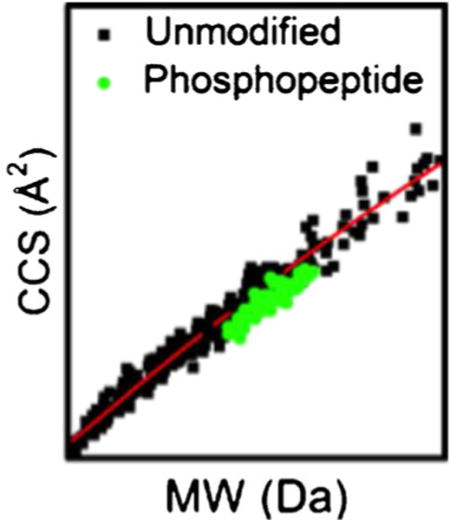
Graphical abstract
Introduction
Phosphorylation is a reversible post-translation modification (PTM) that influences protein folding, activity, and subcellular localization; thus, it is involved in a multitude of biochemical processes such as enzyme activity, cellular signaling, and apoptosis [1, 2]. Because of its importance, a range of techniques have been developed to monitor phosphorylation events, including: 32P radiolabeling combined with Edman degradation [3], flow cytometry [4], and mass spectrometry-based technologies [5, 6]. Mass spectrometry (MS) has emerged as the preferred analytical technique for mapping phosphorylation sites and quantitating entire phosphoproteomes [5, 6]. Despite recent technological advances such as the development of phosphopeptide enrichment strategies prior to MS analysis and novel fragmentation methods, it remains challenging to identify PTMs compared with unmodified peptides in complex mixtures as they frequently occur at low abundances in comparison to unmodified proteins and peptides [7–12].
Recently, the combination of ion mobility spectrometry and MS (IMS-MS) has received substantial interest for improving peptide identification [13–17]. In IMS experiments, ions are separated on differences in their shapes and charge states [18, 19]. The ability to separate ions by differences in conformation makes it possible to separate isobaric and isomeric species such as phosphopeptide positional isomers (i.e., peptides that differ only by the residue that is phosphorylated) which are not easily distinguished by MS techniques alone [20, 21]. In addition to enhancing identification, ion mobility provides a probe of conformation [18, 19]. Although IMS-MS is a gas-phase technique, several studies have shown that it can be used to monitor populations of conformations of biomolecules that retain elements of their solution structure upon being transferred to the gas phase [22–24].
Because IMS adds a dimension of separation and provides structural information that is complementary to liquid chromatography and MS, several groups have proposed using it to improve proteomics [25–28] and phosphoproteomics studies [29–35]. Previous IMS-MS studies demonstrated that collision cross sections of phosphopeptides are smaller on average than unmodified peptides of similar mass [29–31]. Based on this relationship between collision cross section and mass, IMS has been proposed as a method for screening for phosphopeptides [29–31]. Recently, field asymmetric waveform ion mobility spectrometry (FAIMS) was used to separate isomeric phosphopeptides and increase the number of phosphopeptide identifications [32–35]. Coupling IMS with fragmentation techniques such as photodissociation and electron transfer dissociation has been shown to improve phosphosite localization [36, 37]. Furthermore, IMS has been applied to understanding the mechanisms of phosphopeptide fragmentation [38–40].
One IMS-based strategy proposed for improving peptide identification is the utilization of intrinsic size parameters (ISPs) [14, 41–45]. ISPs provide the average value each amino acid residue or modification contributes to a peptide’s cross section. Therefore, ISPs can be used to predict collision cross sections based on amino acid sequence composition [14, 41–45]. In addition, ISPs provide general insight into peptide structure. For example, Dilger et al. calculated ISPs for alkali-and alkaline-earth-coordinated peptides to gain insight into the interactions between metal cations and specific amino acid residues that influence peptide ion structure [43, 44]. ISPs were recently extended to PTMs with palmitoylated peptides [45].
In this study, we report collision cross sections for a library of phosphorylated peptides. These values are used to derive an ISP of 0.64 ± 0.05 for the phosphoryl group, a value that is significantly smaller than ISPs reported for any other residue or modification to date, including polar residues such as Asp and Glu [14, 41–45]. This suggests that the phosphoryl group participates in intramolecular interactions that lead to a general compaction of the peptide structure relative to unmodified sequences. We evaluate the utility of ISPs for predicting collision cross sections of phosphopeptides and IMS for separating positional isomers. Finally, we also explore the structural implications of phosphorylation by examining the populations of conformations for several proline-containing peptides that display a high degree of conformational heterogeneity. Overall, this work argues for the importance of incorporating ion mobility into phosphoproteomic workflows.
Experimental
Library Design and Synthesis
The following criteria were used for designing the library of peptides. All sequences are found in proteomes of vertebrates. Peptides are 11 or 12 residues in length and terminate in Arg or Lys residues to represent typical sequences measured in bottom-up proteomics experiments. Sequences contain two Ser, two Thr, or a combination of Ser and Thr residues. We synthesized the unmodified peptide and each pair of singly phosphorylated peptides that are modified at the Ser (pSer) or Thr (pThr) residues. The library is based on 33 root sequences, providing a total of 99 peptides from 33 unmodified peptides and 66 singly phosphorylated peptides comprised of 33 pairs of positional isomers. In addition to the library of positional isomers from 33 root sequences, we synthesized six singly phosphorylated peptide sequences that also meet the criteria described above. Peptides were synthesized by Fmoc solid-phase synthesis on an Apex 396 peptide synthesizer (AAPPTec, Louisville, KY, USA) using a method similar to that previously described [46].
Ion Mobility Spectrometry-Mass Spectrometry
Experiments were performed on a home-built IMS-MS instrument previously described in detail [47]. Briefly, ions are produced via electrospray ionization with a Triversa Nanomate (Advion Bioscience, Inc., Ithaca, NY, USA) by direct infusion of crude synthesis products dissolved in 49:49:1 water:acetonitrile:formic acid solutions at a concentration of ~0.01 mg·mL−1. Ions are stored in a Smith-geometry [48] ion funnel and periodically pulsed (150 μs wide) into a ~2-m long drift tube filled with 3 Torr He buffer gas at 300 K and operated with an electric field of ~10 V·cm−1. Mobility separated ions exit the drift tube through a differentially pumped region before being mass analyzed with an orthogonal geometry time-of-flight analyzer in a nested fashion [49].
Calculating Collision Cross Sections
Drift time (tD) distributions are measured by IMS-MS. However, it is useful to convert drift time distributions to collision cross section (Ω) distributions according to
| (1) |
where ze, kb, MI, and MB are the charge of the ion, Boltzmann’s constant, mass of the ion, and mass of the buffer gas, respectively. T, P, and N are the temperature, pressure, and neutral number density of the buffer gas at STP. L and E are the length of the drift tube and electric field. The instrument used in this study contains ion funnels to radially focus ions at the middle and end of the drift tube. Due to the nonlinear electric field in the ion funnels, we calibrate collision cross section values to well characterized systems. Cross section values obtained this way are in excellent agreement with absolute values measured in the first half of the drift tube that has a linear electric field.
Results and Discussion
IMS-MS Analysis of a Phosphopeptide Library: General Trends
Collision cross sections were measured for 33 unmodified peptides and 66 phosphorylated peptide analogues, comprised of 33 pairs of positional isomers, from a library of synthesized peptides as explained above. A complete list of sequences and collision cross sections is provided in Table 1. We focus on doubly protonated [M + 2H]2+ ions as this is the dominant species observed in the mass spectra for all phosphopeptides analyzed.
Table 1.
Collision Cross Sections of Unmodified and Phosphorylated [M + 2H]2+ Peptides
| Sequence | Massb (Da) | Collision cross sectiona (Å2)
|
||||||||
|---|---|---|---|---|---|---|---|---|---|---|
| Unmodified | Phosphosite 1c | Phosphosite 2d | ||||||||
| VSPAGGTLDDK | 1058.5 | 250 | 246 | 252 | 249 | |||||
| STGPVPAPPDR | 1092.6 | 244 | 236 | 248 | 252 | 246 | ||||
| GPELVGPSESK | 1098.6 | 247 | 258 | 262 | 256 | |||||
| GASSAEAPDGDK | 1103.5 | 236 | 243 | 248 | ||||||
| SNSLPHPAGGGK | 1120.6 | 244 | 257 | 251 | ||||||
| FGAAGADASDSR | 1123.5 | 247 | 264 | 255 | ||||||
| VSSIVAPGGALR | 1125.7 | 251 | 264 | 265 | ||||||
| PALPAPAASLTR | 1163.7 | 267 | 268 | 277 | 270 | |||||
| DPDHVSTAPAR | 1164.6 | 256 | 258 | 270 | ||||||
| SPELPSPQAEK | 1181.6 | 258 | 252 | 263 | 270 | 265 | ||||
| AINEGPPTESGK | 1198.6 | 258 | 264 | 265 | ||||||
| ISMISPPQDGR | 1199.6 | 264 | 272 | 270 | ||||||
| MAPASASGEDLR | 1203.6 | 269 | 269 | 276 | 268 | |||||
| TFNPGAGLPTDK | 1216.6 | 267 | 272 | 276 | ||||||
| PTPLTPLEPQK | 1219.7 | 266 | 276 | 273 | 277 | |||||
| AADVEPSSPEPK | 1225.6 | 263 | 272 | 264 | ||||||
| ELILDVVPSSR | 1226.7 | 272 | 289 | 290 | ||||||
| PGPLPSSLDDLK | 1237.7 | 286 | 286 | 288 | ||||||
| HSVTPAEGDLAR | 1251.6 | 270 | 273 | 276 | ||||||
| AGTPTPPVFQVR | 1268.7 | 273 | 268 | 262 | 287 | 272 | 285 | |||
| LQDTPSEPMEK | 1273.6 | 272 | 283 | 281 | ||||||
| STPLGQQQPAPR | 1278.7 | 267 | 275 | 280 | 272 | 277 | 274 | 279 | ||
| PAMPQDSVPSPR | 1280.6 | 274 | 284 | 284 | ||||||
| FSDHGAALNTEK | 1288.6 | 276 | 281 | 277 | 276 | |||||
| GSHSPHWPEEK | 1289.6 | 280 | 270 | 285 | ||||||
| EVLLEASEETGK | 1303.7 | 275 | 282 | 282 | ||||||
| FSSEDLEDPLR | 1306.6 | 280 | 280 | 283 | ||||||
| PVEEVEVPTVTK | 1325.7 | 281 | 281 | 290 | 286 | |||||
| MSPASPIDDIER | 1329.6 | 293 | 274 | 278 | 284 | 285 | 283 | 283 | ||
| SESPQEALLLPR | 1338.7 | 296 | 291 | 294 | 283 | |||||
| FDWGPAPPTTFK | 1362.7 | 288 | 282 | 288 | 296 | |||||
| DEPMDAESITFK | 1381.6 | 286 | 292 | 292 | ||||||
| LQPQEAPETETR | 1397.7 | 287 | 294 | 294 | ||||||
Major conformation for each peptide [M + 2H]2+ ion is listed on left followed by minor conformations of >5.0% relative abundance in decreasing abundance listed in italics
Molecular mass of unmodified peptide sequence. Phosphorylated peptides are +80 Da
Phosphorylated Ser or Thr closest to the N-terminus
Phosphorylated Ser or Thr closest to the C-terminus
Figure 1 shows example collision cross section distributions for several sets of unmodified peptides, singly phosphorylated analogues, and a mixture of phosphopeptides for the sequences SESPQEALLLPR, GASSAEAPDGDK, and HSVTPAEGDLAR. When comparing cross section distributions of unmodified and phosphorylated sequences, it is important to consider that phosphorylation results in a mass increase of 80 Da. The range of molecular masses of unmodified peptides analyzed in this study is 1058–1398 Da, making 80 Da a considerable increase in mass. Given the intrinsic relationship between collision cross section and molecular mass [41], we expect phosphopeptides to have larger collision cross sections than unmodified sequences if the global conformation of the peptide ion is not significantly different. However, both pSESPQEALLLPR and SEpSPQEALLLPR have collision cross sections that are smaller than the unmodified sequence despite the 6.0% increase in mass for the phosphorylated species (Figure 1a). In total, 13 of 66 phosphopeptides have smaller or equivalent collision cross sections than their unmodified analogues (Table 1). This suggests that in some cases the conformations of phosphorylated peptides are significantly different than unmodified peptides. Generally, we observe an increase in cross section upon phosphorylation; however, this increase is often small compared with the increase in mass. For example, the collision cross sections for GApSSAEAPDGDK, GASpSAEAPDGDK, HpSVTPAEGDLAR, and HSVpTPAEGDLAR are 3.0%, 5.1%, 1.1%, and 2.2% larger than the unmodified sequences, respectively (Figure 1).
Figure 1.
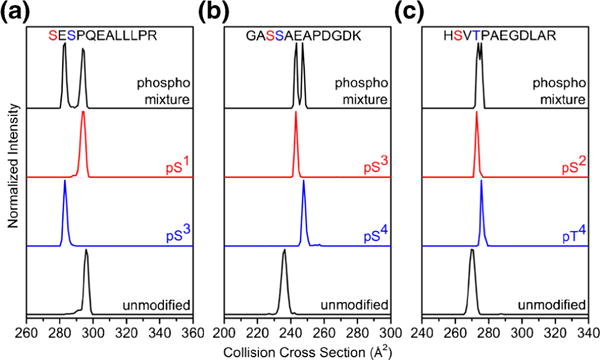
Collision cross section distributions of [M + 2H]2+ peptide ions for unmodified and pSer or pThr modified analogues of SESPQEALLLPR (a), GASSAEAPDGDK (b), and HSVTPAEGDLAR (c). The distribution labeled mixture is produced from electrospraying a sample with both phosphopeptides added at equal concentration
Figure 2 shows collision cross section versus molecular mass plots for unmodified and phosphorylated peptides. We have included collision cross sections for 284 peptide [M + 2H]2+ ions obtained from tryptic digestion of 24 proteins that were previously measured by our group [44]. This allows for comparison of phosphopeptides with typical sequences measured in bottom-up proteomics experiments. A second-order polynomial fit to the unmodified tryptic peptides is provided that represents the collision cross section of average unmodified tryptic peptides. We refer to the ratio of experimental cross section to cross sections from the polynomial fit as a reduced cross section.
Figure 2.
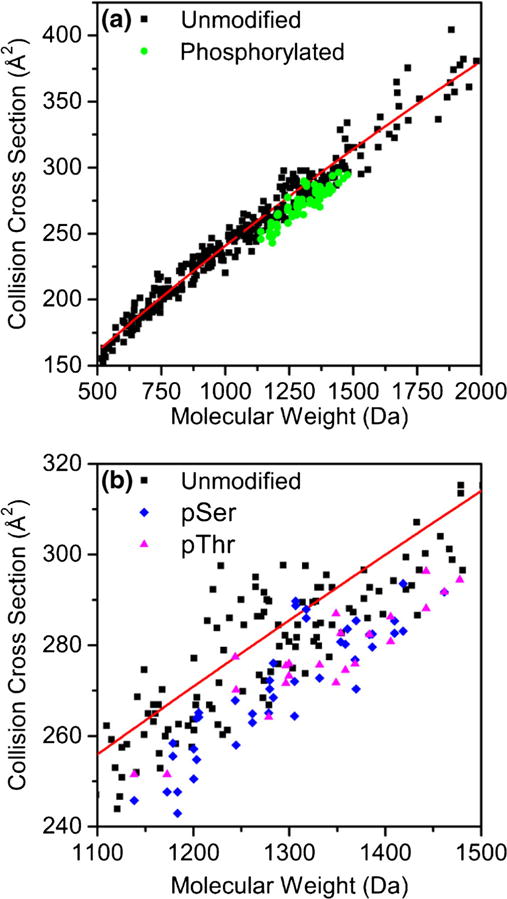
Collision cross sections for phosphorylated (green circles) and unmodified (black squares) peptide [M + 2H]2+ ions as a function of molecular mass are shown in (a). The red line is a second-order polynomial fit (Ω = −1.334E−5x2 + 0.1798x + 74.2775) to the 284 previously measured cross section values from tryptic peptides as explained in the text. The region of the cross section versus molecular mass plot where the pSer (blue diamonds) and pThr (magenta triangles) peptides are found is shown in (b)
Similar to previous IMS-MS studies [29–31], we find that phosphorylated peptides are smaller on average than unmodified peptides of the same mass. While the vast majority of peptides have reduced cross sections that are <1.00, several sequences fall above the polynomial fit such as ELILDVVPpSSR and ELILDVVPSpSR. The average reduced cross section value for phosphorylated peptides is 0.95 with a standard deviation of ±0.02. Reduced cross sections range from 0.91 (GApSSAEAPDGDK) to 1.01 (ELILDVVPSpSR). This large range (10%) of reduced cross section suggests that while phosphorylation results in compaction of peptide ion structure, the entire amino acid sequence also influences cross section.
Figure 2b shows collision cross section versus molecular mass plots in the mass range of the pSer- and pThr-containing peptides. In general, differences in cross section appear to be sequence specific and do not correlate with either pSer or pThr residues resulting in larger cross sections. In some cases, peptides with pSer are larger than the pThr isomer and vice versa. Furthermore, we do not observe a specific relationship between the relative position of phosphorylation and trends in cross section. This suggests that the changes in collision cross section upon phosphorylation are dependent on both the sequence and specific modification site.
Intrinsic Size Parameters
The derivation of intrinsic size parameters (ISPs) is described elsewhere [14, 42]. Briefly, ISPs are calculated by solving a series of equations that relates the frequency of each amino acid residue and modification to the reduced cross section according to,
| (2) |
where j is each individual amino acid residue or modification and ranges from 1 to n, and n is the total number of residues and modifications. Here, n is equal to 21 as sequences are comprised of 20 amino acids and the phosphoryl modification. Cys residues in tryptic peptides are carboxyamidomethylated according to the digestion protocol [44]. The ISP for the phosphoryl group is derived as an individual component separated from the modified amino acid. This is similar to the approach previously described for palmitoylated peptides [45]. X represents the frequency of each residue or modification (j) in each peptide sequence (i). The variable pj is the intrinsic size parameter for each residue or modification (j). The variable yi represents the reduced cross section for each sequence (i) as explained above. This series of equations is used to solve for ISPs by a linear least-squares regression calculated with the MatLab software package (MathWorks, Inc., Natick, MA, USA). Errors are calculated as the square root of the variance and represent one standard deviation.
Figure 3 shows ISPs for the amino acid residues, phosphoryl group, and previously reported [45] palmitoyl group. ISPs for all amino acid residues are within the error of previous values for doubly protonated peptide ions [45]. We calculate an ISP of 0.64 ± 0.05 for the phosphoryl modification. This is significantly smaller than any other ISP, including polar residues such as Asp. We included the palmitoyl group to highlight the contrasting effects different PTMs can have on peptide structure.
Figure 3.
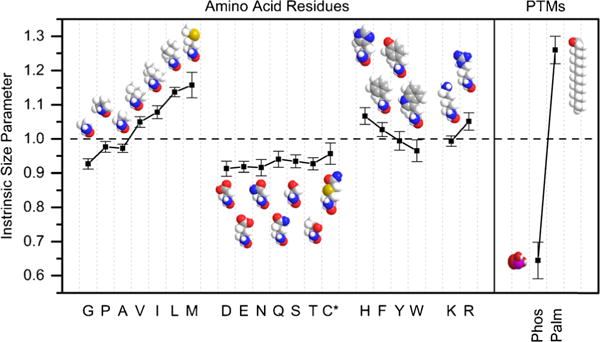
Intrinsic size parameters derived from [M + 2H]2+ ions. Error bars represent one standard deviation about the mean. Cys* residues are carboxyamidomethylated as explained in the text. The Phos parameter represents the phosphoryl group modification and is derived as a separate parameter from the Ser and Thr residues. The Palm group is from a previous study as explained in the text. Space-filling models are provided for visualization of differences in chemical composition and sizes of side chains
In agreement with previous studies, ISPs are smaller for polar residues [41–45]. For example, Glu has a significantly smaller ISP than Ala, despite having a larger mass. One explanation for this is polar residues participate in intramolecular interactions with the neighboring residues, peptide backbone, or charge sites. Although ISPs are not a direct measure of the structure adopted by the phosphoryl modification, the extremely small ISP value suggests the phosphoryl group participates in intramolecular interactions that lead to a compaction of structure. This would explain why in some cases we observed a decrease in cross section for phosphopeptides compared with their less massive, unmodified analogues. This is in agreement with previous studies that suggest phosphorylated residues participate in intramolecular interactions in peptide ions [29, 30, 39].
ISPs for Predicting Phosphopeptide Cross Sections
Several studies have shown that ISPs can be used to predict cross sections based on sequence composition [14, 41–45]. Here, we compare the accuracy of ISP predictions to a molecular weight fit. Because the predicted cross sections were used to derive the ISPs, they are retrodictions. However, we note that previous studies have shown the accuracy of retrodictions and bona fide predictions are similar [42, 45].
Figure 4 shows ratios of retrodicted cross sections to experimental cross sections for the 66 phosphopeptides. The molecular weight fit does not have high prediction accuracy as most phosphopeptides fall below the polynomial fit (Figure 4a). Therefore, molecular weight fit retrodictions were corrected by −5% because the average reduced cross section for phosphopeptides was 0.95 (Figure 4b). Although the adjusted molecular weight fit and ISPs have similar prediction accuracies, ISPs are more accurate at both high and low thresholds. Using the adjusted molecular weight fit, 35% (23), 82% (54), and 91% (60) of the 66 phosphorylated peptides are predicted within ±1%, ±2.5%, and ±5% of experimental values, respectively. ISPs predict 44% (29), 85% (56), and 100% (66) of phosphorylated peptides within ±1%, ±2.5%, and ±5% of experimental cross sections, respectively.
Figure 4.
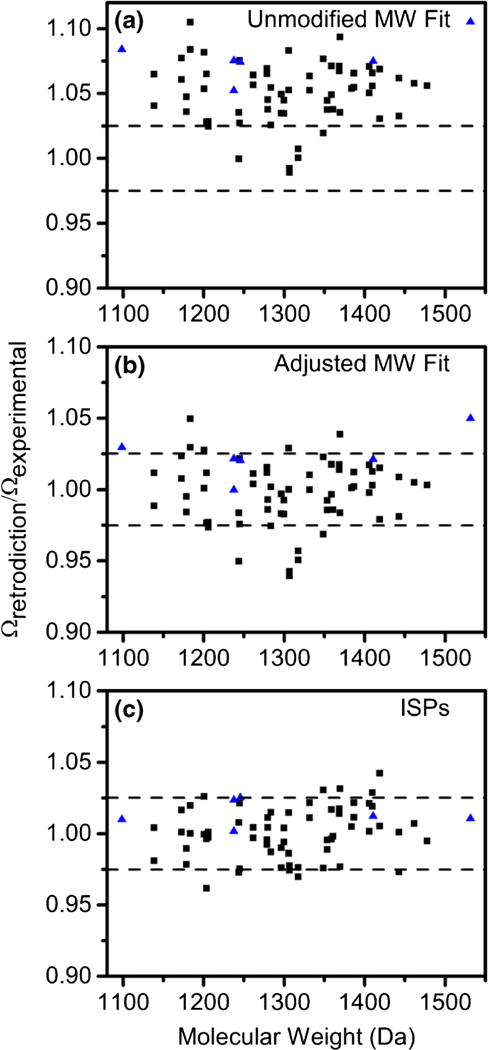
Scatter plots of prediction accuracies obtained by dividing collision cross sections retrodicted (black squares) and predicted (blue triangles) with the molecular weight fit (a), adjusted molecular weight fit (b), and ISPs (c) by the experimental collision cross section
In addition to retrodictions, we made bona fide predictions for six peptide sequences not found in the library of 66 phosphopeptides used to calculate ISPs (Figure 4). GVEVGADTGpSK, PAPGpSTAPPAHR, PAPGSpTAPPAHR, MADFAGPSpSAGR, TPpTMPQEEAAEK, and EEEVpTSEEDEEK have experimental collision cross section values of 236, 257, 263, 258, 280, and 288 Å2, respectively. Although this is a relatively small number of sequences, we observe similar prediction accuracies compared with the retrodictions as 5 out of 6 (83%) of the sequences are predicted by ISPs within ±2.5%. In total, collision cross sections for 61 of 72 (85%) sequences are predicted by ISPs within ±2.5%.
Although a larger dataset is needed to more rigorously evaluate the improvement of ISPs compared with the adjusted molecular weight fit, this data suggests that ISPs improve prediction of collision cross sections. We point out that several of the adjusted molecular weight fit predictions have large (>5%) differences from experimental values such as ELILDVVPpSSR and ELILDVVPSpSR. Both sequences had improved prediction accuracies with ISPs. We suggest that the improvement with ISPs is due to a high content of aliphatic residues such as Leu, Val, Ile that have large ISPs (>1.00). The aliphatic residues likely negate the effect of the phosphoryl group. This example highlights one of the benefits of using ISPs. That is, ISPs account for all residues and modifications as opposed to the molecular weight fit that uses a single parameter for predictions. Furthermore, as ISPs are expanded to an increasing number of PTMs, it would be possible to predict cross sections for peptides with multiple types of PTMs. It would be difficult to develop a molecular weight fit for peptides that have multiple types of PTMs.
ISP predictions of collision cross sections could have potential for improving identifications of low abundance species that are difficult to detect in standard data-dependent acquisition in which only the most abundant species are selected for fragmentation. ISPs could be implemented into workflows to select phosphopeptides based on predicted collision cross sections. Furthermore, phosphopeptides are typically found in a different region of the cross section versus m/z plot (Figure 2), which may help distinguish low abundance phosphopeptides from unmodified peptides.
One current limitation of ISPs is that positional isomers will yield identical predicted cross sections. However, as the number of collision cross sections increases, it may be possible to develop sequence-specific ISPs. Hilderbrand and Clemmer developed sequence-specific ISPs from a library of tripeptides [50]. Although this would require thousands of additional cross section measurements for longer sequences, it would be a key development in the application of IMS for improving peptide identification.
Mobility Separation of Phosphopeptide Positional Isomers
Here, we assess the capability of IMS to separate positional isomers. Collison cross section distributions for three pairs of isomeric phosphopeptides are shown in Figure 1. pSESPQEALLLPR and SEpSPQEALLLPR have collision cross sections of 294 and 283 Å2, respectively, which is a 3.8% difference. These peaks are clearly resolved in the IMS distribution for the mixture of isomers. GApSSAEAPDGDK and GASpSAEAPDGDK have collision cross sections of 243 and 248 Å2, respectively, which is a 2.0% difference. Although they are not baseline resolved, these conformations are resolved at full width at half maximum (FWHM). The conformations of HSVTPAEGDLAR are HSVTPAEGDLAR have cross sections that are only 1.1% different. While these isomers are not resolved at FWHM, we do observe a slight separation of conformations. We point out that a recent study combining IMS with fragmentation techniques demonstrated that peptides that are not resolved can still be distinguished by extracting the mobility distributions for the fragment ions [36].
From the entire dataset of phosphorylated peptides, we observe that 13 of 33 isomeric pairs have >2.0% difference in collision cross section and 18 of 33 isomeric pairs have >1.0% difference in collision cross section. Only four of the pairs have identical collision cross section values. It is important to point out that the phosphosites for GASSAEAPDGDK are adjacent, and the phosphosites for HSVTPAEGDLAR and SESPQEALLLPR are separated by a single residue. In 24 of the 33 sequences analyzed in this study, the modified sites are either adjacent or separated by a single residue. Thus, these peptides would be very difficult to distinguish solely by fragmentation methods because a limited number of fragments could be used to distinguish each positional isomer.
Influence of Phosphorylation on Proline Isomerization
Finally, we consider the influence of phosphorylation on the number and populations of conformers observed in mobility distributions. Figure 5 shows collision cross section distributions for proline-containing peptides that have multiple conformations of relatively high abundance. We note that the majority of peptides in this study do not have multiple conformations of high abundance (Table 1). Several previous IMS-MS studies have shown that proline-containing peptides frequently adopt multiple conformations arising from the cis-trans isomerization of Xaa–Pro peptide bonds [46, 51].
Figure 5.
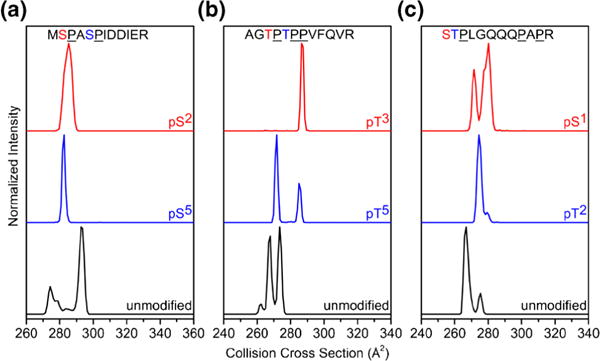
Collision cross section distributions of [M + 2H]2+ peptide ions for unmodified and pSer or pThr modified analogues of MSPASPIDDIER (a), AGTPTPPVFQVR (b), and STPLGQQQPAPR (c)
We find that distributions of proline-containing phosphopeptides are markedly different than unmodified analogues (Figure 5). In some cases, there is a decrease in the number of conformers (i.e., conformational heterogeneity) observed in the mobility distribution. However, some peptides show an increase in the conformational heterogeneity upon phosphorylation. Generally, peptides with the phosphorylated residues located N-terminally adjacent to a Pro residue and near the other Pro residues in the sequence show a decrease in conformational heterogeneity compared with the unmodified sequence, such as MSPApSPIDDIER and AGpTPTPPVFQVR (Figure 5). In contrast, when phosphorylated residues are distant from Pro residues, this effect appears to be less pronounced, such as pSTPLGQQQPAPR (Figure 5). We suggest that this effect is likely due to intramolecular interactions of the phosphoryl group effectively locking Pro residues in either cis or trans configurations.
Although additional studies with amino acid substitutions and molecular dynamics simulations need to be performed to understand the exact mechanism by which phosphorylation influences proline isomerization and conformational heterogeneity in peptide ions, we suggest that IMS can be used to monitor changes in conformational heterogeneity that occur upon phosphorylation. Several studies have shown that phosphorylation regulates the structural dynamics of biomolecules [52–54]. The influence of phosphorylation on proline isomerization is biologically significant as there are proline-directed kinases, making pSer/Thr-Pro one of the most common phosphorylated sequence motifs [55, 56]. Furthermore, pSer/Thr-Pro motifs are targeted by peptidyl-prolyl cis-trans isomerases such as Pin1 that isomerize the peptide bond and effectively act as “molecular timers” that regulate biological processes [55, 56].
Conclusions
In this study, a library of phosphopeptides was analyzed by IMS-MS to gain insight into the general influence of phosphorylation on peptide ion structure. In agreement with previous studies [29–31], we find that phosphorylation results in compaction of peptide conformations. By analyzing an extensive dataset, we are able to derive an intrinsic size parameter for the phosphoryl modification (0.64 ± 0.05). This value allows for the prediction of 85% of peptide cross sections within ±2.5%. But more importantly, it illustrates the spectacular role that phosphorylation plays in establishing the overall peptide structure. Remembering that ISPs are a mass-independent parameter, the value for the phosphoryl group is half of that which we measure for the nonpolar, palmitoyl group (see Figure 3).
Additionally, it was found that IMS can be used to monitor the influence of phosphorylation on the conformational heterogeneity that arises from the cis-trans isomerization of proline residues. It is interesting to consider that several solution-based studies have shown that phosphorylation influences that dynamics of cis-trans isomerization of Ser/Thr–Pro peptide bonds [52, 53]. This suggests that IMS-MS techniques can be used in phosphoproteomics studies to not only improve identification but also to gain insight into the role of phosphorylation in regulating the structure.
Acknowledgments
The authors acknowledge David Smiley of the DiMarchi research group at Indiana University for assistance with the peptide synthesis. This work is supported by a grant from the NIH (R01 GM103725).
References
- 1.Cohen P. The regulation of protein function by multisite phosphorylation—a 25-year update. Trends Biochem Sci. 2000;25:596–601. doi: 10.1016/s0968-0004(00)01712-6. [DOI] [PubMed] [Google Scholar]
- 2.Hunter T. Signaling—2000 and beyond. Cell. 2000;100:113–127. doi: 10.1016/s0092-8674(00)81688-8. [DOI] [PubMed] [Google Scholar]
- 3.Flynn A, Proud CG. Serine 209, not serine 53, is the major site of phosphorylation in initiation factor eIF-4E in serum-treated Chinese hamster ovary cells. J Biol Chem. 1995;270:21684–21688. doi: 10.1074/jbc.270.37.21684. [DOI] [PubMed] [Google Scholar]
- 4.Krutzik PO, Irish JM, Nolan GP, Perez OD. Analysis of protein phosphorylation and cellular signaling events by flow cytometry: techniques and clinical applications. Clin Immunol. 2004;110:206–221. doi: 10.1016/j.clim.2003.11.009. [DOI] [PubMed] [Google Scholar]
- 5.Mann M, Jensen ON. Proteomic analysis of post-translational modifications. Nat Biotechnol. 2003;21:255–261. doi: 10.1038/nbt0303-255. [DOI] [PubMed] [Google Scholar]
- 6.Zhang Y, Fonslow BR, Shan B, Baek MC, Yates JR., III Protein analysis by shotgun/bottom-up proteomics. Chem Rev. 2013;113:2343–2394. doi: 10.1021/cr3003533. [DOI] [PMC free article] [PubMed] [Google Scholar]
- 7.Beausoleil SA, Jedrychowski M, Schwartz D, Elias JE, Villén J, Li J, Cohn MA, Cantley LC, Gygi SP. Large-scale characterization of HeLa cell nuclear phosphoproteins. Proc Natl Acad Sci U S A. 2004;101:12130–12135. doi: 10.1073/pnas.0404720101. [DOI] [PMC free article] [PubMed] [Google Scholar]
- 8.Pinkse MW, Uitto PM, Hilhorst MJ, Ooms B, Heck AJR. Selective isolation at the femtomole level of phosphopeptides from proteolytic digests using 2D-NanoLC-ESI-MS/MS and titanium oxide precolumns. Anal Chem. 2004;76:3935–3943. doi: 10.1021/ac0498617. [DOI] [PubMed] [Google Scholar]
- 9.Shi SD, Hemling ME, Carr SA, Horn DM, Lindh I, McLafferty FW. Phosphopeptide/phosphoprotein mapping by electron capture dissociation mass spectrometry. Anal Chem. 2001;73:19–22. doi: 10.1021/ac000703z. [DOI] [PubMed] [Google Scholar]
- 10.Syka JE, Coon JJ, Schroeder MJ, Shabanowitz J, Hunt DF. Peptide and protein sequence analysis by electron transfer dissociation mass spectrometry. Proc Natl Acad Sci U S A. 2004;101:9528–9533. doi: 10.1073/pnas.0402700101. [DOI] [PMC free article] [PubMed] [Google Scholar]
- 11.Olsen JV, Macek B, Lange O, Makarov A, Horning S, Mann M. Higher-energy C-trap dissociation for peptide modification analysis. Nat Methods. 2007;4:709–712. doi: 10.1038/nmeth1060. [DOI] [PubMed] [Google Scholar]
- 12.Grimsrud PA, Swaney DL, Wenger CD, Beauchene NA, Coon JJ. Phosphoproteomics for the Masses. ACS Chem Biol. 2010;5:105–119. doi: 10.1021/cb900277e. [DOI] [PMC free article] [PubMed] [Google Scholar]
- 13.McLean JA, Ruotolo BT, Gillig KJ, Russell DH. Ion mobility-mass spectrometry: a new paradigm for proteomics. Int J Mass Spectrom. 2005;240:301–315. [Google Scholar]
- 14.Valentine SJ, Ewing M, Dilger JM, Glover MS, Geromanos S, Hughes C, Clemmer DE. Using ion mobility data to improve peptide identification: cross section databases and intrinsic amino acid size parameters. J Proteome Res. 2011;10:2318–2329. doi: 10.1021/pr1011312. [DOI] [PMC free article] [PubMed] [Google Scholar]
- 15.Distler U, Kuharev J, Navarro P, Levin Y, Schild H, Tenzer S. Drift time-specific collision energies enable deep-coverage data-independent acquisition proteomics. Nat Methods. 2014;11:167–170. doi: 10.1038/nmeth.2767. [DOI] [PubMed] [Google Scholar]
- 16.Helm D, Vissers JP, Hughes CJ, Hahne H, Ruprecht B, Pachl F, Grzyb A, Richardson K, Wildgoose J, Maier SK, Marx H, Wilhelm M, Becher I, Lemeer S, Bantscheff M, Langridge JI, Kuster B. Ion mobility tandem mass spectrometry enhances performance of bottom-up proteomics. Mol Cell Proteom. 2014;13:3709–3715. doi: 10.1074/mcp.M114.041038. [DOI] [PMC free article] [PubMed] [Google Scholar]
- 17.Baker ES, Burnum-Johnson KE, Ibrahim YM, Orton DJ, Monroe ME, Kelly RT, Moore RJ, Zhang X, Théberge R, Costello CE, Smith RD. Enhancing bottom-up and top-down proteomic measurements with ion mobility separations. Proteomics. 2015 doi: 10.1002/pmic.201500048. [DOI] [PMC free article] [PubMed] [Google Scholar]
- 18.Bohrer BC, Merenbloom SI, Koeniger SL, Hilderbrand AE, Clemmer DE. Biomolecule analysis by ion mobility spectrometry. Annu Rev Anal Chem. 2008;1:293–327. doi: 10.1146/annurev.anchem.1.031207.113001. [DOI] [PMC free article] [PubMed] [Google Scholar]
- 19.Wyttenbach T, Pierson NA, Clemmer DE, Bowers MT. Ion mobility analysis of molecular dynamics. Annu Rev Phys Chem. 2014;65:175–196. doi: 10.1146/annurev-physchem-040513-103644. [DOI] [PubMed] [Google Scholar]
- 20.Wu C, Siems WF, Klasmeier J, Hill HH., Jr Separation of isomeric peptides using electrospray ionization/high-resolution ion mobility spectrometry. Anal Chem. 2000;72:391–395. doi: 10.1021/ac990601c. [DOI] [PubMed] [Google Scholar]
- 21.Ibrahim YM, Shvartsburg AA, Smith RD, Belov ME. Ultrasensitive identification of localization variants of modified peptides using ion mobility spectrometry. Anal Chem. 2011;83:5617–5623. doi: 10.1021/ac200719n. [DOI] [PMC free article] [PubMed] [Google Scholar]
- 22.Pierson NA, Chen L, Valentine SJ, Russell DH, Clemmer DE. Number of solution states of bradykinin from ion mobility and mass spectrometry measurements. J Am Chem Soc. 2011;133:13810–13813. doi: 10.1021/ja203895j. [DOI] [PMC free article] [PubMed] [Google Scholar]
- 23.Silveira JA, Fort KL, Kim D, Servage KA, Pierson NA, Clemmer DE, Russell DH. From solution to the gas phase: stepwise dehydration and kinetic trapping of Substance P reveals the origin of peptide conformations. J Am Chem Soc. 2013;135:19147–19153. doi: 10.1021/ja4114193. [DOI] [PubMed] [Google Scholar]
- 24.Shi L, Holliday AE, Shi H, Zhu F, Ewing MA, Russell DH, Clemmer DE. Characterizing intermediates along the transition from polyproline I to polyproline II using ion mobility spectrometry-mass spectrometry. J Am Chem Soc. 2014;136:12702–12711. doi: 10.1021/ja505899g. [DOI] [PubMed] [Google Scholar]
- 25.Myung S, Lee YJ, Moon MH, Taraszka JA, Sowell R, Koeniger SL, Hilderbrand AE, Valentine SJ, Cherbas L, Cherbas P, Kaufmann TC, Miller DF, Mechref Y, Novotny MV, Ewing MA, Clemmer DE. Development of high-sensitivity ion trap-IMS-TOF techniques: a high-throughput nano-LC/IMS/TOF separation of the drosophila fly proteome. Anal Chem. 2003;75:5137–5145. doi: 10.1021/ac030107f. [DOI] [PubMed] [Google Scholar]
- 26.Moon MH, Myung S, Plasencia M, Hilderbrand AE, Clemmer DE. Nanoflow LC/ion mobility/CID/TOF for proteomics: analysis of a human urinary proteome. J Proteome Res. 2003;2:589–597. doi: 10.1021/pr034018v. [DOI] [PubMed] [Google Scholar]
- 27.Taraszka JA, Kurulugama R, Sowell R, Valentine SJ, Koeniger SL, Arnold RJ, Miller DF, Kaufman TC, Clemmer DE. Mapping the proteome of drosophila melanogaster: analysis of embryos and adult heads by LC-IMS-MS methods. J Proteome Res. 2005;4:1223–1237. doi: 10.1021/pr050038g. [DOI] [PubMed] [Google Scholar]
- 28.Liu X, Valentine SJ, Plasencia MD, Trimpin S, Naylor S, Clemmer DE. Mapping the human plasma proteome by SCX-LC-IMS-MS. J Am Soc Mass Spectrom. 2007;18:1249–1264. doi: 10.1016/j.jasms.2007.04.012. [DOI] [PMC free article] [PubMed] [Google Scholar]
- 29.Ruotolo BT, Verbeck IV GF, Thomson LM, Woods AS, Gillig KJ, Russell DH. Distinguishing between phosphorylated and nonphosphorylated peptides with ion mobility-mass spectrometry. J Proteome Res. 2002;1:303–306. doi: 10.1021/pr025516r. [DOI] [PubMed] [Google Scholar]
- 30.Ruotolo BT, Gillig KJ, Woods AS, Egan TF, Ugarov MV, Schultz JA, Russell DH. Analysis of phosphorylated peptides by ion mobility-mass spectrometry. Anal Chem. 2004;76:6727–6733. doi: 10.1021/ac0498009. [DOI] [PubMed] [Google Scholar]
- 31.Thalassinos K, Grabenauer M, Slade SE, Hilton GR, Bowers MT, Scrivens JH. Characterization of phosphorylated peptides using traveling wave-based and drift cell ion mobility mass spectrometry. Anal Chem. 2009;81:248–254. doi: 10.1021/ac801916h. [DOI] [PubMed] [Google Scholar]
- 32.Xuan Y, Creese AJ, Horner JA, Cooper HJ. High-field asymmetric waveform ion mobility spectrometry (FAIMS) coupled with high-resolution electron transfer dissociation mass spectrometry for the analysis of isobaric phosphopeptides. Rapid Commun Mass Spectrom. 2009;23:1963–1969. doi: 10.1002/rcm.4101. [DOI] [PubMed] [Google Scholar]
- 33.Shvartsburg AA, Creese AJ, Smith RD, Cooper HJ. Separation of peptide isomers with variant modified sites by high-resolution differential ion mobility spectrometry. Anal Chem. 2010;82:8327–8334. doi: 10.1021/ac101878a. [DOI] [PMC free article] [PubMed] [Google Scholar]
- 34.Bridon G, Bonneil E, Muratore-Schroeder T, Caron-Lizotte O, Thibault P. Improvement of phosphoproteome analyses using FAIMS and decision tree fragmentation. application to the insulin signaling pathway in Drosophila melanogaster S2 cells. J Proteome Res. 2012;11:927–940. doi: 10.1021/pr200722s. [DOI] [PubMed] [Google Scholar]
- 35.Creese AJ, Smart J, Cooper HJ. Large-scale analysis of peptide sequence variants: the case for high-field asymmetric waveform ion mobility spectrometry. Anal Chem. 2013;85:4836–4843. doi: 10.1021/ac400646m. [DOI] [PMC free article] [PubMed] [Google Scholar]
- 36.Lee S, Li Z, Valentine SJ, Zucker SM, Webber N, Reilly JP, Clemmer DE. Extracted fragment ion mobility distributions: a new method for complex mixture analysis. Int J Mass Spectrom. 2012;309:154–160. doi: 10.1016/j.ijms.2011.09.011. [DOI] [PMC free article] [PubMed] [Google Scholar]
- 37.Donohoe GC, Maleki H, Arndt JR, Khakinejad M, Yi J, McBride C, Nurkiewicz TR, Valentine SJ. A new ion mobility-linear ion trap instrument for complex mixture analysis. Anal Chem. 2014;86:8121–8128. doi: 10.1021/ac501527y. [DOI] [PMC free article] [PubMed] [Google Scholar]
- 38.Turecek F, Moss CL, Pikalov I, Pepin R, Gulyuz K, Polfer NC, Bush MF, Brown J, Williams J, Richardson K. Gas-phase structures of phosphopeptide ions: a difficult case. Int J Mass Spectrom. 2013;354/355:249–256. [Google Scholar]
- 39.Kim D, Pai PJ, Creese AJ, Jones AW, Russell DH, Cooper HJ. Probing the electron capture dissociation mass spectrometry of phosphopeptides with traveling wave ion mobility spectrometry and molecular dynamics simulations. J Am Soc Mass Spectrom. 2015;26:1004–1013. doi: 10.1007/s13361-015-1094-1. [DOI] [PMC free article] [PubMed] [Google Scholar]
- 40.Gonzalez-Sancheza MB, Lanucaraa F, Hardmanb GE, Eyers CE. Gas-phase intermolecular phosphoryl transfer within a phosphohistidine phosphopeptide dimer. Int J Mass Spectrom. 2014;367:28–34. doi: 10.1016/j.ijms.2014.04.015. [DOI] [PMC free article] [PubMed] [Google Scholar]
- 41.Valentine SJ, Counterman AE, Hoaglund-Hyzer CS, Clemmer DE. Intrinsic amino acid size parameters from a series of 113 lysine-terminated tryptic digest peptide ions. J Phys Chem B. 1999;103:1203–1207. [Google Scholar]
- 42.Valentine SJ, Counterman AE, Clemmer DE. A database of 660 peptide ion cross sections: use of intrinsic size parameters for bona fide predictions of cross sections. J Am Soc Mass Spectrom. 1999;10:1188–1211. doi: 10.1016/S1044-0305(99)00079-3. [DOI] [PubMed] [Google Scholar]
- 43.Dilger JM, Valentine SJ, Glover MS, Ewing MA, Clemmer DE. A database of alkali metal-containing peptide cross sections: influence of metals on size parameters for specific amino acids. Int J Mass Spectrom. 2012;330/332:35–45. [Google Scholar]
- 44.Dilger JM, Valentine SJ, Glover MS, Clemmer DE. A database of alkaline-earth-coordinated peptide cross sections: insights into general aspects of structure. J Am Soc Mass Spectrom. 2013;24:768–779. doi: 10.1007/s13361-013-0579-z. [DOI] [PubMed] [Google Scholar]
- 45.Li Z, Dilger JM, Pejaver V, Smiley D, Arnold RJ, Mooney SD, Mukhopadhyay S, Radivojac P, Clemmer DE. Intrinsic size parameters for palmitoylated and carboxyamidomethylated peptides. Int J Mass Spectrom. 2014;368:6–14. doi: 10.1016/j.ijms.2014.04.009. [DOI] [PMC free article] [PubMed] [Google Scholar]
- 46.Glover MS, Shi L, Fuller DR, Arnold RJ, Radivojac P, Clemmer DE. On the split personality of penultimate proline. J Am Soc Mass Spectrom. 2015;26:444–452. doi: 10.1007/s13361-014-1049-y. [DOI] [PMC free article] [PubMed] [Google Scholar]
- 47.Koeniger SL, Merenbloom SI, Valentine SJ, Jarrold MF, Udseth HR, Smith RD, Clemmer DE. An IMS-IMS analogue of MS-MS. Anal Chem. 2006;78:4161–4174. doi: 10.1021/ac051060w. [DOI] [PubMed] [Google Scholar]
- 48.Tang K, Shvartsburg AA, Lee HN, Prior DC, Buschbach MA, Li F, Tolmachev AV, Anderson GA, Smith RD. High-sensitivity ion mobility spectrometry/mass spectrometry using electrodynamic ion funnel interfaces. Anal Chem. 2005;77:3330–3339. doi: 10.1021/ac048315a. [DOI] [PMC free article] [PubMed] [Google Scholar]
- 49.Hoaglund CS, Valentine SJ, Sporleder CR, Reilly JP, Clemmer DE. Three-dimensional ion mobility/TOFMS analysis of electrosprayed biomolecules. Anal Chem. 1998;70:2236–2242. doi: 10.1021/ac980059c. [DOI] [PubMed] [Google Scholar]
- 50.Hilderbrand AE, Clemmer DE. Determination of sequence-specific intrinsic size parameters from cross sections for 162 tripeptides. J Phys Chem B. 2005;109:11802–11809. doi: 10.1021/jp050761u. [DOI] [PubMed] [Google Scholar]
- 51.Pierson NA, Chen L, Russell DH, Clemmer DE. Cis-trans isomerizations of proline residues are key to bradykinin conformations. J Am Chem Soc. 2013;135:3186–3192. doi: 10.1021/ja3114505. [DOI] [PMC free article] [PubMed] [Google Scholar]
- 52.Schutkowski M, Bernhardt A, Zhou X, Shen M, Reimer U, Rahfeld JU, Lu KP, Fischer G. Role of phosphorylation in determining the backbone dynamics of the serine/threonine-proline motif and Pin1 substrate recognition. Biochemistry. 1998;37:5566–5575. doi: 10.1021/bi973060z. [DOI] [PubMed] [Google Scholar]
- 53.Bielska AA, Zondlo NJ. Hyperphosphorylation of tau induces local polyproline II helix. Biochemistry. 2006;45:5527–5537. doi: 10.1021/bi052662c. [DOI] [PubMed] [Google Scholar]
- 54.Bah A, Vernon RM, Siddiqui Z, Krzeminski M, Muhandiram R, Zhao C, Sonenberg N, Kay LE, Forman-Kay JD. Folding of an intrinsically disordered protein by phosphorylation as a regulatory switch. Nature. 2015;519:106–109. doi: 10.1038/nature13999. [DOI] [PubMed] [Google Scholar]
- 55.Lu KP, Liou YC, Zhou XZ. Pinning down proline-directed phosphorylation signaling. Trends Cell Biol. 2002;12:164–172. doi: 10.1016/s0962-8924(02)02253-5. [DOI] [PubMed] [Google Scholar]
- 56.Lu KP, Finn G, Lee TH, Nicholson LK. Prolyl cis-trans isomerization as a molecular timer. Nat Chem Biol. 2007;3:619–629. doi: 10.1038/nchembio.2007.35. [DOI] [PubMed] [Google Scholar]