Abstract
In the syndrome of inappropriate antidiuretic hormone secretion (SIADH), hyponatremia is limited by onset of vasopressin-escape caused by loss of the water channel aquaporin-2 in the renal collecting duct despite high circulating vasopressin. Here, we use the methods of systems biology in a well-established rat model of SIADH to identify signaling pathways activated at the onset of vasopressin-escape. Using single-tubule RNA-Seq, full transcriptomes were determined in microdissected cortical collecting ducts of vasopressin-treated rats at 1, 2, and 4 days after initiation of oral water loading in comparison to time-control rats without water loading. The time-dependent mRNA abundance changes were mapped to gene sets associated with curated canonical signaling pathways and revealed evidence of perturbation of transforming growth factor β signaling and epithelial-to-mesenchymal transition on Day 1of water loading simultaneous with the initial fall in Aqp2 gene expression. On Day 2 of water loading, transcriptomic changes mapped to notch signaling and the transition from G0 into the cell cycle but arrest at the G2/M stage. There was no evidence of cell proliferation or altered principal or intercalated cell numbers. Exposure of vasopressin-treated cultured mpkCCD cells to transforming growth factor β resulted in a virtually complete loss of aquaporin-2. Thus, there is a partial epithelial-to-mesenchymal transition during vasopressin-escape with a subsequent shift from quiescence into the cell cycle with eventual arrest and loss of aquaporin-2.
Keywords: cortical collecting duct, transcriptome, TGFβ, cell cycle, aquaporin-2
INTRODUCTION
The syndrome of inappropriate antidiuretic hormone secretion (SIADH) is the most frequent cause of dilutional hyponatremia in hospitalized patients.1 In SIADH, high levels of circulating vasopressin persist even when serum osmolality falls to levels that normally totally suppress neurohypophyseal vasopressin secretion. Consequently, the kidney continues to reabsorb free water, leading to a progressive fall in serum osmolality (and sodium concentration). The extent of the fall is limited by the phenomenon of ‘vasopressin-escape’, which allows the kidneys to excrete free water despite sustained high levels of circulating vasopressin.2 Previous studies have demonstrated that vasopressin-escape is associated with a profound decrease in the expression of the Aqp2 gene,3 which codes for the vasopressin-regulated water channel, aquaporin-2 (AQP2).4,5 This results in markedly reduced water permeability of the collecting duct epithelium,6 increasing water excretion.
The transcriptional regulatory mechanisms and signaling pathways responsible for vasopressin-escape are unknown. The chief limiting factor in the investigation of the vasopressin-escape phenomenon is the fact that collecting duct principal cells make up only a small fraction of the renal cortex, where the suppression of AQP2 expression in vasopressin-escape is most pronounced. Thus, standard biochemical and systems biology techniques applied at a tissue level are not effective as a way of detecting responses in collecting duct principal cells. Recently, we have introduced single-tubule RNA-Seq techniques that are capable of quantifying the entire transcriptome in samples of microdissected renal tubules from rat kidney consisting of less than 2000 cells.7 In this study, we used small sample RNA-Seq applied to microdissected renal cortical collecting ducts (CCDs) to identify transcriptomic changes during onset of vasopressin-escape in a model of SIADH. The strategy was to carry out global measurements of transcript abundances to identify the changes that occur at the earliest stages in the induction of vasopressin-escape (one, two and four days after initiation of water loading in vasopressin-treated rats). The central question that we addressed was, “What signaling pathways are activated or inactivated during development of vasopressin-escape?” Based on the RNA-Seq results, we identified elements of TGFβ signaling, epithelial-to-mesenchymal transition (EMT), Notch signaling, and cell-cycle regulatory pathways as components of the cell signaling response during initiation of the vasopressin-escape phenomenon.
RESULTS
Using a standard animal model of SIADH3,6,8–11 (Figure 1A), we confirmed the marked decrease in AQP2 protein abundance in vasopressin-escape kidneys (dDAVP infusion plus water loading) relative to controls that received dDAVP and low water intake (Figure 1B and C). In a parallel set of vasopressin-escape rats, the plasma sodium decreased progressively from 137.2+0.4 on Day 1 to 124.3+1.5 on Day 2 to 114.2+1.5 mM on Day 4 (all measured in the same animals, n=5).
Figure 1. Experimental model.
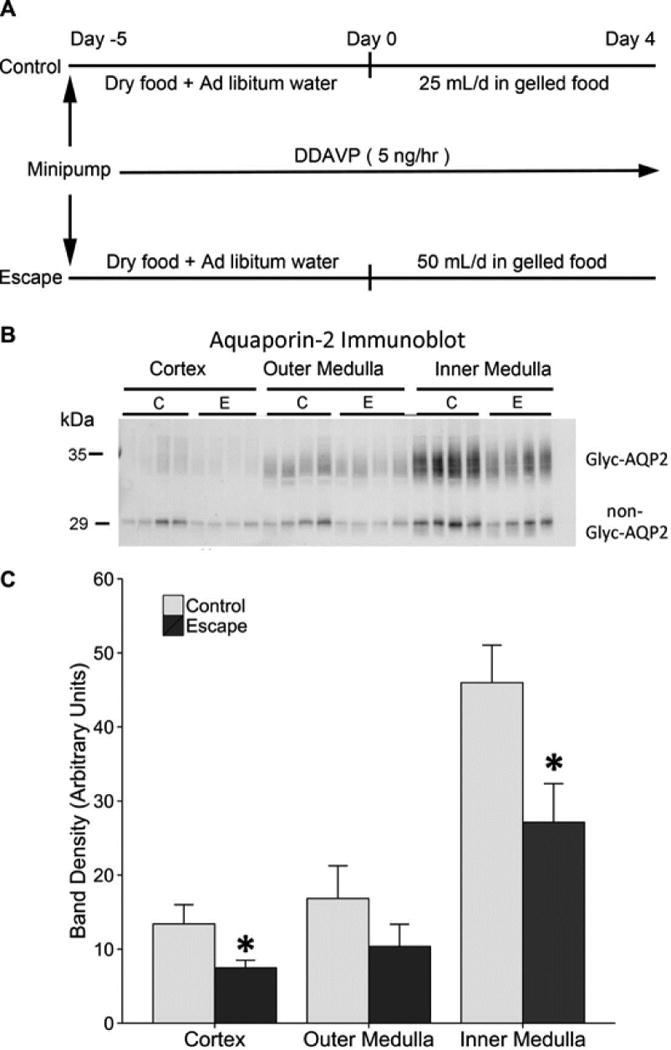
A. The study design was adapted from Ecelbarger et al.3. Rats were euthanized on day 1, 2, and 4. B. Immunoblotting for AQP2 in the cortex, outer medulla, and inner medulla (n=4 per group) at day 2 of escape protocol. C. Densitometry shows a significant decrease in aquaporin-2 protein abundance in the cortex and inner medulla of the escape animals, consistent with previous reports. For each lane, 10 g (cortex), 5 μg (outer medulla), and 2 μg (inner medulla) of total protein was loaded. *p < 0.05 by unpaired t-test. (Coomassie-stained gels, run in parallel, showed equal loading.) Glyc-AQP2, glycosylated aquaporin-2; non-Glyc-AQP2, nonglycosylated aquaporin-2.
RNA-Seq of microdissected CCDs: General features
We focused solely on the CCD to investigate transcriptomic changes occurring in vasopressin-escape rats as a function of time following the increase in water intake (vasopressin infusion plus increase in water intake) versus control (vasopressin infusion with no increase in water intake), employing single-tubule RNA-Seq.7 Among all RNA-Seq libraries, 81.3 to 85.3% of RNA-Seq reads were uniquely mapped to the reference genome (Rnor6.0), which compares favorably to previous single-tubule RNA-Seq data7 (Supplementary Dataset 1 [Supplementary datasets at https://hpcwebapps.cit.nih.gov/ESBL/Database/VasopressinEscapeData]). Overall, 12,951 to 14,357 transcripts were detected in the single-tubule RNA-Seq libraries (fragments per kilobase exons for million mapped reads [FPKM] > 0, Supplementary Dataset 1). All values are reported in Supplemental Dataset 2 and a summary is presented on a permanent web page (https://hpcwebapps.cit.nih.gov/ESBL/Database/VasopressinEscape/). The vast majority of transcripts (Figure 2) showed little or no change (Z* near zero).
Figure 2.
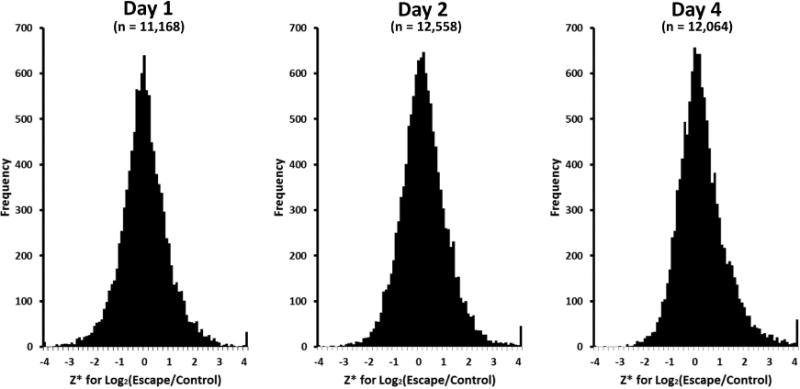
Distribution of Z* values for Log2(Escape/Control) across all genes. Z* is estimated as mean value for all replicates divided by the standard deviation across means for all genes.
We focused first on RNA-Seq results for the water channels, AQP2 and AQP3 (Figure 3). Mapped reads (Figure 3A) coincide with the exons of the Aqp2 and Aqp3 genes. The reads mapped to the Aqp2 and Aqp3 genes were decreased in vasopressin-escape relative to the control (Figure 3A–B). The changes at Day 2 were confirmed by quantitative real-time PCR (AQP2: mean escape-to-control ratio 0.55, p = 0.024 by unpaired t-test; AQP3: mean escape-to-control ratio 0.24, p = 0.0000052; Supplementary Dataset 3). The decreases in AQP2 and AQP3 transcript abundances began on Day 1 and were most striking at Day 4 (Figure 3C). Among all transporters and receptors, AQP2 and AQP3 were the only ones with demonstrable changes (Table 1). Thus, the vasopressin-escape process selectively targets the two water channels.
Figure 3.
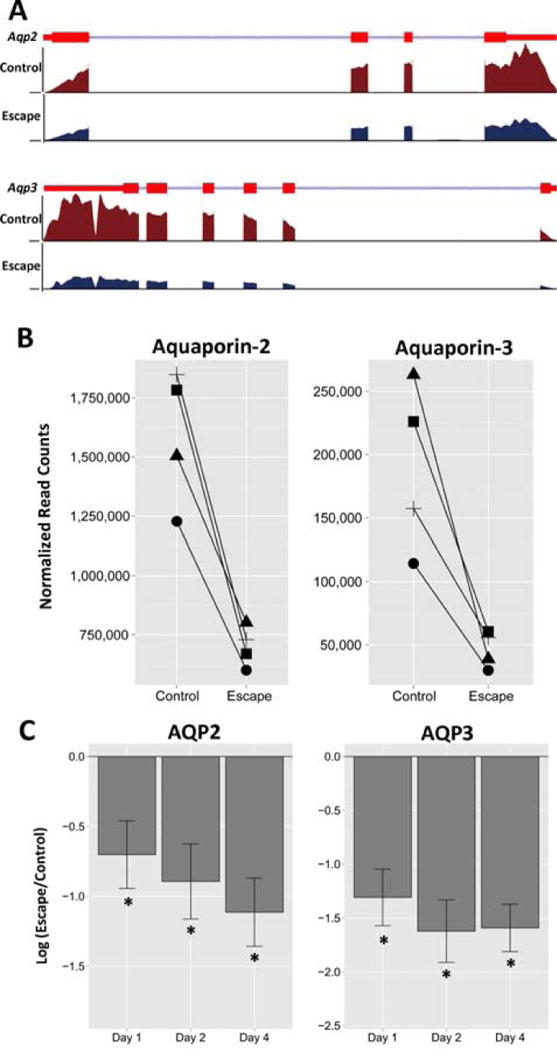
Abundances of aquaporin-2 (AQP2) and aquaporin-3 (AQP3) transcripts in the CCD are decreased in vasopressin-escape animals. A. RNA-Seq reads are mapped to the RefSeq transcript models of for rat Aqp2 gene (top) and Aqp3 gene (bottom). For each RefSeq transcript, exons are shown as red rectangles and introns as blue lines connecting the exons. Barbs indicate direction of transcription. The coverage was calculated as the number of reads per million nucleotides in the whole genome. B. Normalized RNA-Seq read counts for Aqp2 and Aqp3 in the CCD segments obtained from four pairs (control versus escape animals) at day 2. C. Change in AQP2 and AQP3 transcript abundances in the microdissected CCDs on different days relative to time controls (*Padj < 0.05 for escape vs control at each time point, paired t-test).
Table 1.
Transcript abundance changes in transporters and receptors expressed in principal cells of the rat renal CCD during the onset of vasopressin-escape. Values with P<0.05 in bold (Wald test).
| Log2 (Escape/Control) | ||||
|---|---|---|---|---|
| Gene Symbol | Annotation | Day 1 | Day 2 | Day 4 |
| Aqp2 | Aquaporin-2 | −0.70 | −0.89 | −1.11 |
| Aqp3 | Aquaporin-3 | −1.31 | −1.62 | −1.59 |
| Aqp4 | Aquaporin-4 | −0.75 | 0.21 | 0.26 |
| Atp1a1 | Na/K-ATPase subunit alpha-1 | 0.02 | 0.43 | 0.08 |
| Atp1b1 | Na/K-ATPase subunit beta-1 | −0.41 | −0.14 | −0.09 |
| Avpr2 | Vasopressin receptor V2 | 0.22 | −0.39 | −0.23 |
| Clcnka | Chloride channel ClC-Ka | −0.22 | −0.69 | −0.03 |
| Clcnkb | Chloride channel ClC-Kb | 0.14 | 0.20 | 0.20 |
| Fxyd2 | Na/K-ATPase subunit gamma subunit | −0.26 | 0.57 | 0.46 |
| Kcnj1 | Inward rectifier potassium channel 1 (ROMK) | 0.05 | 0.00 | 0.05 |
| Nr3c2 | Mineralocorticoid receptor | 0.46 | −0.51 | −0.03 |
| Scnn1a | Epithelial Na channel alpha subunit | −0.09 | 0.17 | −0.06 |
| Scnn1b | Epithelial Na channel beta subunit | −0.07 | −0.12 | 0.00 |
| Scnn1g | Epithelial Na channel gamma subunit | −0.15 | −0.47 | 0.24 |
Canonical signaling pathways
To interpret the RNA-Seq data at a systems level, we began by mapping up- and down-regulated transcripts to a set of known signaling pathways annotated in the KEGG Database. Table 2 summarizes the receptors, ligands and transcription factors (TFs) associated with each KEGG Pathway. The hypothesis is that transcripts coding for elements of one or more of these pathways will be perturbed during the development of the vasopressin-escape phenomenon.
Table 2.
Canonical Signaling Pathways Hypothetically Involved in Vasopressin-escape
| Signaling Pathway | Ligands | Receptors | TFs | Relevant KEGG Pathway* |
|---|---|---|---|---|
| Notch signaling | Delta, Jagged | Notch family | HES Family | Notch Signaling |
| Wnt signaling | Wnt family, Porcn | Frizzled receptors | TCF/LEF, MYC | Wnt Signaling |
| Growth signaling | Insulin/Insulin-like growth factors | Insulin receptor, Insulin-like growth factor receptor | Several Forkhead Box TFs | Insulin Signaling |
| Cyclic AMP signaling | Vasopressin/PGE2 | Avpr2, Avpr1a, Ptger4 | AP1, CREB Family, GLI, SOX, PPARA, NFAT | cAMP Signaling |
| Cyclic GMP signaling | Nitric Oxide | Soluble guanylate cyclase | CREB Family | cGMP-PKG Signalng |
| Shift from G0 to cell cycle (dedifferentiation) with arrest | EGF, FGF family, PDGF family | Growth factor receptors | E2F1, FOXM1 | Cell Cycle |
| Epithelial to mesenchymal transition/TGFβ signaling | TGFβ/Activin/Nodal/BMP | TGFβ receptor/Activin receptor/BMP Receptor | SNAIL family, TWIST, SMAD family, ZEB, AP1, ATF2, TGIF, PITX | TGF-Beta Signaling |
| MAP kinase signaling | EGF, FGF family, PDGF family | Growth factor receptors | ELK1, AP1, p53, NR4A1 | MAPK Signaling |
| Hedgehog signaling | Ihh, Dhh, Shh | Patched family, Smoothened | GLI family | Hedgehog Signaling |
| Hippo signaling | E-cadherin | E-cadherin | TEAD family | Hippo Signaling |
Pathways may be viewed at www.genome.jp or by searching “KEGG [pathway name]”.
Mapping RNA-Seq data to canonical signaling pathways
Figure 4 shows a summary of the RNA-Seq results with values presented as the mean Log2(Escape/Control) for the relevant TFs for the canonical signaling pathways on Days 1, 2 and 4. Most were either unchanged or not detectable throughout the time course (yellow boxes). However, a few key TFs in some of the signaling categories were seen to change, viz. TGFβ signaling/EMT (Snail3 and Smad3 increased on Day 1; Smad2 and Tgif1 increased on Day 4), MAPK signaling (Elk1 increased on Days 2 and 4; Nr4a2 decreased on Day 1), signaling associated with transition from G0 (quiescence) into the cell cycle (E2f1 and Foxm1 increased on Days 2 and 4; E2f2 increased on Day 2; E2f4 increased on Day 1), cyclic AMP signaling (Jun decreased on Day 2; Sox17 decreased on Day1; Nfatc3, increased on Day 4), and Notch signaling (Hes1 decreased on Days 2 and 4). Thus, we hypothesize that one or more of these pathways could be responsible for vasopressin-escape. We consider them in turn.
Figure 4.
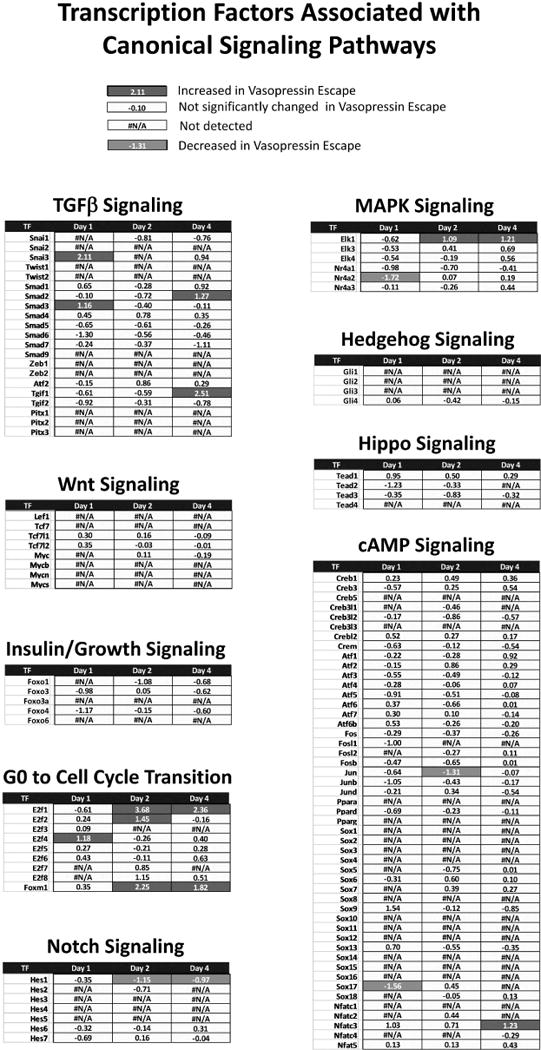
Changes in transcript abundances for TF genes associated with annotated KEGG pathways during the onset of vasopressin-escape.
TGFβ signaling and epithelial-to-mesenchymal transition
TGFβ signaling plays a central role in the induction of epithelial-to-mesenchymal transition (EMT),12 so we considered the two together. The increases in transcript abundances of Smad3 (a TGFβ-signaling mediator) and Snail3 (an EMT-mediator) occur at the earliest time point studied, pointing to the possibility that a change in TGFβ signaling or induction of an EMT could be an early event in vasopressin-escape. Looking at other mediators of TGFβ signaling (Figure 5 and Table 3, Supplemental Dataset 2), there were coordinate increases in Smad3 and downstream TFs E2f4 and Snai3 on Day 1, as well as Smad2 and downstream TF Tgif1 on Day 4. Thus, the weight of the evidence is in favor of downstream activation of TGFβ/BMP/activin-dependent signaling.
Figure 5.
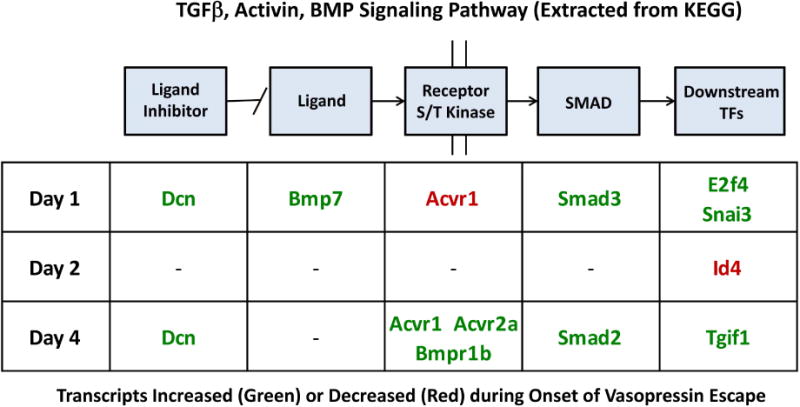
Official gene symbols of transcripts associated with TGFβ/activin/BMP signaling undergoing changes during onset of vasopressin-escape. Increased, green; decreased, red. See Table 4 for annotations of these genes. Specific values are available in Supplemental Dataset 2.
Table 3.
List of TGFβ signaling genes whose transcript abundances were seen to change significantly during onset of vasopressin-escape. See Figure 5 for day and direction of changes and Supplementary Table 2 for specific values.
| Gene Symbol | Protein Name | Function |
|---|---|---|
| Acvr1 | activin receptor type-1 (serine/threonine-protein kinase receptor R1) | On ligand binding, forms a receptor complex consisting of two type II and two type I transmembrane serine/threonine kinases. Type II receptors phosphorylate and activate type I receptors which autophosphorylate, then bind and activate SMAD transcriptional regulators. |
| Acvr2a | activin receptor type-2A | On ligand binding, forms a receptor complex consisting of two type II and two type I transmembrane serine/threonine kinases. Type II receptors phosphorylate and activate type I receptors which autophosphorylate, then bind and activate SMAD transcriptional regulators. Receptor for activin A, activin B and inhibin A. |
| Bmp7 | bone morphogenetic protein 7 precursor | Belongs to the TGF-beta family. Secreted ligand. Involved in renal development. |
| Bmpr1b | bone morphogenetic protein receptor type-1B (serine/threonine-protein kinase receptor R6) | On ligand binding, forms a receptor complex consisting of two type II and two type I transmembrane serine/threonine kinases. Type II receptors phosphorylate and activate type I receptors which autophosphorylate, then bind and activate SMAD transcriptional regulators. Receptor for BMP7. |
| Dcn | decorin | Binds to type I and type II collagen, fibronectin and TGF-beta. Belongs to the small leucine-rich proteoglycan (SLRP) family. Secreted. |
| E2f4 | TF E2F4 | Transcription activator that binds DNA cooperatively with DP proteins through the E2 recognition site. Found in the promoter region of a number of genes whose products are involved in cell cycle regulation or in DNA replication. E2F4 binds with high affinity to RBL1 and RBL2. |
| Id4 | DNA-binding protein inhibitor ID-4 | Transcriptional regulator (lacking a basic DNA binding domain) which negatively regulates the basic helix-loop-helix (bHLH) TFs by forming heterodimers and inhibiting their DNA binding and transcriptional activity. |
| Ppp2r1b | serine/threonine-protein phosphatase 2A 65 kDa regulatory subunit A beta isoform | Scaffolding molecule to coordinate the assembly of the catalytic subunit and a variable regulatory B subunit. PP2A consists of a common heterodimeric core enzyme, composed of a 36 kDa catalytic subunit (subunit C) and a 65 kDa constant regulatory subunit (PR65 or subunit A), that associates with a variety of regulatory subunits. |
| Smad2 | mothers against decapentaplegic homolog 2 | Intracellular signal transducer and transcriptional modulator activated by TGF-beta (transforming growth factor) and activin type 1 receptor kinases. Binds the TRE element in the promoter region of many genes that are regulated by TGF-beta and, on formation of the SMAD3/SMAD4 complex, activates transcription. Also can form aSMAD3/SMAD4/JUN/FOS complex at the AP-1/SMAD site to regulate TGF-beta-mediated transcription. Dephosphorylated by phosphatase PPM1A, resiulting in nuclear export. |
| Smad3 | mothers against decapentaplegic homolog 3 | Intracellular signal transducer and transcriptional modulator activated by TGF-beta (transforming growth factor) and activin type 1 receptor kinases. Binds the TRE element in the promoter region of many genes that are regulated by TGF-beta and, on formation of the SMAD3/SMAD4 complex, activates transcription. Also can form aSMAD3/SMAD4/JUN/FOS complex at the AP-1/SMAD site to regulate TGF-beta-mediated transcription. Dephosphorylated by phosphatase PPM1A, resiulting in nuclear export. |
| Snai3 | zinc finger protein SNAI3 | Transcriptional repressor of E-box-dependent transactivation of downstream basic-Helix-Loop-Helix genes |
| Tgif1 | homeobox protein TGIF1 | Binds to RXR element and nhibits the 9-cis-retinoic acid-dependent RXR alpha transcriptional activation. Interacts with CTBP, SMAD2, SMAD3 and HDAC1. |
A recent study has presented a meta-analysis listing 130 consensus “EMT-genes” that are consistently altered in EMT.13 We use this list to ask, “Are the consensus EMT-genes statistically over-represented among genes whose transcript abundances are altered on Day 1 of vasopressin-escape versus genes whose transcripts are not altered?” The answer is that transcripts corresponding to consensus EMT genes are indeed over-represented (Table 4). Looking at the time courses of change of some of these EMT-marker genes (Figure 6A), transcripts associated with mesenchymal cells (collagen type I α-1, collagen type VI α-1, matrix metallopeptidase 2 and vimentin) show a similar trend with no change or a decrease on Day 1 of vasopressin-escape followed by large increases on Days 2 and 4. In contrast, transcripts associated with differentiated epithelial cells (occludin and E-cadherin) show no substantial change. Thus, during the induction of vasopressin-escape, collecting duct cells show some characteristics of EMT, but do not manifest full-blown conversion to mesenchymal cells, a state that has been described by Kalluri and Weinberg as a ‘partial EMT’.14
Table 4.
Epithelial-to-mesenchymal transition (EMT) signature genes are more frequently represented among transcripts regulated in vasopressin-escape than among non-regulated transcripts (Chi-square analysis).
| Number of Regulated Transcripts* | Number of EMT Genes among Regulated Transcripts | Number of EMT Genes among Randomly Selected Transcriptsˆ | Chi-square | P (Chi-square)‡ | Bayes Factor† | |
|---|---|---|---|---|---|---|
| Day 1 | 412 | 11 | 2 | 6.135 | 0.013 | 0.047 |
| Day 2 | 370 | 9 | 2 | 4.39 | 0.036 | 0.111 |
| Day 4 | 670 | 9 | 3 | 2.97 | 0.085 | 0.227 |
For this analysis, ‘Regulated transcripts’ are those with Padj. <0.10 and |z*| >2
Median value from 5 randomly selected sets of transcripts with the same count as the set of regulated transcripts.
P(Chi-square) is presented as a measure of statistical significance.
Bayes Factor is presented as a measure of ‘weight of evidence’ and is the likelihood of the null hypothesis divided by the likelihood of the hypothesis that EMT genes are more frequent among the regulated transcripts.
Figure 6. Onset of vasopressin-escape is associated with a partial epithelial-to-mesenchymal transition in rat CCD cells.
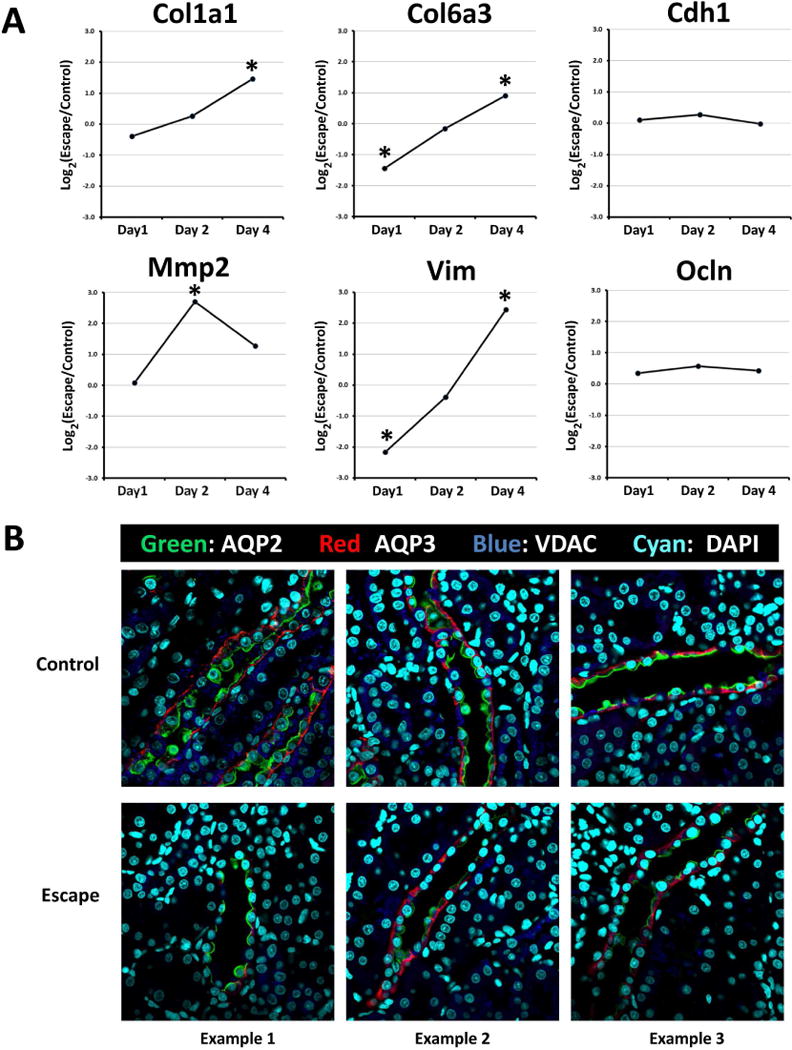
A. Time course of transcript abundance changes for selected EMT marker genes during onset of vasopressin-escape in microdissected rat CCDs shows increase in mesenchyme-associated transcripts (Col1a1, Col6a3, Mmp2 and Vim) without loss of epithelium-associated transcripts (Cdh1 and Ocln). Asterisk indicates Benjamini-Hochberg FDR-adjusted P value <0.05 (see Supplementary Table 2 for standard errors). B. Immunocytochemical labeling for AQP2 and AQP3 in renal cortex of rats undergoing vasopressin-escape shows retention of normal epithelial polarity. VDAC labeling of mitochondria was also carried out to reveal presence of intercalated (‘mitochondria-rich’) cells. DAPI labeling of nuclei facilitates recognition of apical versus basal aspects of cells.
AQP3 labeling remained on the basal and lateral aspects of the cell, while AQP2 labeling continued to be apically oriented (Figure 6B), although labeling for both was less intense. Thus, it appears that epithelial polarity is not lost in early stages of vasopressin-escape and that the reduction in water channel expression does not require loss of polarity.
If activation of TGFβ-signaling is critical for loss of Aqp2 gene expression in vasopressin-escape, then it might be expected that triggering of TGFβ-signaling in another manner, viz. by exposure of CCD cells directly to TGFβ, would reduce the abundance of AQP2 protein. Indeed, in AQP2-expressing mouse mpkCCD collecting duct cells,15 addition of TGFβ to vasopressin-treated cells for 48 hrs produced a profound decrease in AQP2 protein and mRNA abundance (Figure 7). The transepithelial resistance of these cells did not fall, but rather increased, indicating that the junctional barrier remained intact (Supplemental Figure 1).
Figure 7. TGFβ exposure decreases AQP2 protein and mRNA abundance in mpkCCD cells.
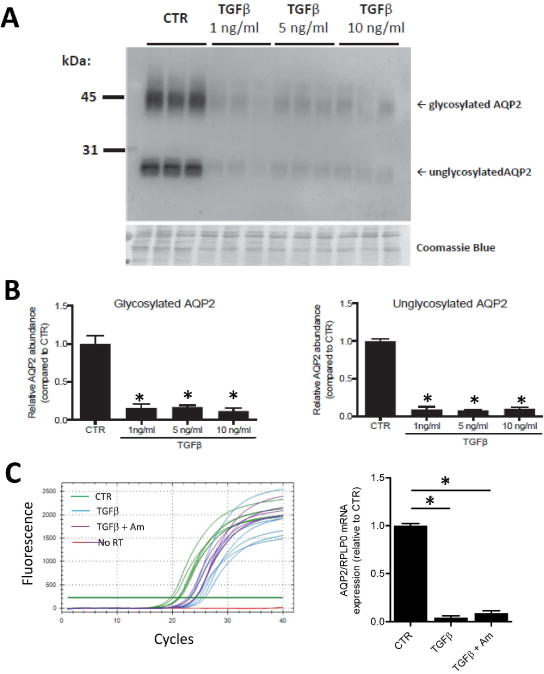
A. Representative immunoblot showing relative AQP2 abundances in control (CTR) cells and cells exposed to TGFβ (1, 5 or 10 ng/ml) for 2 days in serum-free medium. The cells were pretreated with 1 nM dDAVP on the basolateral side for 4 days to induce AQP2 expression. Bottom panel shows a Coomassie-stained gel to demonstrate equal loading. B. AQP2 band density was significantly decreased both for glycosylated and nonglycosylated AQP2 (n=3). C. SYBR Green™ fluorescence curves for RT-qPCR experiments quantifying AQP2 mRNA under the control (CTR) condition, after 1 ng/ml TGFβ (2 days) and after 1 ng/ml TGFβ plus amiloride at 10 μM (2 days). Cells were pre-treated with dDAVP at 1 nM for 4 days. Horizontal green line is the threshold used to calculate Ct. The relative AQP2 abundances (normalized to the housekeeping gene RPLP0) are shown as a bar graph.
Notch signaling and collecting duct remodeling
Notch signaling is an important factor in collecting duct remodeling, a process in which the relative abundances of the three major cell types in the CCD (principal cells [PCs], α-intercalated cells [α-ICs], and β-intercalated cells [β-ICs]) can undergo adaptive changes.16 The demonstrated decreases (Days 2 and 4) in the transcript abundance of the TF, Hes1, a mediator of Notch signaling, raise the possibility that Notch-related collecting duct remodeling is involved in vasopressin-escape (Figure 4). Accordingly, we used immunocytochemistry in microdissected CCDs to count the cell types using standard markers (pendrin ([β-IC marker] and Atp6v1b1 [total IC marker]; DAPI [total cell marker]) (Figure 8 and Supplemental Figure 2). (In this analysis, principal cell counts are estimated as the total cell count minus the intercalated cell count.) Table 5 shows that there were no significant differences in any cell type. We conclude that the decreases in AQP2 and AQP3 abundances were not likely to be due to a loss of PCs. Thus, there was little or no remodeling of the CCD in the vasopressin-escape rats.
Figure 8. Cell counting in immunofluorescently labeled CCDs microdissected from rats.
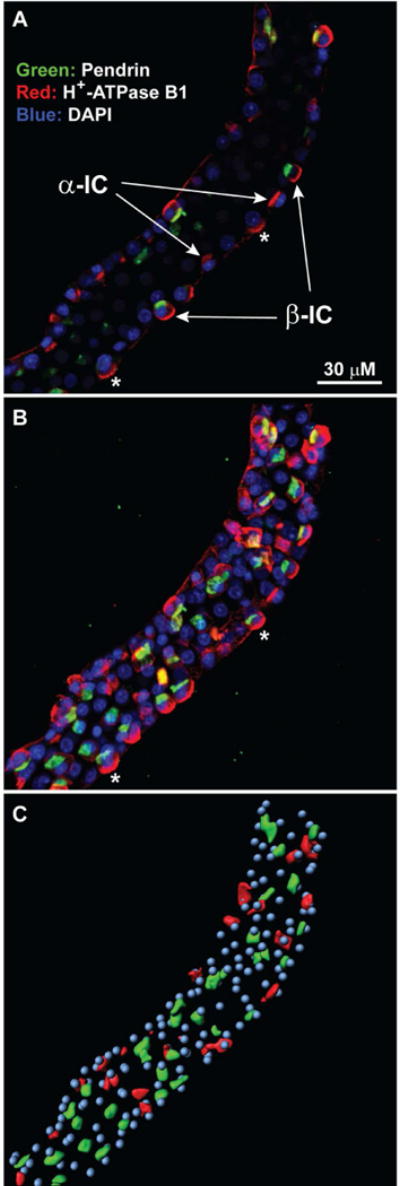
After microdissection, tubules were fixed with paraformaldehyde followed by immunofluorescence staining for intercalated cells (using pendrin and H+-ATPase antibodies) and nuclei (DAPI). A. Standard confocal fluorescence image of a microdissected CCD from a control vasopressin-treated rat. Pendrin, green; B1 H-ATPase, red; DAPI labeling of nuclei, blue. Examples of identified α-intercalated cells (α-IC) and β-intercalated cells (β-IC) are pointed out. Asterisks indicate cells that appear to lack pendrin labeling in confocal image but are revealed to be β-intercalated cells in the 3D reconstruction. B. Maximum intensity projection of 3-D reconstructed tubule image generated by IMARIS image analysis software. Colors are the same as in Panel A. Asterisks mark the same cells indicated in Panel A. C. IMARIS-generated analytical image. The pendrin-positive IC cells and non-pendrin IC cells were labeled in green and red, respectively, based on IMARIS surface and spot analysis tools. Nuclei are shown in cyan. For details, see Supplemental Figure 2.
Table 5.
Comparisons of cell populations in microdissected CCDs from rats undergoing vasopressin-escape compared with control rats.
| # Nuclei per mm length | % Pendrin-positive ICs | % Pendrin-negative ICs | % Total ICs | Ratio PCs:ICs | Ratio α-ICs: β-ICs | |
|---|---|---|---|---|---|---|
| Control 1 | 547 | 21 | 15 | 37 | 1.69 | 0.75 |
| Control 2 | 575 | 27 | 16 | 44 | 1.30 | 0.57 |
| Control 3 | 479 | 22 | 19 | 41 | 1.45 | 0.84 |
| Control 4 | 453 | 17 | 29 | 46 | 1.16 | 1.80 |
|
| ||||||
| Mean ± SE | 514 ± 29 | 22 ± 2 | 20 ± 3 | 42 ± 2 | 1.40 ± 0.11 | 0.99 ± 0.27 |
| Escape 1 | 449 | 20 | 21 | 41 | 1.40 | 1.16 |
| Escape 2 | 583 | 19 | 16 | 36 | 1.99 | 0.86 |
| Escape 3 | 555 | 21 | 16 | 39 | 1.55 | 0.77 |
| Escape 4 | 451 | 14 | 22 | 42 | 1.45 | 2.06 |
|
| ||||||
| Mean ± SE | 509 ± 35 | 19 ± 1 | 19 ± 2 | 40 ± 1 | 1.60 ± 0.13 | 1.21 ± 0.29 |
| p-Value | 0.93 | 0.26 | 0.82 | 0.33 | 0.30 | 0.60 |
A total of 35 microdissected CCDs were analyzed, 13 from Control rats and 22 from Escape rats. There were no statistically differences between two groups of animals (unpaired Student’s t-test, n=4). Percent of principal cells (PCs) may be estimated as 100 minus the percent of total ICs. IC, intercalated cell.
Signaling associated with transition from G0 to cell cycle
The increases in transcript abundances of E2f1 and Foxm1 (Figure 4) on Day 2 and Day 4 of vasopressin-escape point to a possible role for the signaling process that shifts cells from the quiescent state (G0) into the cell cycle. The E2f family of winged-helix TFs are classical regulators of this transition17 and Foxm1 also plays key roles in transcriptional regulation of cell-cycle genes.18 Thus, we hypothesized that vasopressin-escape is associated with a shift from G0 to cell cycle progression in CCD cells. To test this, we identified Gene Ontology Biological Process terms enriched among transcripts altered in abundance on Day 2 of vasopressin-escape relative to unregulated genes (Table 6). The four Biological Process terms with the lowest false discovery rates were all associated with the cell cycle and cell division. The 49 regulated transcripts with the term ‘cell cycle’ are listed in Table 7. Remarkably, 46 of the 49 cell-cycle genes showed increases in transcript abundance (Log2[Escape/Control] > 0). The striking changes are further illustrated in Figure 9 and Supplemental Figure 3. Thus, the analysis showed a dramatic increase in most mRNA species coding for cell cycle proteins at Day 2 of vasopressin-escape. A similar analysis for Day 1 revealed a lack of a significant over-representation of the transcripts with the Gene Ontology Biological Process term ‘cell cycle’. However, on Day 4 (like Day 2), there was a marked over-representation of ‘cell cycle’ (Supplemental Datasets 4–6). Thus, the widespread induction of cell-cycle gene expression is not seen until Day 2, i.e. after the initial fall in AQP2 transcript abundance. The pattern of response is illustrated by Figure 10, which shows the time course for three key protein kinases involved in cell-cycle regulation (Cyclin-dependent kinase 1 [Cdk1], Polo-like kinase 1 [Plk1], and Aurora B kinase [Aurkb]) and for three transcriptional regulators involved in cell-cycle control (E2f1, Timeless, and Foxm1). These transcripts showed similar time courses of change with no change or a decrease on Day 1 and increases on Days 2 and 4, contrasting with transcripts not involved in cell-cycle regulation (Protein kinase A Catalytic α [Prkaca] and Homeobox B7 [Hoxb7]) shown in red).
Table 6.
Statistically over-represented Gene Ontology Biological Process terms among transcripts with altered abundance on Day 2 of vasopressin-escape.ˆ
| GO Biological Process Term* | Number of Genes | Fold Enrichment† | False Discovery Rate (%) | P (Fisher Exact) |
|---|---|---|---|---|
| cell cycle process | 44 | 6.6 | 4.10E-20 | 4.60E-24 |
| cell cycle | 49 | 5.7 | 5.40E-20 | 7.10E-24 |
| cell division | 22 | 8 | 4.30E-10 | 3.80E-14 |
| chromosome segregation | 15 | 15.1 | 6.40E-10 | 2.60E-14 |
| organelle organization | 47 | 2.6 | 2.40E-06 | 7.50E-10 |
| microtubule-based process | 19 | 5.2 | 2.90E-05 | 4.30E-09 |
| nitrogen compound metabolic process | 62 | 1.6 | 1.40E-01 | 7.00E-05 |
| negative regulation of biological process | 50 | 1.7 | 3.00E-01 | 1.50E-04 |
| DNA packaging | 9 | 5.2 | 4.10E-01 | 6.00E-05 |
| cellular response to stimulus | 27 | 2.1 | 5.30E-01 | 2.00E-04 |
| positive regulation of biological process | 55 | 1.6 | 6.30E-01 | 3.30E-04 |
“Altered transcripts” were those with Benjamini-Hochberg FDR-adjusted P value < 0.1.
Analysis used DAVID Functional Annotation tools (see (Methods) to identify all terms with False Discovery Rate (FDR) < 1%.
“Fold Enrichment” is the fraction of genes with the given GO term in the “regulated” list divided by the fraction of genes in full list (“regulated” + “unregulated”) with that term.
Table 7.
Altered transcripts in CCD on Day 2 of vasopressin-escape with Gene Ontology Biological Process term ‘Cell Cycle’*
| Gene Symbol | Annotation | Log2(Escape/Control) | Padj (Benjamini-Hochberg) |
|---|---|---|---|
| Mlf1 | myeloid leukemia factor 1 | 4.17 | 2.52E-13 |
| Tacc3 | transforming, acidic coiled-coil containing protein 3 | 3.57 | 2.39E-12 |
| Tubb5 | tubulin, beta 5 | 1.90 | 3.33E-12 |
| Cenpf | centromere protein F | 3.75 | 4.17E-12 |
| E2f1 | E2F TF 1 | 3.68 | 2.80E-11 |
| Uhrf1 | ubiquitin-like with PHD and ring finger domains 1 | 3.43 | 1.80E-08 |
| Ube2c | ubiquitin-conjugating enzyme E2C | 2.82 | 2.58E-08 |
| Aurkb | aurora kinase B | 2.64 | 2.34E-07 |
| Kifc1 | kinesin family member C1 | 2.02 | 2.54E-07 |
| Pole | polymerase (DNA directed), epsilon | 2.79 | 3.28E-07 |
| Fancd2 | Fanconi anemia, complementation group D2 | 2.96 | 1.92E-06 |
| Dscc1 | defective in sister chromatid cohesion 1 | 2.16 | 4.72E-06 |
| Spc25 | SPC25, NDC80 kinetochore complex component | 2.43 | 7.80E-06 |
| Cdca8 | cell division cycle associated 8 | 2.61 | 2.02E-05 |
| Plk1 | polo-like kinase 1 (Drosophila) | 2.46 | 4.09E-05 |
| Mcm6 | minichromosome maintenance complex component 6 | 1.83 | 6.77E-05 |
| Id4 | inhibitor of DNA binding 4 | −2.15 | 7.41E-05 |
| Brca1 | breast cancer 1 | 2.52 | 1.93E-04 |
| Ncaph | non-SMC condensin I complex, subunit H | 1.66 | 3.33E-04 |
| Aurka | aurora kinase A | 1.61 | 1.33E-03 |
| Racgap1 | Rac GTPase-activating protein 1 | 1.87 | 1.45E-03 |
| Mad2l1 | MAD2 (mitotic arrest deficient, homolog)-like 1 | 1.98 | 2.44E-03 |
| Stmn1 | stathmin 1 | 1.56 | 3.30E-03 |
| Cdc25b | cell division cycle 25 homolog B (S. pombe) | 1.57 | 3.61E-03 |
| Birc5 | baculoviral IAP repeat-containing 5 | 1.78 | 3.82E-03 |
| Cdc5l | CDC5 cell division cycle 5-like (S. pombe) | 1.38 | 4.31E-03 |
| Pttg1 | pituitary tumor-transforming 1 | 2.09 | 4.89E-03 |
| Cdc20 | cell division cycle 20 homolog (S. cerevisiae) | 1.64 | 4.97E-03 |
| Kif2c | kinesin family member 2C | 2.07 | 5.96E-03 |
| Katna1 | katanin p60 (ATPase-containing) subunit A1 | 1.49 | 7.35E-03 |
| Wee1 | wee 1 homolog (S. pombe) | 1.29 | 7.35E-03 |
| Kif18a | kinesin family member 18A | 1.98 | 7.83E-03 |
| Haus4 | HAUS augmin-like complex, subunit 4 | 1.19 | 7.84E-03 |
| Pola1 | polymerase (DNA directed), alpha 1 | 1.86 | 9.08E-03 |
| Cenpa | centromere protein A | 1.82 | 9.69E-03 |
| Nusap1 | nucleolar and spindle associated protein 1 | 1.65 | 9.69E-03 |
| Trip13 | thyroid hormone receptor interactor 13 | 1.68 | 9.69E-03 |
| Msh5 | mutS homolog 5 | 1.57 | 1.17E-02 |
| Ccna2 | cyclin A2 | 1.82 | 1.49E-02 |
| Cdca3 | cell division cycle associated 3 | 1.57 | 3.32E-02 |
| Rad51c | Rad51 homolog c | 1.55 | 3.62E-02 |
| Calm2 | calmodulin 2 | 1.21 | 3.95E-02 |
| Cdkn1b | cyclin-dependent kinase inhibitor 1B | −1.16 | 4.57E-02 |
| Txnl4b | thioredoxin-like 4B | 1.42 | 4.72E-02 |
| Mdm2 | Mdm2 p53 binding protein | −1.16 | 4.73E-02 |
| Timeless | timeless homolog | 1.57 | 5.35E-02 |
| Dlgap5 | discs, large homolog-associated protein 5 | 1.47 | 5.36E-02 |
| Nuf2 | NDC80 kinetochore complex component | 1.54 | 7.70E-02 |
| Ska2 | family with sequence similarity 33, member A | 1.49 | 9.01E-02 |
Includes all transcripts for “cell cycle” Gene Ontology term in Table 6.
Figure 9.
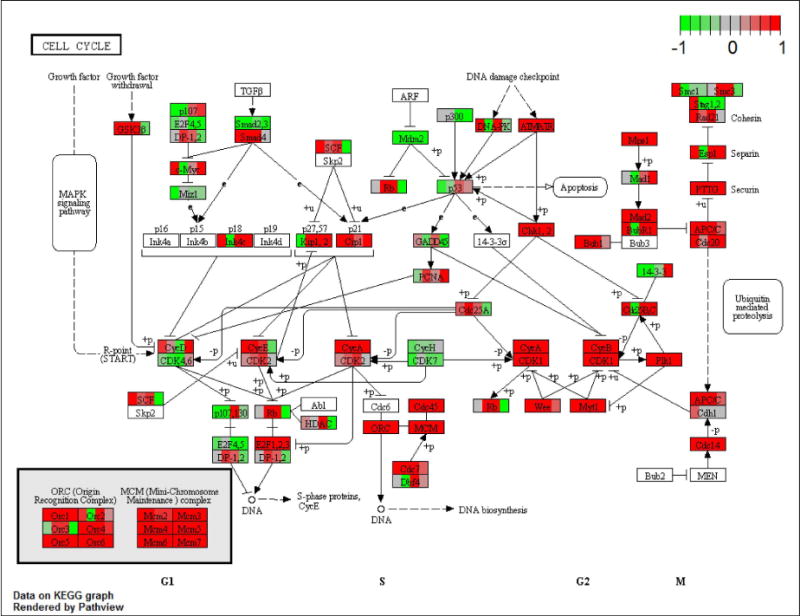
Transcripts corresponding to most genes present in the KEGG Cell Cycle Pathway were increased in abundance in CCDs from rats on Day 2 of development of vasopressin-escape. Values for all four Day-2 replicates are shown as individual blocks colored to show magnitude of change (red, increased; green, decreased) as generated by Bioconductor Pathview software (https://www.bioconductor.org/packages/devel/bioc/html/pathview.html) run on R. The specific values are available in Supplementary Dataset 1.
Figure 10.
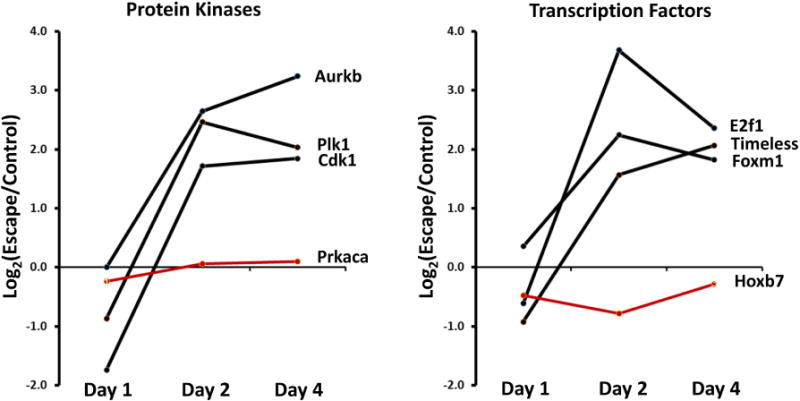
Time courses of abundance change for mRNAs coding for protein kinases (left) and TFs (right) involved in regulation of cell-cycle. All six cell-cycle related transcripts (black) showed significant increases only on Days 2 and 4. Only Foxm1 was significantly changed on Day 1, a decrease. Abundant non-cell-cycle transcripts (Prkaca and Hoxb7), shown in red, are included as controls. Cdk1, Cyclin-dependent kinase 1; Plk1, Polo-like kinase 1; Aurkb, Aurora B kinase, Prkaca, Protein kinase A catalytic α; E2f1, E2F TF 1; Timeless, timeless circadian clock; Foxm1, Forkhead Box M1; Hoxb7, Homeobox B7.
We asked whether the frequency of cells in S phase is increased in vasopressin-escape using immunocytochemical labeling of renal cortical sections with anti-proliferating cell nuclear antigen (PCNA) antibodies (Figure 11A). PCNA-positive cell nuclei were scarce in CCDs in under both conditions. Only 1 PCNA-positive cell nucleus was identified in 45 CCD profiles in dDAVP-only control animals, and only 4 PCNA-positive nuclei were detected in 89 CCD profiles observed in escape animals (p=0.67, Fisher Exact Test). To identify G2 phase and early M phase, we quantified the intensity of DAPI labeling in CCDs (Figure 11B). The median per-nucleus DAPI fluorescence is similar in the two groups (Table 8). Nuclei with total DAPI fluorescence greater than the indicated threshold (1.8 times median) were scarce in both escape (1.67% of total) and control (0.48% of total) CCDs. However, these proportions were statistically significantly different (P=0.005, Fisher Exact Test). This finding is compatible with a modest increase in the frequency of cells in G2/M. However, the previous observation that the total number of each cell type per total tubule length in microdissected CCDs does not change (Table 5) argues against a major increase in cell proliferation, and the entirety of the data could be viewed as consistent with arrest at G2/M. If a shift from quiescence to the cell cycle is in part responsible for the loss of AQP2 expression in vasopressin-escape, it may be predicted that inducing such a shift in cultured CCD (mpkCCD) cells by serum addition, with or without addition of agents that inhibit cell cycle progression at specific points, would reduce the abundance of AQP2 despite the continued presence of vasopressin. Indeed, in such experiments, AQP2 protein appears to be maximally expressed only in cells grown in the absence of fetal calf serum, i.e. in G0 (Figure 12). However, we cannot rule out the possibility that the decrease in AQP2 could also be caused by addition of factors that inhibit Aqp2 gene transcription independent of changes in the cell cycle.
Figure 11. Cell cycle indices in renal CCDs from vasopressin-escape versus control rats.
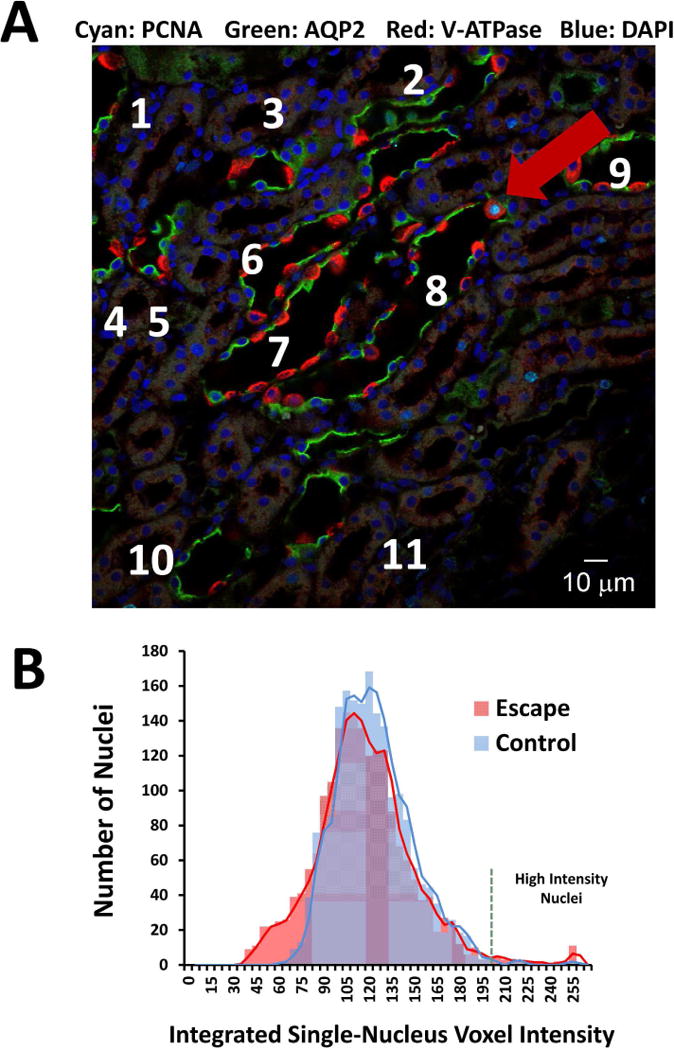
A. Nuclei labeled with antibody to PCNA (S-phase marker) are scarce. Image shows section of renal cortex from rat undergoing vasopressin-escape (Day 2). Labeling for AQP2 (green) and the B1 subunit of the vacuolar proton-ATPase (red) identify collecting ducts (numbered). A single collecting duct cell with PCNA labeling (cyan) is seen (red arrow). DAPI, blue. B. Distribution of integrated DAPI fluorescence signal in nuclei of microdissected CCDs from rats undergoing vasopressin-escape (Day 4 of escape protocol) versus control rats. See Table 8 for quantitation.
Table 8.
DAPI-Fluorescence per Nucleus in 4-Day Escape Versus Control Rats†
| Median Intensity | Standard Deviation | Total Nuclei Counted | Number of High Intensity Nuclei* | Percent High Intensity Nucleus | P (Fisher Exact)‡ | |
|---|---|---|---|---|---|---|
| Control | 116 | 26 | 1038 | 5 | 0.48 | |
| Escape | 111 | 33 | 1921 | 32 | 1.67 | 0.005 |
Values (arbitrary units) represent summation of fluorescence levels in all voxels mapping to a given nucleus using Imaris software (See Methods).
Number of nuclei above threshold of 200 arbitrary units (green vertical line in Figure 11B).
Probability of the null hypothesis that the proportion of high intensity nuclei is the same in CCDs from escape and control rats.
Figure 12. AQP2 protein is strongly expressed in cultured CCD cells in G0, but not when in the cell cycle.
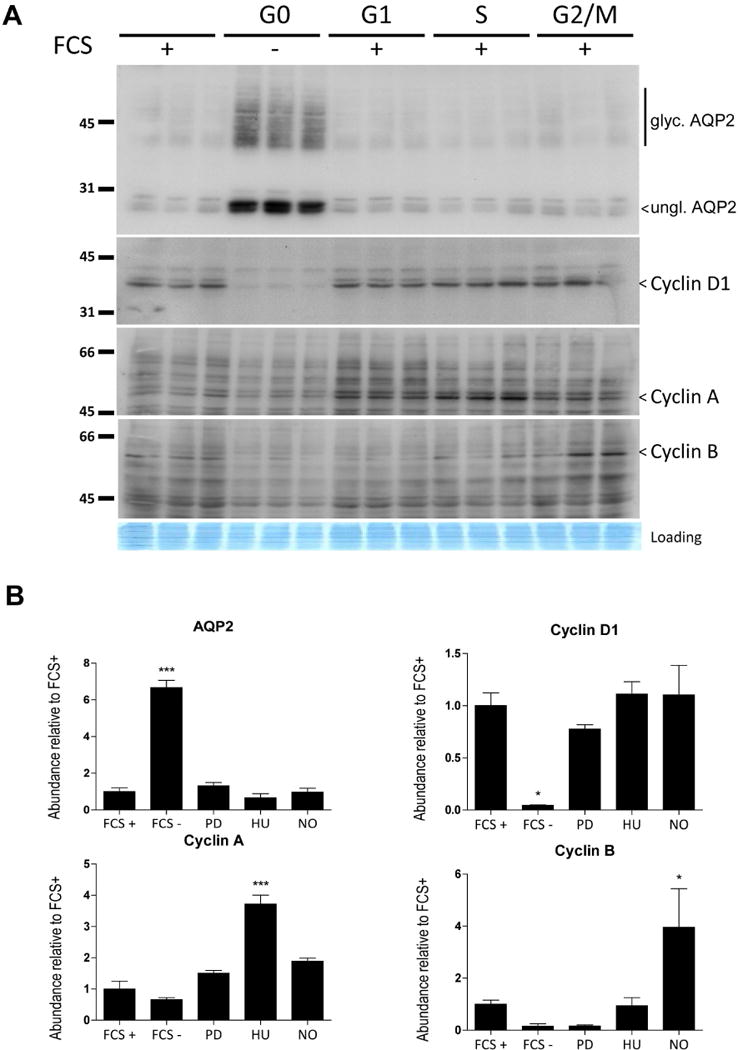
dDAVP-treated (1 nM) mpkCCD cells were grown on a semi-permeable filter and synchronized in the different phases of the cell cycle (FCS withdrawal for G0 phase, PD0332991 for G1, Hydroxyurea for S and Nocodazole for G2/M phase), then immunoblotted for AQP2 and Cyclins D1, A, and B.
DISCUSSION
Vasopressin-escape is a safety-valve mechanism that limits dilutional hyponatremia in SIADH and possibly other hyponatremic disorders.2 It attenuates water retention through the loss of expression of the Aqp2 gene, which codes for the aquaporin-2 water channel.3 Here, we have adopted a systems-biology-based approach19,20 to address the mechanism of vasopressin-escape. “Systems biology” uses large-scale data acquisition techniques (here, “single-tubule RNA-Seq”) to study a biological process (here, “vasopressin-escape”) by investigating all genes or gene products together to understand biological mechanisms, rather than focusing on one or a few selected genes.19 The data are interpreted, not on a gene-by-gene basis, but rather through detection of coordinate changes in curated groups of genes (here, genes whose products are elements of the canonical signaling pathways listed in Table 2). In the present study, we found statistically significant overlaps between the set of genes whose transcripts changed in abundance in vasopressin-escape and the sets of genes associated with two biological processes, viz. “epithelial-to-mesenchymal transition (EMT)/TGFβ signaling” and “the cell cycle”. The earliest detectable changes in the former process were seen on Day 1 of vasopressin-escape, coincident with the first detectable decreases in AQP2 and AQP3 proteins. The earliest statistically significant response for the cell-cycle pathway was seen on Day 2. We discuss these responses in turn. It is important to point out however, that the changes we observe in microdissected CCD include changes occurring in both intercalated and principal cells, thus it is premature to suggest they are unequivocally related to the fall in AQP2 or AQP3.
TGFβ signaling/EMT
The decrease of Aqp2 gene expression in the CCD during the onset of vasopressin-escape is temporally associated with gene expression changes resembling a partial EMT.14,21 A recent study by Li et al.22 has demonstrated a high degree of plasticity in collecting duct principal cells owing to a reversible EMT. The authors isolated AQP2-expressing principal cells from mouse kidney and the cells underwent an EMT (associated with loss of AQP2 expression) under culture conditions, but when they were re-injected into the renal medulla, they integrated selectively into the collecting duct and again expressed AQP2. This suggests that principal cells can lose AQP2 expression by EMT and then gain it back by mesenchymal-to-epithelial transition (MET). That is, according to this model, principal cells can reversibly switch between AQP2-expressing and AQP2-nonexpressing phenotypes. We speculate that the sort of partial EMT seen in the present study may represent a physiological mechanism, independent of vasopressin signaling, that may control AQP2 expression in response to decreases in serum sodium concentration or osmolality. Ureteral obstruction, another pathophysiological state accompanied by loss of AQP2 expression,23 has also been shown to be associated with induced EMT of collecting duct cells.24 Thus, the general picture of the CCD principal cell during the onset of vasopressin-escape appears to be consistent with a reversible state of ‘partial EMT’.14 The fact that the cells maintained their normal polarity also suggests a limited form of EMT, since full blown EMT is normally associated with loss of apical/basolateral polarity.25 A further question is whether EMT-like transcriptional changes or TGFβ signaling can account for the loss of AQP2 mRNA and protein in vasopressin-escape. To address this, we exposed vasopressin-treated mouse mpkCCD collecting duct cells to TGFβ, observing a profound decrease in AQP2 protein abundance in the cells. It is unclear, however, whether TGFβ or a similar extracellular mediator like BMP7, a key mediator in renal development26 whose mRNA was markedly increased on Day 1 (Figure 5), could play a role in vasopressin-escape.
Induction of expression of cell-cycle genes
The loss of AQP2 expression during vasopressin-escape was associated with a widespread increase in the expression of genes associated with the cell-cycle, seen on Days 2 and 4. Most of the genes annotated in the KEGG Cell Cycle Pathway exhibited increases in transcript abundance on Day 2 of the development of vasopressin-escape. Included were two TFs, E2f1 and Foxm1, which play critical roles in the regulation of the transition between quiescence and the cell cycle and were markedly increased on Days 2 and 4 of vasopressin-escape. E2f1 is the classical regulator of the transition from G0 to the cell cycle.17 In addition to E2f1, a second member of the E2F TF family, viz. E2f4 also shows increased expression during vasopressin-escape (Figure 5). E2f4 mediates some of the transcriptional effects of TGFβ through binding interactions with Smad3.27 Thus, it is possible that the increase in expression of cell-cycle genes in vasopressin-escape is a downstream consequence of activation of TGFβ–related signaling via E2f4, and that the EMT-like response and the induction of cell-cycle gene expression are parts of the same pathophysiological program. The Foxm1 TF, which like E2f1 regulates expression of cell-cycle genes critical for progression into S-phase,18 was also markedly increased in expression on Days 2 and 4 during vasopressin-escape (Figure 10). Despite the broad increase in expression of cell-cycle genes, there is little evidence for a proliferative response in CCD cells in the early stages of vasopressin-escape. A similar picture with cell cycle arrest at all stages is seen when mammalian cells are challenged with hypertonicity.28
Relationship to vasopressin signaling
Because of the strong, selective, down-regulation of Aqp2 and Aqp3 in vasopressin-escape and the known action of vasopressin to increase expression of these genes,3 an important question to ask is, “Is vasopressin-escape just a simple reversal of normal vasopressin-mediated signaling in the collecting duct?” There is considerable evidence in opposition to this idea. First, the β- and γ-subunits of ENaC (Scnn1b and Scnn1g) are also transcriptionally upregulated by vasopressin29, but were not found to be decreased in the current study. Second, transcriptional and proteomic profiling of mpkCCD cells30 showed a response profile that has little similarity to the list of transcripts downregulated in vasopressin-escape in the present study. Thus, we conclude that the transcriptional response in vasopressin-escape is not simply the mirror image of the response to vasopressin, but represents a vasopressin-independent regulatory mechanism.
METHODS
The experimental design for this study (Animal Study Protocol No. H-0110R2, NHLBI) was described previously3 (Figure 1). Male Sprague-Dawley rats (120–160 g) were subcutaneously implanted with osmotic minipumps (Alzet) releasing dDAVP (Bachem) at 5 ng/h. After 5 days of infusion, rats were divided into two groups (n=3 for each group for Day 1 and Day 4; n=4 for each group on Day 2). One group received a water load (“Escape”, 50 mL/day) in the form of a daily ration of gelled food containing 72% water, 27% finely-ground rat chow, and 1% agar. The other group received only 25 mL/day of water (“Control”) by feeding a gel containing 55% water, 43% chow, and 2% agar. The level of water intake in the control animals was based on a prior estimate of insensible water losses and does not result in hyponatremia.31 Each Escape rat was paired with a Control rat and both members of the pair were euthanized on the same day for tissue processing, alternating the order. Plasma sodium concentration was measured in heparinized blood samples from tail-snips, using an iSTAT hand-held analyzer with a CHEM8+ cartridge.
Microdissection of CCDs
We followed our standard protocol for microdissection of rat renal tubule segments.32 Approximately four millimeters of CCD segments were dissected per rat under a Wild M8 dissection stereomicroscope (Wild Heerbrugg) equipped with on-stage cooling.
RNA sequencing in microdissected tubules
The microdissected CCDs were processed for small sample RNA-Seq as described.7 The resulting cDNA libraries were sequenced using an Illumina HiSeq2000 (Illumina, Inc.) to generate 50-bp paired-end nucleotide sequences. The FASTQ sequences were mapped to a rat reference genome (Ensembl Rnor6.0) using STAR-2.4.0.1.33 The read count data were summarized at the gene level and processed using factor analysis.34 DESeq235 was used to generate Benjamini-Hochberg FDR-adjusted p-values for Log2(Escape/Control) values for each transcript based on Wald tests. The FASTQ sequences and metadata generated by this work have been deposited in NCBI’s Gene Expression Omnibus (GEO) (http://www.ncbi.nlm.nih.gov/geo/query/acc.cgi?token=axgfmcskxzmntep&acc=GSE69779).
Quantitative real-time PCR
Quantitative real-time PCR was carried out from cDNA libraries using a 7900HT PCR system (Applied Biosystems).30 Gene expression was compared using the ΔΔCT method.36 β-actin and glutaraldehyde-3-phosphate dehydrogenase were used as reference genes. Two-tailed Student’s t-test was used to compare values in control versus escape animals.
Identification of gene groups over-represented
We used Chi-square analysis to ask whether genes from a particular curated gene list were over-represented among genes whose transcript abundances were changed in vasopressin-escape compared to genes whose transcript abundances did not change. Curated lists for various signaling pathways were downloaded from KEGG (Kyoto Encyclopedia of Genes and Genomes) (http://www.genome.jp/kegg/) or from the literature (see Results). In addition, we used DAVID37 to identify Gene Ontology terms that were enriched in the set of genes whose transcripts changed relative to non-responding genes.
Quantitative immunocytochemistry in microdissected tubules
Determination of the numbers of each cell type per unit length in microdissected CCDs from escape and control rats was carried out using immunocytochemistry employing antibodies recognizing cell type specific markers, based on Purkerson et al.38 The primary antibodies used were goat anti-pendrin (G-19, sc-23779, Santa Cruz Biotechnology, Santa Cruz, CA) and a previously characterized rabbit anti-H+-ATPase V1-B1 subunit (L615,39), each at 1:50 dilution. The secondary antibodies were Alexa Fluor 488 donkey anti-goat and Alexa Fluor 555 donkey anti-rabbit IgG (A11055 and A31572, respectively, Invitrogen) each at 1:2000 dilution. Cell nuclei were also stained with DAPI. Confocal fluorescence images were recorded with a Zeiss LSM780 confocal microscope using a 20× objective lens. Cell counting was performed on three-dimensional reconstructed tubule images created by Imaris Scientific Image Processing & Analysis software (v7.7.1, Bitplane, Zurich, Switzerland). Counting was automated using Imaris “spot analysis” for nuclei and “surface analysis” to enumerate cells with apical pendrin or H+-ATPase labeling.
Immunocytochemistry and Western blotting of rat kidney
Kidneys from vasopressin-escape rats or control rats were perfusion fixed for immunocytochemistry following previously described procedures.40 Observations were made and recorded with a Zeiss LSM780 confocal microscope. The right kidney from 2-day escape microdissection experiments was dissected into cortex, outer, and inner medulla, and prepared for Western blotting as previously described.30 Sources of primary antibodies for blotting and immunocytochemistry are found in Table 941,42,43.
Table 9.
Antibodies Used for Immunocytochemistry and Western Blotting
| Antibody | Species | Approach | Dilution | Source | Reference | Expected size (non-glyc., glyc. kDa) |
|---|---|---|---|---|---|---|
| AQP2 | Rabbit | WB | 1:1000 | Knepper | 17 | 29, 35–50 |
| AQP2 | Chicken | IC | 1:300 | Knepper | 2 | 29, 35–50 |
| AQP3 | Rabbit | IC | 1:100 | Knepper | 11 | |
| VDAC | Mouse | IC | 1:500 | Abcam ab14374 | ||
| H-ATPase B/B2 subunit | Mouse | IC | 1:50 | Santa Cruz sc55544 | ||
| PCNA | Rabbit | IC | 1:100 | Abcam ab18197 | ||
| AQP2 | Rabbit | WB | 1:1000 | Deen | 5 | 29, 35–50 |
| Cyclin D1 | Rabbit | WB | 1:1000 | Cell Signaling 92G2 | 36 | |
| Cyclin A | Mouse | WB | 1:1000 | Thermo Fisher Scientific MA1-154 | 52 | |
| Cyclin B | Mouse | WB | 1:1000 | Thermo Fisher Scientific MA5-14319 | 55 |
WB- western blotting, IC- immunohistochemistry; glyc. – glycosylated
Quantitative RT-PCR
Total RNA was isolated from the samples using TRIzol extraction reagent according to the manufacturer’s instructions. RNA was then precipitated in ethanol, washed, and dissolved in nuclease-free water. Subsequently, RNA was reverse-transcribed into cDNA using Moloney murine leukemia virus reverse transcriptase (Invitrogen, Bleiswijk, the Netherlands). RT-qPCR assays were performed using SYBR Green kit (Bio-Rad, Veenendaal, the Netherlands). Primers were designed using the Primer-BLAST tool (http://www.ncbi.nlm.nih.gov/tools/primer-blast/). 36B4, which encodes an acidic ribosomal phosphoprotein P0 (RPLP0), was used as the reference (housekeeping) gene. Gene expression data were calculated using the Livak method (2−ΔΔCt) and they represent the mean fold difference from the control group.
Cell culture
Mouse mpkCCD cells were cultured as described.44
Statistics
The statistical methods used for each data type in this study are summarized in Table 10.
Table 10.
Statistical Methods
| Data Type | Measure | Metrics | Purpose | Criterion |
|---|---|---|---|---|
| RNA-Seq | Fragments per kilobase exons for million mapped reads (FPKM) | Padj; z value | Descriptive; Strength of evidence | none |
| Semi-Quantitative Immunoblotting of Kidney Tissue (Figure 1) | Normalized band density | P (unpaired t-test) | Testing null hypothesis | P<0.05 |
| Semi-Quantitative Immunoblotting of Cultured Cells (Figures 7 and 12) | Normalized band density | P (ANOVA; Bonferroni) | Testing null hypothesis | P<0.05/n |
| Enrichment of Genes from Cutated Lists in Vasopressin-escape Gene Lists | Number of transcripts | P (Chi-square) | Testing null hypothesis | P<0.05 |
| Enrichment of Gene Ontology Terms in Vasopressin-escape Gene Lists | Number of transcripts | P (Fisher Exact; DAVID) | Testing null hypothesis | P<0.05 |
| Cell Counts in Immunocytochemically Labeled, Microdissected Tubules | Number of cells | P (unpaired t-test) | Testing null hypothesis | P<0.05 |
| Cell Counts of PCNA positive cells | Number of cells | P (Chi-square) | Testing null hypothesis | P<0.05 |
| Cell Counts of high density DAPI-labeled nuclei | Number of cells | P (Fisher Exact) | Testing null hypothesis | P<0.05 |
Supplementary Material
Acknowledgments
The work was primarily funded by the Division of Intramural Research, National Heart, Lung, and Blood Institute (project ZIA-HL001285 and ZIA-HL006129, M.A.K.) with additional salary support to C.M.E. Georgetown University, Department of Medicine. Work by C.M.E. was done with the support of an Intergovernmental Personnel Agreement (IPA) for a sabbatical in the Epithelial Systems Biology Laboratory, NHLBI, NIH. Next-generation sequencing was done in the NHLBI DNA Sequencing and Genomics Core Facility (Jun Zhu, Director). The confocal immunofluorescence imaging was done in the NHLBI Light Microscopy Core Facility (Christopher Combs, Director) under the kind tutelage of Dr. Daniela Malide. Subcutaneous osmotic minipump implantation was performed by the NHLBI Animal Surgery and Resources Core staff. Some of the results were presented at the American Society of Nephrology Annual Meeting 2013 (Atlanta, GA), 2014 (Philadelphia, PA), and 2015 (San Diego, CA), as well as the Experimental Biology 2016 Meeting (San Diego, CA).
Footnotes
Publisher's Disclaimer: This is a PDF file of an unedited manuscript that has been accepted for publication. As a service to our customers we are providing this early version of the manuscript. The manuscript will undergo copyediting, typesetting, and review of the resulting proof before it is published in its final citable form. Please note that during the production process errors may be discovered which could affect the content, and all legal disclaimers that apply to the journal pertain.
AUTHOR CONTRIBUTIONS
Designed studies: J.W.L., M.A.K., C.M.E., P.M.T.D., T.deG.; conducted experiments: J.W.L. M.A., C.-L.C.; analyzed data: J.W.L., M.A., C.-L.C., T.deG., M.A.K., C.M.E.; drafted manuscript: J.W.L., M.A.K., C.M.E.; edited manuscript: J.W.L., M.A., C.-L.C., P.M.T.D., T.deG., M.A.K., C.M.E.; approved final version of manuscript J.W.L., M.A., C.-L.C., P.M.T.D., T.deG., M.A.K., C.M.E.
DISCLOSURES
The authors declare no conflicting financial interests.
References
- 1.Hannon MJ, Thompson CJ. The syndrome of inappropriate antidiuretic hormone: prevalence, causes and consequences. Eur J Endocrinol. 2010;162(Suppl 1):S5–12. doi: 10.1530/EJE-09-1063. [DOI] [PubMed] [Google Scholar]
- 2.Levinsky NG, Davidson DG, Berliner RW. Changes in urine concentration during prolonged administration of vasopressin and water. American Journal of Physiology. 1959;196:451–456. doi: 10.1152/ajplegacy.1959.196.2.451. [DOI] [PubMed] [Google Scholar]
- 3.Ecelbarger CA, Nielsen S, Olson BR, et al. Role of renal aquaporins in escape from vasopressin-induced antidiuresis in rat. Journal of Clinical Investigation. 1997;99:1852–1863. doi: 10.1172/JCI119352. [DOI] [PMC free article] [PubMed] [Google Scholar]
- 4.Sasaki S, Fushimi K, Saito H, et al. Cloning, characterization, and chromosomal mapping of human aquaporin of collecting duct. J Clin Invest. 1994;93:1250–1256. doi: 10.1172/JCI117079. [DOI] [PMC free article] [PubMed] [Google Scholar]
- 5.Deen PM, Verdijk MA, Knoers NV, et al. Requirement of human renal water channel aquaporin-2 for vasopressin-dependent concentration of the urine. Science. 1994;264:92–95. doi: 10.1126/science.8140421. [DOI] [PubMed] [Google Scholar]
- 6.Ecelbarger CA, Chou CL, Lee AJ, DiGiovanni SR, Verbalis JG, Knepper MA. Escape from vasopressin-induced antidiuresis: Role of vasopressin resistance of the collecting duct. American Journal of Physiology. 1998;274:F1161–F1166. doi: 10.1152/ajprenal.1998.274.6.F1161. [DOI] [PubMed] [Google Scholar]
- 7.Lee JW, Chou CL, Knepper MA. Deep Sequencing in Microdissected Renal Tubules Identifies Nephron Segment-Specific Transcriptomes. J Am Soc Nephrol. 2015;26:2669–2677. doi: 10.1681/ASN.2014111067. [DOI] [PMC free article] [PubMed] [Google Scholar]
- 8.Murase T, Ecelbarger CA, Baker EA, Tian Y, Knepper MA, Verbalis JG. Kidney aquaporin-2 expression during escape from antidiuresis is not related to plasma or tissue osmolality. J Am Soc Nephrol. 1999;10:2067–2075. doi: 10.1681/ASN.V10102067. [DOI] [PubMed] [Google Scholar]
- 9.Hoorn EJ, Hoffert JD, Knepper MA. Combined proteomics and pathways analysis of collecting duct reveals a protein regulatory network activated in vasopressin escape. J Am Soc Nephrol. 2005;16:2852–2863. doi: 10.1681/ASN.2005030322. [DOI] [PMC free article] [PubMed] [Google Scholar]
- 10.Ecelbarger CA, Knepper MA, Verbalis JG. Increased abundance of distal sodium transporters in rat kidney during vasopressin escape. J Am Soc Nephrology. 2001;12:207–217. doi: 10.1681/ASN.V122207. [DOI] [PubMed] [Google Scholar]
- 11.Tiwari S, Packer RK, Hu X, Sugimura Y, Verbalis JG, Ecelbarger CA. Increased renal alpha-ENaC and NCC abundance and elevated blood pressure are independent of hyperaldosteronism in vasopressin escape. Am J Physiol Renal Physiol. 2006;291:F49–F57. doi: 10.1152/ajprenal.00390.2005. [DOI] [PubMed] [Google Scholar]
- 12.Moustakas A, Heldin CH. Mechanisms of TGFbeta-Induced Epithelial-Mesenchymal Transition. J Clin Med. 2016;5 doi: 10.3390/jcm5070063. [DOI] [PMC free article] [PubMed] [Google Scholar]
- 13.Groger CJ, Grubinger M, Waldhor T, Vierlinger K, Mikulits W. Meta-analysis of gene expression signatures defining the epithelial to mesenchymal transition during cancer progression. PLoS One. 2012;7:e51136. doi: 10.1371/journal.pone.0051136. [DOI] [PMC free article] [PubMed] [Google Scholar]
- 14.Kalluri R, Weinberg RA. The basics of epithelial-mesenchymal transition. J Clin Invest. 2009;119:1420–1428. doi: 10.1172/JCI39104. [DOI] [PMC free article] [PubMed] [Google Scholar]
- 15.Yu MJ, Miller RL, Uawithya P, et al. Systems-level analysis of cell-specific AQP2 gene expression in renal collecting duct. Proc Natl Acad Sci U S A. 2009;106:2441–2446. doi: 10.1073/pnas.0813002106. [DOI] [PMC free article] [PubMed] [Google Scholar]
- 16.Grimm PR, Lazo-Fernandez Y, Delpire E, et al. Integrated Compensatory Network is Activated in Absence of NCC Phosphorylation. Journal of Clinical Investigation. 2015;125:2136–50. doi: 10.1172/JCI78558. [DOI] [PMC free article] [PubMed] [Google Scholar]
- 17.Alberts B, Johnson A, Lewis J, Raff M, Roberts K, Walter P. Molecular Biology of the Cell. 4th. New York: Garland Science; 2002. [Google Scholar]
- 18.Wang IC, Chen YJ, Hughes D, et al. Forkhead box M1 regulates the transcriptional network of genes essential for mitotic progression and genes encoding the SCF (Skp2-Cks1) ubiquitin ligase. Mol Cell Biol. 2005;25:10875–10894. doi: 10.1128/MCB.25.24.10875-10894.2005. [DOI] [PMC free article] [PubMed] [Google Scholar]
- 19.Knepper MA. Systems biology in physiology: the vasopressin signaling network in kidney. Am J Physiol Cell Physiol. 2012;303:C1115–C1124. doi: 10.1152/ajpcell.00270.2012. [DOI] [PMC free article] [PubMed] [Google Scholar]
- 20.Knepper MA. Systems biology of diuretic resistance. J Clin Invest. 2015;125:1793–1795. doi: 10.1172/JCI81505. [DOI] [PMC free article] [PubMed] [Google Scholar]
- 21.Lovisa S, LeBleu VS, Tampe B, et al. Epithelial-to-mesenchymal transition induces cell cycle arrest and parenchymal damage in renal fibrosis. Nat Med. 2015;21:998–1009. doi: 10.1038/nm.3902. [DOI] [PMC free article] [PubMed] [Google Scholar]
- 22.Li J, Ariunbold U, Suhaimi N, et al. Collecting duct-derived cells display mesenchymal stem cell properties and retain selective in vitro and in vivo epithelial capacity. J Am Soc Nephrol. 2015;26:81–94. doi: 10.1681/ASN.2013050517. [DOI] [PMC free article] [PubMed] [Google Scholar]
- 23.Frokiaer J, Marples D, Knepper M, Nielsen S. Bilateral ureteral obstruction downregulates expression of the vasopressin sensitive aquaporin-2 water channel in rat kidney. American Journal of Physiology. 1996;270:F657–F668. doi: 10.1152/ajprenal.1996.270.4.F657. [DOI] [PubMed] [Google Scholar]
- 24.Butt MJ, Tarantal AF, Jimenez DF, Matsell DG. Collecting duct epithelial-mesenchymal transition in fetal urinary tract obstruction. Kidney Int. 2007;72:936–944. doi: 10.1038/sj.ki.5002457. [DOI] [PubMed] [Google Scholar]
- 25.Rodriguez-Boulan E, Macara IG. Organization and execution of the epithelial polarity programme. Nat Rev Mol Cell Biol. 2014;15:225–242. doi: 10.1038/nrm3775. [DOI] [PMC free article] [PubMed] [Google Scholar]
- 26.Vukicevic S, Kopp JB, Luyten FP, Sampath TK. Induction of nephrogenic mesenchyme by osteogenic protein 1 (bone morphogenetic protein 7) Proc Natl Acad Sci U S A. 1996;93:9021–9026. doi: 10.1073/pnas.93.17.9021. [DOI] [PMC free article] [PubMed] [Google Scholar]
- 27.Chen CR, Kang Y, Siegel PM, Massague J. E2F4/5 and p107 as Smad cofactors linking the TGFbeta receptor to c-myc repression. Cell. 2002;110:19–32. doi: 10.1016/s0092-8674(02)00801-2. [DOI] [PubMed] [Google Scholar]
- 28.Burg MB, Ferraris JD, Dmitrieva NI. Cellular response to hyperosmotic stresses. Physiol Rev. 2007;87:1441–1474. doi: 10.1152/physrev.00056.2006. [DOI] [PubMed] [Google Scholar]
- 29.Nicco C, Wittner M, DiStefano A, Jounier S, Bankir L, Bouby N. Chronic exposure to vasopressin upregulates ENaC and sodium transport in the rat renal collecting duct and lung. Hypertension. 2001;38:1143–1149. doi: 10.1161/hy1001.092641. [DOI] [PubMed] [Google Scholar]
- 30.Khositseth S, Pisitkun T, Slentz DH, et al. Quantitative protein and mRNA profiling shows selective post-transcriptional control of protein expression by vasopressin in kidney cells. Mol Cell Proteomics. 2011;10:M110. doi: 10.1074/mcp.M110.004036. [DOI] [PMC free article] [PubMed] [Google Scholar]
- 31.Hoorn EJ, Hoffert JD, Knepper MA. Combined proteomics and pathways analysis of collecting duct reveals a protein regulatory network activated in vasopressin escape. J Am Soc Nephrol. 2005;16:2852–2863. doi: 10.1681/ASN.2005030322. [DOI] [PMC free article] [PubMed] [Google Scholar]
- 32.Wright PA, Burg MB, Knepper MA. Microdissection of kidney tubule segments. In: Fleischer S, editor. Methods in Enzymology. San Diego: Academic Press; 1990. pp. 191–231. 191. [DOI] [PubMed] [Google Scholar]
- 33.Dobin A, Davis CA, Schlesinger F, et al. STAR: ultrafast universal RNA-seq aligner. Bioinformatics. 2013;29:15–21. doi: 10.1093/bioinformatics/bts635. [DOI] [PMC free article] [PubMed] [Google Scholar]
- 34.Risso D, Ngai J, Speed TP, Dudoit S. Normalization of RNA-seq data using factor analysis of control genes or samples. Nat Biotechnol. 2014;32:896–902. doi: 10.1038/nbt.2931. [DOI] [PMC free article] [PubMed] [Google Scholar]
- 35.Love MI, Huber W, Anders S. Moderated estimation of fold change and dispersion for RNA-seq data with DESeq2. Genome Biol. 2014;15:550. doi: 10.1186/s13059-014-0550-8. [DOI] [PMC free article] [PubMed] [Google Scholar]
- 36.Livak KJ, Schmittgen TD. Analysis of relative gene expression data using real-time quantitative PCR and the 2(-Delta Delta C(T)) Method. Methods. 2001;25:402–408. doi: 10.1006/meth.2001.1262. [DOI] [PubMed] [Google Scholar]
- 37.Huang DW, Sherman BT, Lempicki RA. Systematic and integrative analysis of large gene lists using DAVID bioinformatics resources. Nat Protoc. 2009;4:44–57. doi: 10.1038/nprot.2008.211. [DOI] [PubMed] [Google Scholar]
- 38.Purkerson JM, Heintz EV, Nakamori A, Schwartz GJ. Insights into acidosis-induced regulation of SLC26A4 (pendrin) and SLC4A9 (AE4) transporters using three-dimensional morphometric analysis of beta-intercalated cells. Am J Physiol Renal Physiol. 2014;307:F601–F611. doi: 10.1152/ajprenal.00404.2013. [DOI] [PMC free article] [PubMed] [Google Scholar]
- 39.Na KY, Kim GH, Joo KW, et al. Chronic furosemide or hydrochlorothiazide administration increases H+-ATPase B1 subunit abundance in rat kidney. Am J Physiol Renal Physiol. 2007;292:F1701–F1709. doi: 10.1152/ajprenal.00270.2006. [DOI] [PubMed] [Google Scholar]
- 40.Fenton RA, Chou CL, Ageloff S, Brandt W, Stokes JB, Knepper MA. Increased collecting duct urea transporter expression in Dahl salt-sensitive rats. Am J Physiol Renal Physiol. 2003;285:F143–F151. doi: 10.1152/ajprenal.00073.2003. [DOI] [PubMed] [Google Scholar]
- 41.Hoffert JD, Fenton RA, Moeller HB, et al. Vasopressin-stimulated increase in phosphorylation at ser-269 potentiates plasma membrane retention of aquaporin-2. J Biol Chem. 2008;283:24617–24627. doi: 10.1074/jbc.M803074200. [DOI] [PMC free article] [PubMed] [Google Scholar]
- 42.Barile M, Pisitkun T, Yu MJ, et al. Large Scale Protein Identification in Intracellular Aquaporin-2 Vesicles from Renal Inner Medullary Collecting Duct. Mol Cell Proteomics. 2005;4:1095–1106. doi: 10.1074/mcp.M500049-MCP200. [DOI] [PMC free article] [PubMed] [Google Scholar]
- 43.Ecelbarger CA, Terris J, Frindt G, et al. Aquaporin-3 water channel localization and regulation in rat kidney. American Journal of Physiology: Renal Physiology. 1995;269:F663–F672. doi: 10.1152/ajprenal.1995.269.5.F663. [DOI] [PubMed] [Google Scholar]
- 44.Kortenoeven ML, Li Y, Shaw S, et al. Amiloride blocks lithium entry through the sodium channel thereby attenuating the resultant nephrogenic diabetes insipidus. Kidney Int. 2009;76:44–53. doi: 10.1038/ki.2009.91. [DOI] [PubMed] [Google Scholar]
Associated Data
This section collects any data citations, data availability statements, or supplementary materials included in this article.


