Abstract
Tumor progression is often influenced by infiltration of myeloid cells; depending on the M1- or M2-like activation status, these cells may have either inhibitory or promoting effects on tumor growth. We investigated the properties of tumor-associated myeloid cells in a previously established homotransplantable amelanotic melanoma (RMM tumor line) in F344 rats. RMM tumor nodules were allowed to reach the sizes of 0.5, 1, 2 and 3 cm, respectively. Immunohistochemistry and flow cytometry was performed for macrophage markers CD68 and CD163, and for the antigen-presenting cell marker, MHC class II. Although no significant change was observed in the number of CD68+ and CD163+ macrophages during RMM progression, the number of MHC class II+ antigen-presenting cells was reduced in 3 cm nodules. Real-time RT-PCR of laser microdissection samples obtained from RMM regions rich in MHC class II+ cells demonstrated high expressions of M1-like factors: IFN-γ, GM-CSF and IL-12a. Furthermore, fluorescence-activated cell sorting, followed by real-time RT-PCR for CD11b+ MHC class II+ (myeloid antigen-presenting cells), CD11b+ CD163+ (M2 type myeloid cells), CD11b+ CD80+ (M1 type myeloid cells) and CD11b+ CD11c+ (dendritic cells) cells was performed. Based on the levels of inflammation- and tumor progression-related factors, MHC class II+ antigen-presenting cells showed polarization towards M1, while CD163+ macrophages, towards M2. CD80+ and CD11c+ myeloid cells did not show clear functional polarization. Our results provide novel information on tumor-associated myeloid cells in amelanotic melanoma, and may become useful in further research on melanoma immunity.
Electronic supplementary material
The online version of this article (doi:10.1007/s12307-017-0193-x) contains supplementary material, which is available to authorized users.
Keywords: Amelanotic melanoma, Tumor-associated myeloid cell, Macrophage, Antigen-presenting cell, Cytokine
Introduction
During tumor progression, components of the innate immune system, such as myeloid cells, infiltrate tumor tissues and exert a variety of functions with impacts on tumor growth [1, 2]. Myeloid cells infiltrating the tumor tissue are comprised of tumor-associated macrophages (TAMs), dendritic cells, myeloid-derived suppressive cells (MDSCs) and tumor-associated neutrophils [2]. TAMs are the most abundant infiltrating myeloid cells in tumors and their roles in neoplastic progression are controversial [3]. The reason lays in the fact that macrophages can be found in between two stages of polarization: classically activated (M1) and alternatively activated (M2) macrophages. M1 macrophages are activated by IFN-γ, and secrete high levels of proinflammatory cytokines, such as IL-1, IL-6, IL-12 and TNF-α. M1 macrophages are known to present anti-tumor properties, through amplification of the immune responses [4]. M2 macrophages, on the other side, express high levels of IL-10, IL-4, TGF-β and IL-13, and are implicated in tissue repair and tumor promotion [5, 6]. Macrophages are not the only type of cells that can be polarized [7]; other myeloid cells, such as MDSCs [8, 9] and neutrophils [10] may be similarly activated towards M1- or M2-like directions.
The MHC class II molecules play pivotal roles in induction of anti-tumor immunity, through activation of T cells [11]. Among tumor-associated myeloid cells, MHC class II molecules are usually expressed by M1 macrophages [4] and dendritic cells [12]. Recently, MHC class II molecules have been shown to be present on some M2 macrophage subsets, as well [13].
In human melanomas, TAMs are polarized towards the M2 type and they promote tumor progression by inducing Treg-mediated immune suppression and stimulation of neoangiogenesis [14]. MHC class II represents an important target in melanoma immunotherapy; enhancement of the MHC class II antigen presentation pathway is one of the goals in developing effective anti-melanoma vaccines [11]. Some human melanomas present an aberrant expression of MHC class II on neoplastic cells, phenomenon which may improve responses to immunotherapy [15]. Therefore, understanding the particularities of MHC class II expression in relation to inflammation and tumor progression may provide important information for developing new therapeutic strategies against melanomas.
Previously, we established a homotransplantable amelanotic melanoma tumor line (RMM) in F344 rats [16]. RMM was the first homotransplantable melanoma derived from a spontaneous tumor in rats. During the last decade, remarkable progress has been made in understanding cancer mechanisms and therapeutics using rat models [17, 18]. Moreover, examining similarities between rats and mice, and between rats, mice and humans, will provide enriched information and lead to a better approach rather than studies conducted on a single species.
The aim of the current study is to investigate the properties of tumor-associated myeloid cells in amelanotic melanoma in F344 rats, by using the RMM tumor line, with special emphasis on TAMs and MHC class II expressing cells during tumor progression. We believe our study would provide useful information for additional comparative research on melanomas.
Materials and Methods
The Homotransplantable Tumor Line RMM
A homotransplantable tumor line (RMM) derived from a malignant amelanotic melanoma in an aged F344 rat, was previously established and characterized [16]. Briefly, a primary amelanotic melanoma developed spontaneously in the pinna of an aged male albino F344 rat. Subsequently, a tissue fragment of 2 mm from the original tumor was transplanted into the scapular region of syngeneic male F344 rats, through a trocar. Serial transplantations were made until the 28th generation, as described previously.
Experimental Animals
Sixteen 6-week-old male F344 rats were obtained from Charles River Japan (Hino, Shiga, Japan). They were housed in an animal room, maintained at 22 ± 3 °C with a 12 h light-dark cycle. The animals were fed with a standard diet (DC-8; CLEA, Tokyo, Japan) and provided with tap water ad libitum. After one week of acclimatization, RMM tumor tissue fragments at transplant generation 10 were cut into 2 mm pieces and aseptically transplanted into male F344 rats, as previously described [16]. Tumor diameter was measured with calipers 2 times per week. RMM nodules were allowed to reach the sizes of 0.5, 1, 2 and 3 cm, respectively. Tumor volume was determined with the formula: tumor volume [mm3] = length[mm] × (width[mm])2 × 0.5 [19]. Four rats were euthanized under deep isoflurane anesthesia at each tumor size point. Experimental procedures were in agreement with our institutional guidelines on animal care and use, and were conducted in accordance with basic policies for the conduct of animal experimentation.
Histopathology and Immunohistochemistry
RMM tumor tissues and liver and spleen tissues from RMM tumor-bearing rats and non-transplanted age matched controls, were fixed in 10% neutral buffered formalin (NBF), and in periodate-lysine-paraformaldehyde (PLP) solution processed by PLP-AMeX (acetone, methylbenzoate, xylene) method [20]. RMM tissues were also embedded immediately in TissuMount® (Chiba Medical Co, Saitama, Japan) and stored at −80 °C until use. NBF-fixed tissues were embedded in paraffin, sectioned at 3–5 μm in thickness and stained with hematoxylin and eosin (HE) for histopathological examination. PLP-fixed, dewaxed sections were stained with antibodies against CD68 (clone ED1; 1:500; AbD Serotec, Oxford, UK), CD163 (clone ED2; 1:300; AbD Serotec), MHC class II (clone OX-6; 1:500; AbD Serotec). After dewaxing, sections were pretreated with proteinase K (100 μg/ml proteinase K in Tris buffer, pH 7.5) for 15 min. Thereafter, the sections were treated with 5% skimmed milk in phosphate buffered saline (PBS) for 30 min, and incubated with each primary antibody for 1 h at room temperature, followed by a 1 h incubation with horseradish peroxidase-conjugated secondary antibody (Histofine Simple Stain MAX PO, Nichirei, Tokyo, Japan). All sections were incubated with 3% H2O2 in PBS for 15 min to quench the endogenous peroxidase. Positive reactions were detected with 3,3′-diaminobenzidine (DAB Substrate Kit, Nichirei). Sections were counterstained lightly with hematoxylin.
Double Immunofluorescence Staining
Fresh frozen tissue sections (10 μm in thickness) from RMM nodules of 0.5, 1, 2 and 3 cm in diameter were used. Double immunofluorescence was carried out using: MHC class II in combination with CD68, CD163 or CD11b (clone OX-42; AbD Serotec); and CD68 in combination with CD163. After fixation in cold acetone:methanol (1:1) for 10 min at 4 °C, the sections were incubated with 10% normal goat serum for 30 min. Tissue sections reacted with the primary antibody overnight at 4 °C. After rinsing with PBS, the sections were incubated for 45 min with the secondary antibody goat anti-mouse IgG-conjugated with Alexa 488 or Alexa 568 (Invitrogen, Carlsbad, CA, USA). The sections were then incubated with the primary antibody, labeled with fluorescent dye: Alexa 488 labeled MHC class II (AbD Serotec) for MHC class II/CD68, MHC class II/CD163, MHC class II/CD11b; and Alexa 488 labeled CD68 (AbD Serotec) for CD163/CD68. The sections were visualized with Vectashield™ mounting medium containing 4′, 6-diamino-2-phenylindole (DAPI) (Vector Laboratories Inc. Burlingame, CA, USA) for nuclear staining, and analyzed by a virtual slide scanner (VS-120, Olympus, Tokyo, Japan).
Laser Microdissection (LMD) Analysis
Fresh frozen sections from RMM nodules of 0.5 cm and 3 cm in diameter were fixed with a mixture of acetone:methanol (1:1) for 3 min at 4 °C, and briefly rinsed in diethylpyrocarbonate-treated PBS. Sections were immunostained with the primary antibody against MHC class II labeled Alexa 488, for 5 min at room temperature. Tumor regions rich in MHC class II+ cells (MHC II-HIGH) and poor in MHC class II+ cells (MHC II-LOW) were separately collected by a LMD-7000 device (Leica Microsystems, Germany) into QIAzol lysis reagent (Qiagen, Hilden, Germany) and stored at −80 °C.
Fluorescence-Activated Cell Sorting (FACS)
The RMM tumor tissues were cut by scissors and digested by 0.1% collagenase type IV (Worthington Biochemical Corporation, Lakewood, USA) in PBS. The cell suspension was transferred into a new tube by filtering through a 100 μm cell strainer, and centrifuged at 1500 rpm, 4 °C, for 1 min. The pellets were resuspended in PBS containing 2% fetal bovine serum (FBS) (GE healthcare, Little Chalfont, UK), followed by a new centrifugation at 1500 rpm, 4 °C, for 5 min. The supernatant was removed, and the red blood cells in the sample were lysed by BD Pharm Lyse™ lysing buffer (BD Bioscience, New Jersey, USA), for 5 min at room temperature. Samples were centrifuged at 1500 rpm, 4 °C for 5 min, and the supernatant was removed. The pellets were resuspended in 2% FBS in PBS. The suspension was filtered through a Falcon® 40 μm cell strainer (Corning Life sciences, NY, USA). Cell concentration was adjusted to 2 × 10⁷ cells/ml, by PBS containing 2% FBS.
Flow cytometrical analyses in RMM tumors of 0.5, 1, 2 and 3 cm, respectively, were performed for cells stained with antibodies against MHC class II (for antigen-presenting cells) (conjugated Alexa 488; 1:200, AbD Serotec), in combination with CD68 (for pan-macrophages) (conjugated RPE, 1:200, AbD Serotec) and CD163 (for M2- macrophages) (conjugated RPE, 1:200, AbD Serotec), at 4 °C for 30 min.
Cell sorting was done for RMM tumors of 3 cm in diameter; antibodies against CD11b (for myeloid cells) (conjugated RPE; 1:100, AbD Serotec) in combinations with MHC class II (conjugated Alexa 488; 1:100, AbD Serotec), CD163 (conjugated Alexa 488, 1:100, AbD Serotec), CD80 (conjugated Alexa 488, 1:100, AbD Serotec) or CD11c (conjugated FITC, 1:100, Bio Rad, Tokyo, Japan) were used.
Flow cytometry and cell sorting were performed with S3™ Cell Sorter (Bio Rad). CD11b+ MHC class II+ (antigen-presenting myeloid cells), CD11b+ CD163+ (M2 type myeloid cells), CD11b+ CD80+ (M1 type myeloid cells) and CD11b+ CD11c+ (dendritic cells) were sorted into Dulbecco’s Modified Eagles’s Medium (DMEM; Thermo Fisher Scientific, Waltham, MA, USA) containing 1% FBS. After sorting, the cell suspension was centrifuged at 3000 rpm, 7 min, at room temperature, and the supernatant was discarded. The pellets were lysed in QIAzol lysis reagent and stored at −80 °C.
Adoptive Transfer of Myeloid Cell Subsets
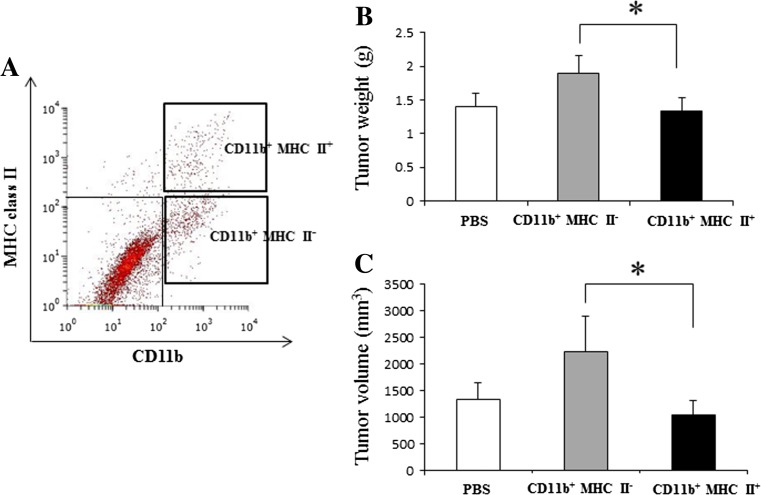
For the adoptive transfers, 106 of CD11b+ MHC class II+ and CD11b+ MHC class II− sorted cells, respectively, derived from RMM tumors of 2 cm in diameter (n = 4), were injected into growing RMM tumors of 0.5 cm in diameter (n = 3 for each group). PBS was used as control. Tumors were allowed to grow 7 days after adoptive transfer; thereafter, tumor nodules were collected and further analyses were performed.
Real-Time Reverse Transcriptase Polymerase Chain Reaction (RT-PCR)
Total RNA from samples obtained after laser microdissection and cell sorting, was isolated by RNeasy Mini Kit (Qiagen, Tokyo, Japan) according to manufacturer’s instructions. 300 ng of RNA was reverse transcribed to cDNA with the SuperScript®VILO™ (Life Technologies, CA, USA). Real-time RT-PCR was performed using TaqMan gene expression assays (Life Technologies) or SYBR® Green Real-time PCR Master Mix (Toyobo Co. Ltd., Osaka, Japan), in a PikoReal Real-time PCR System (Thermo Scientific). The probe sets used are listed in Table 1 and the oligonucleotide sequences are listed in Table 2. The mRNA expression was normalized against expression of 18 s rRNA mRNA as the internal control. The data were analyzed using the comparative Ct method (ΔΔCt method).
Table 1.
Probes used in the real-time RT-PCR
| Symbol | Name | Assay ID |
|---|---|---|
| RT1-Ba | RT1 class II, locus Ba | Rn01428452_m1 |
| IFN-γ | Interferon gamma | Rn00594078_m1 |
| M-CSF | Colony stimulating factor-1 | Rn00572010_m1 |
| GM-CSF | Colony stimulating factor-2 | Rn01456850_m1 |
| TNF-α | Tumor necrosis factor-alpha | Rn01525859_g1 |
| TGF-β1 | Transforming growth factor-beta 1 | Rn00572010_m1 |
| Il-1β | Interleukin 1 beta | Rn00580432_m1 |
| IL-6 | Interleukin-6 | Rn01410330_m1 |
| IL-10 | Interleukin-10 | Rn00563409_m1 |
| IL-12a | Interleukin-12a | Rn00584538_m1 |
| CCL2 | Chemokine (C-C motif) ligand 2 | Rn00580555_m1 |
| CCL5 | Chemokine (C-C motif) ligand 5 | Rn00579590_m1 |
| CXCL1 | C-X-C motif chemokine ligand 1 | Rn00578225_m1 |
| ΗΙΦ−1α | Hypoxia inducible factor-1 alpha | Rn01472831_m1 |
| VEGFa | Vascular endothelial growth factor A | Rn01511602_m1 |
| Flt-1 | FMS-related tyrosine kinase 1 | Rn01409533_m1 |
| 18 s rRNA | Eukaryotic 18S rRNA | Hs99999901_s1 |
Table 2.
Primers used in the real-time RT-PCR
| Gene name | Sequence |
|---|---|
| Galectin-3 | (forward) 5′-ATCCTGCTACTGGCCCTTT-3′ |
| (reverse) 5′-GCGATGTCGTTCCCTTTCTT-3′ | |
| MMP-2 | (forward) 5’GGGTCTATTCTGCCAGCACTTT-3′ |
| (reverse) 5’CGGGGTCCATTTTCTTCTTTACTT-3′ | |
| MMP-9 | (forward) 5’TGCCCTGGAACTCACACAAC-3′ |
| (reverse) 5’GGAAACTCACACGCCAGAAG-3’ | |
| TIMP-1 | (forward) 5’CCTCTGGCATCCTCTTGTTG-3′ |
| (reverse) 5’GGTGGTCTCGATGATTTCTGG-3’ | |
| TIMP-2 | (forward) 5’CGTTTTGCAATGCAGACGTA-3′ |
| (reverse) 5’GGCCGTGTAGATAAATTCGATG-3’ | |
| PDGFb | (forward) 5’TCTGGCCTGCAAGTGTGAG-3′ |
| (reverse) 5’CCCGAGTTTGAGGTGTCTTG-3’ | |
| 18 s rRNA | (forward) 5’-GTAACCCGTTGAACCCCATT-3′ |
| (reverse) 5′-CCATCCAATCGGTAGTAGCG-3’ |
Cell Counts and Statistics
Serial sections were used for cell counting. Cells immunopositive for MHC class II, CD68 and CD163 were counted per high power field at 40 × magnification for RMM tissues and spleen tissues, and at 20 × magnification, for liver tissues, each in 5 randomly selected areas. Data obtained were expressed as mean ± standard deviation (SD) and analysed by the Tukey’s test or Student’s t-test. A value of P < 0.05 was considered significant.
Results
Macroscopy and Histopathology
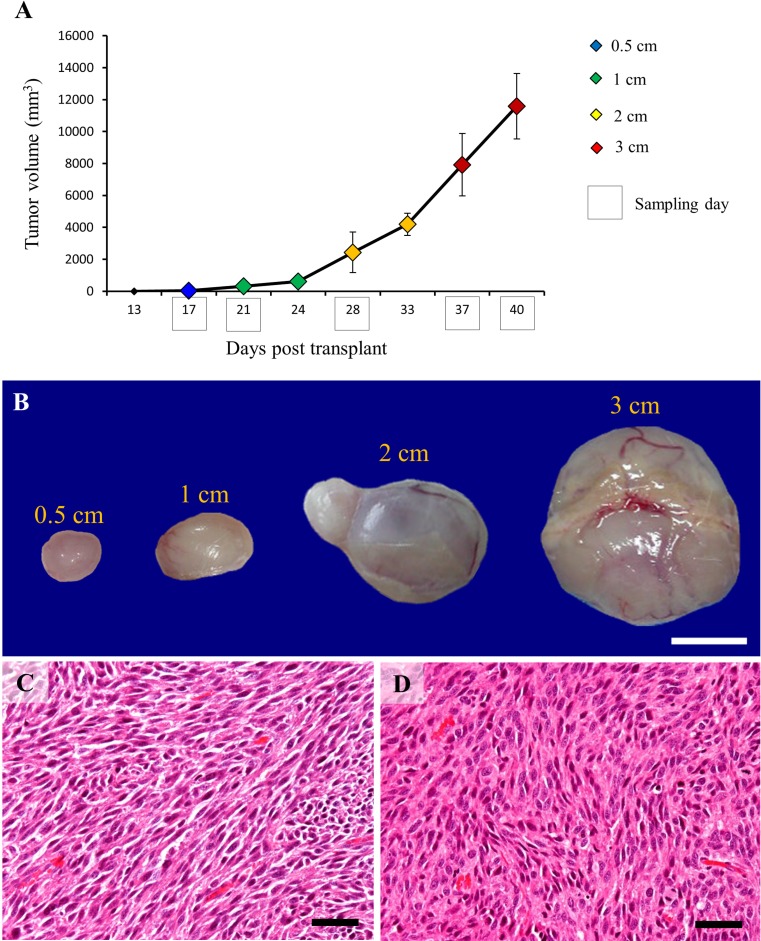
RMM transplanted tissues grew into solitary nodules measurable by callipers from day 13 after subcutaneous implantation. The size of RMM nodules, tumor volumes and sampling days are represented in Fig. 1a. Briefly, the nodules of 0.5 cm in diameter were harvested at day 17 after tumor implantation; nodules of 1 cm, at day 21; nodules of 2 cm, at day 28; and nodules of 3 cm, at days 37 and 40. Macroscopically, RMM tumor nodules were well encapsulated and ulceration was not seen. At sectioning, the tumors were gray in color, with occasional reddish areas (Fig. 1b). Histopathologically, RMM tumors consisted of spindle-shaped cells with eosinophilic cytoplasm and indistinct cell borders arranged in interlacing bundles or fascicles. No melanin pigment was observed in the cytoplasm of neoplastic cells, as the animals were albino. Cellular and nuclear atypia were prominent [16]. There was no difference in histopathology between tumor nodules of 0.5, 1, 2 and 3 cm, respectively (Fig. 1c, d).
Fig. 1.
Graphic representation of RMM tumor growth, with tumor volumes (vertical axis) and time after implantation (horizontal axis) for: 0.5 cm nodules (blue); 1 cm nodules (green); 2 cm nodules (yellow); and 3 cm nodules (red). Sample collection points are indicated by black box (a). Macroscopic image of RMM nodules (b). Histopathology of RMM tumors, 0.5 cm (c) and 3 cm (d); neoplastic cells are spindle in shape and arranged in interlacing bundles. Bars: B, 1 cm; C, D, 50 μm
Macrophages and Antigen-Presenting Cells in RMM Tissues and Liver and Spleen Tissues of RMM Tumor-Bearing Rats
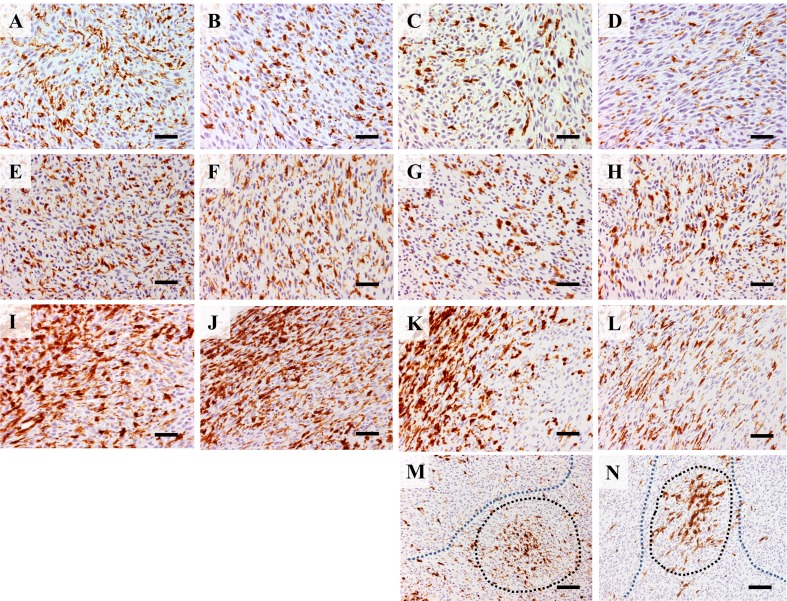
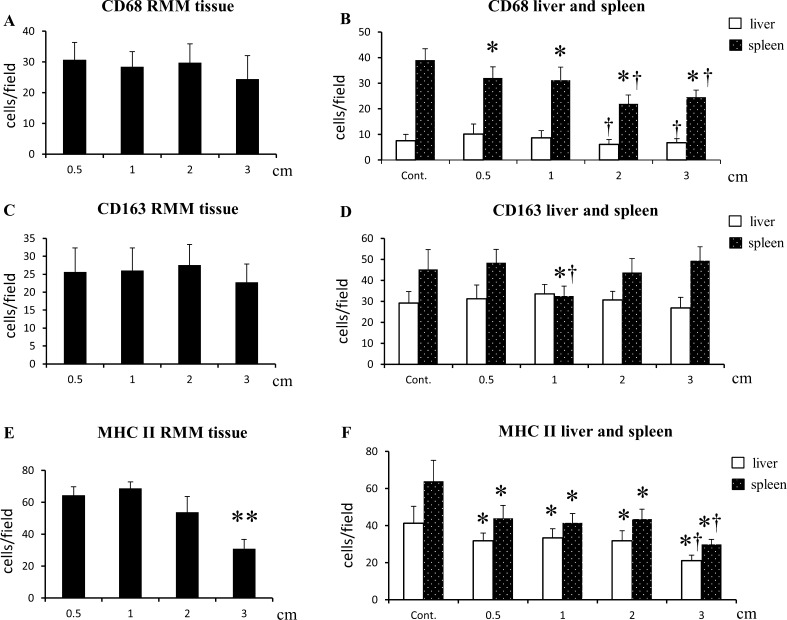
CD68 and CD163 immunopositive macrophages showed a uniform distribution through RMM tissue sections. No significant change was seen in numbers of CD68+ and CD163+ cells between RMM nodules of 0.5, 1, 2 and 3 cm in diameter (Figs. 2a-h, and 3a, c). In liver and spleen tissues, the CD68+ macrophage number decreased in RMM tumor-bearing rats, in comparison with non-transplanted rats. Moreover, the decrease was correlated with tumor growth (Fig. 3b). CD163+ macrophages in the spleen suffered only a transient decrease in 1 cm RMM tumor-bearing rats; thereafter, the number of CD163+ cells returned to control levels (Fig. 3d). MHC class II+ antigen presenting cells presented a less uniform distribution throughout RMM tissues. MHC class II+ cells were densely localized in the marginal tumor tissue (Fig. 2i-l), with a decrease in 3 cm nodules (Figs. 2l and 3c). In the more central areas of large tumors (2 and 3 cm), MHC class II+ cells were found in dense clusters (black-dotted line), alternating with regions containing a small number of positive cells (blue-dotted line) (Fig. 2m, n). In the red splenic pulp and in liver tissues of RMM tumor-bearing rats, the MHC class II+ cell number significantly decreased in comparison with controls, and the decrease was correlated with tumor growth (Fig. 3f).
Fig. 2.
Immunohistochemistry for CD68 in 0.5 cm (a), 1 cm (b), 2 cm (c) and 3 cm (d) RMM nodules; CD68+ cells have uniform distribution throughout tissues. Immunohistochemistry for CD163 in 0.5 cm (e), 1 cm (f), 2 cm (g) and 3 cm (h) shows uniform distribution of CD163+ cells throughout tissues. Immunohistochemistry for MHC class II in 0.5 cm (i), 1 cm (j), 2 cm (k) and 3 cm (l) nodules shows abundant staining in marginal tumor areas. In 2 cm (m) and 3 cm (n) nodules, clusters of MHC class II+ cells (black dotted line) or areas with few positive cells (blue dotted line) are seen in central tumor areas. Bars: A-L, 50 μm; M, N, 100 μm
Fig. 3.
The kinetics of: CD68+ cells in RMM tissues (a) and in liver and spleen red pulp of RMM tumor-bearing rats (b); CD163+ cells in RMM tissues (c) and in liver and spleen red pulp of RMM tumor-baring rats (d); MHC class II+ cells in RMM tissues (e) and in liver and spleen red pulp of RMM tumor-baring rats (f). Tukey’s test. **P < 0.001, significantly different from all groups (E); Tukey’s test, *P < 0.05, significantly different from control within group, †P < 0.05, significantly different from 0.5 cm within group (B, D, F)
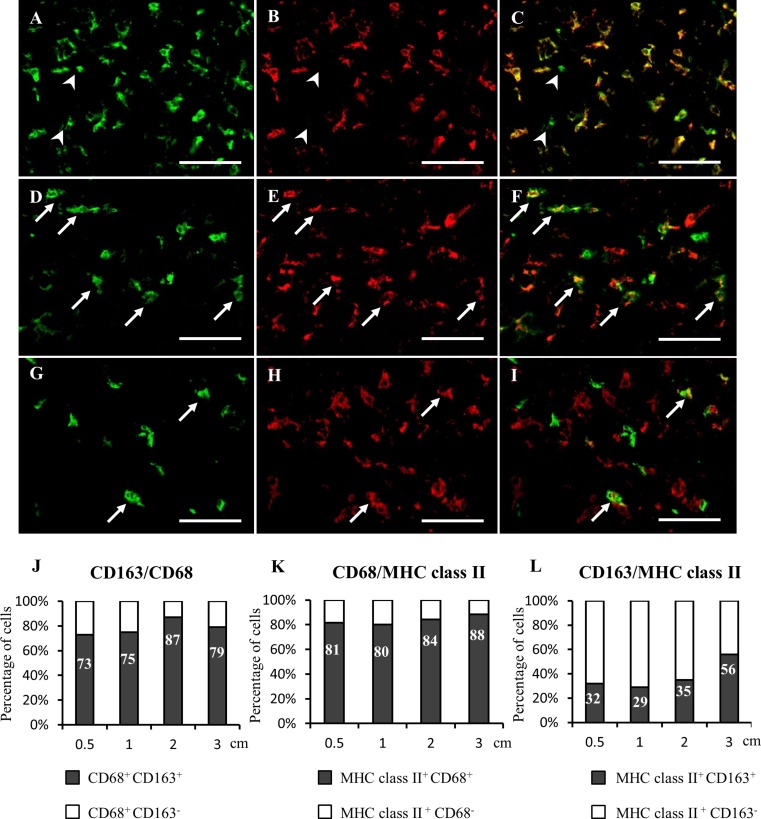
The findings of double immunofluorescence indicated that CD68+ TAMs co-expressed CD163 in proportion of 73%, 75%, 87%, 79% in 0.5, 1, 2 and 3 cm tumors, respectively. All CD163+ cells co-expressed CD68 (Fig. 4a-c, j). MHC class II+ cells showed co-localization with the pan-macrophage marker CD68 in proportion of 81%, 80%, 84%, 88%, respectively (Fig. 4d-f, k). MHC class II+ CD163+ cells were present in percentages of 32%, 29%, 35% in 0.5, 1 and 2 cm nodules, respectively. In 3 cm nodules, the percentage of MHC class II+ CD163+ cells increased to 56% (Fig. 4g-i, l).
Fig. 4.
Immunofluorescence in RMM tumors (2 cm) for CD68 (a), CD163 (b) and merged (c): all CD163+ cells co-express CD68, arrowheads indicate CD68 single-positive cells. Immunofluorescence for MHC class II (d), CD68 (e) and merged (f): many MHC class II+ cells co-express CD68 (arrows). Immunofluorescence for MHC class II (g), CD163 (h) and merged (i): a few MHC class II+ cells co-express CD163 (arrows). Percentages of double positive cells in RMM tumors of 0.5, 1, 2 and 3 cm are indicated for CD68/CD163 (j); MHC class II/CD68 (k) and MHC class II/CD163 (l) double immunolabeling. Bars, 100 μm
Flow-cytometry analyses in tumors of 0.5, 1, 2 and 3 cm, respectively, revealed similar results with those of immunohistochemistry and double immunofluorescence (Supplemental Fig. 1). The percentage of CD68+ and CD163+ cells was not significantly changed with tumor growth, while the percentage of MHC class II+ cells started to decrease in tumors of 2 cm, reaching a significant level in tumors of 3 cm. Although the total number of MHC class II+ cells decreased in 3 cm tumors, the percentage of cells double-positive for MHC class II and CD163 increased with tumor growth, similar with the results obtained in immunofluorescence analyses.
RMM Tumor Regions High in MHC Class II+ Antigen-Presenting Cells Have Enriched Expressions of M1-like Anti-Tumor Factors
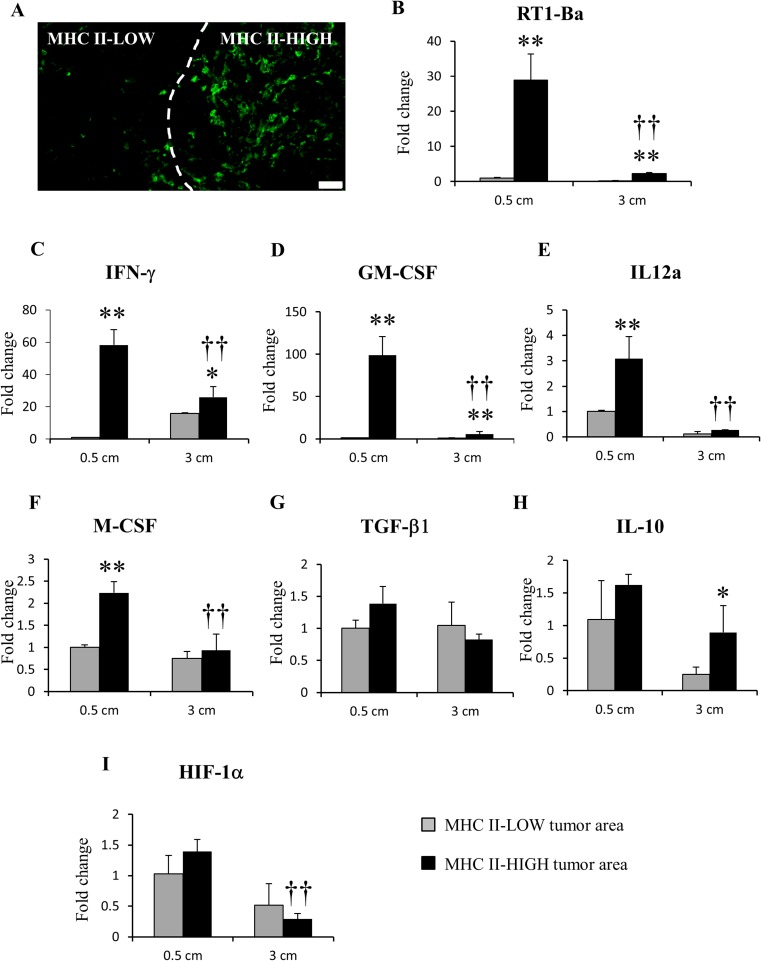
We compared the MHC II-HIGH and MHC II-LOW regions by LMD (Fig. 5a) in tumors of 0.5 cm and 3 cm in diameter, followed by real-time RT-PCR for inflammation- and tumor progression-related factors. RT1-Ba, the gene correspondent for MHC class II, was significantly up-regulated in MHC II-HIGH areas (Fig. 5b). Moreover, the expression of RT1-Ba was significantly higher in MHC II-HIGH regions of 0.5 cm tumors, in comparison with that of 3 cm tumors. mRNA levels of IFN-γ (Fig. 5c), GM-CSF (Fig. 5d) and IL-12a (Fig. 5e) for M1-related factors, were significantly up-regulated in the MHC II-HIGH areas; the mRNA values of these factors were significantly higher in 0.5 cm tumors than those in MHC II-HIGH regions of 3 cm tumors. The mRNA expression of M-CSF (Fig. 5f), an M2-related factor, was significantly higher in MHC II-HIGH regions of 0.5 cm in comparison with both MHC II-LOW 0.5 cm and MHC II-HIGH 3 cm. mRNA levels of TGF-β1 (Fig. 5g) (M2-related), remained unchanged between MHC II-HIGH and MHC II-LOW areas in both 0.5 and 3 cm tumors. IL-10, another important M2-related factor, was up-regulated only in MHC II-HIGH regions of 3 cm tumors (Fig. 5h). Levels of HIF-1α (tumor hypoxia) (Fig. 5i) were not significantly changed in both 0.5 cm and 3 cm tumors.
Fig. 5.
Laser microdissection (LMD) and real-time RT-PCR for MHC II-HIGH and MHC II-LOW regions in RMM nodules (0.5 cm and 3 cm). (a) example of MHC II-HIGH and MHC-LOW areas detected by immunofluorescence staining with Alexa 488-conjugated anti-MHC class II, before microdissection. Real-time RT-PCR for RT1-Ba (b), IFN-γ (c), GM-CSF (d), IL-12a (e), M-CSF (f), TGF-β1 (g), IL-10 (h) and HIF-1α (i). Tukey’s test *P < 0.05, **P < 0.001, significantly different from MHC II-LOW within each size point; †P < 0.05, ††P < 0.001, significantly different from MHC II-HIGH in 0.5 cm tumors. Bar, 50 μm
MHC Class II+ Antigen-Presenting Cells Have a Distinctive Expression of Cytokines, Chemokines and Tumor Progression-Related Factors
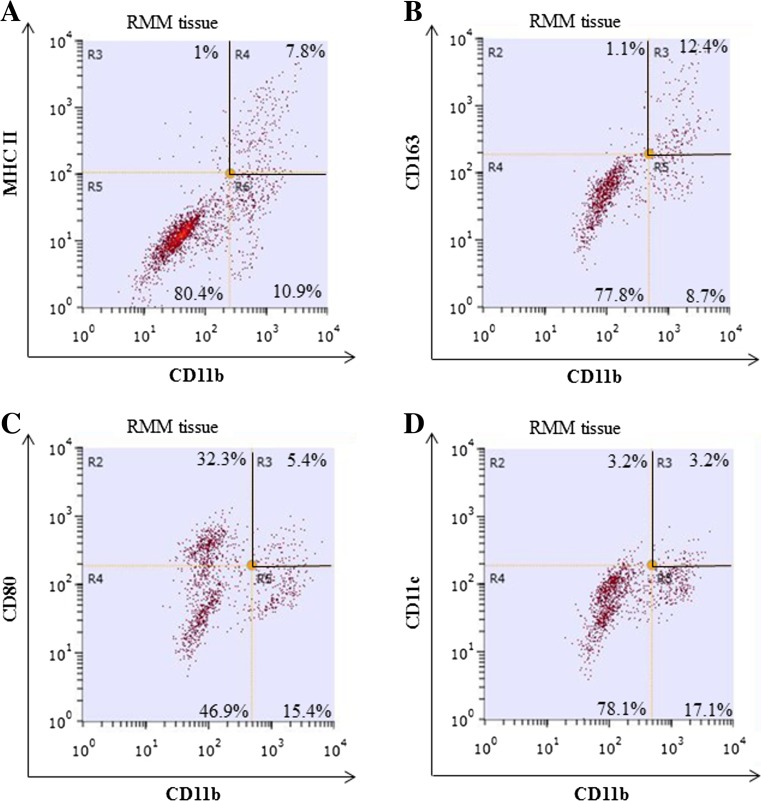
For a better analysis of MHC class II+ cells in RMM tumors, we performed fluorescence-activated cell sorting (FACS). Because not all MHC class II+ cells co-expressed the pan-macrophage marker CD68, demonstrated by double immunofluorescence and flow cytometry (Fig. 5 and Supplemental Fig. 1), we selected CD11b as a marker with broader specificity for tumor-associated myeloid cells [21]. Double immunofluorescence for MHC class II and CD11b in RMM tumors showed that almost all (95%) of MHC class II+ cells co-expressed CD11b in RMM tumors (Supplemental Fig. 2), suggesting that CD11b is a suitable candidate for myeloid cell sorting in RMM tumors. We performed cell sorting for CD11b+ MHC class II+ cells (antigen-presenting myeloid cells) (Fig. 6a) and CD11b+ CD163+ cells (M2 type myeloid cells) (Fig. 6B). Additionally, based on the previous literature on myeloid cell polarization, we performed cell sorting for CD11b+ CD80+ M1 type myeloid cells [22] (Fig. 6c); and CD11b+ CD11c+ dendritic cells [23] (Fig. 6d), in order to assess the participation of these cell subsets, as well, in the polarization of myeloid cells in the RMM rat melanoma model.
Fig. 6.
Flow cytometry for tumor-associated myeloid cells in RMM nodules (3 cm). Cells were stained with PE-conjugated-anti-CD11b in combinations with: Alexa 488-conjugated anti-MHC class II (a), Alexa 488-conjugated anti-CD163 (b), Alexa 488-conjugated anti-CD80 (c) or FITC-conjugated anti CD11c (d). Quadrants delimited by black lines represent the double-positive cells
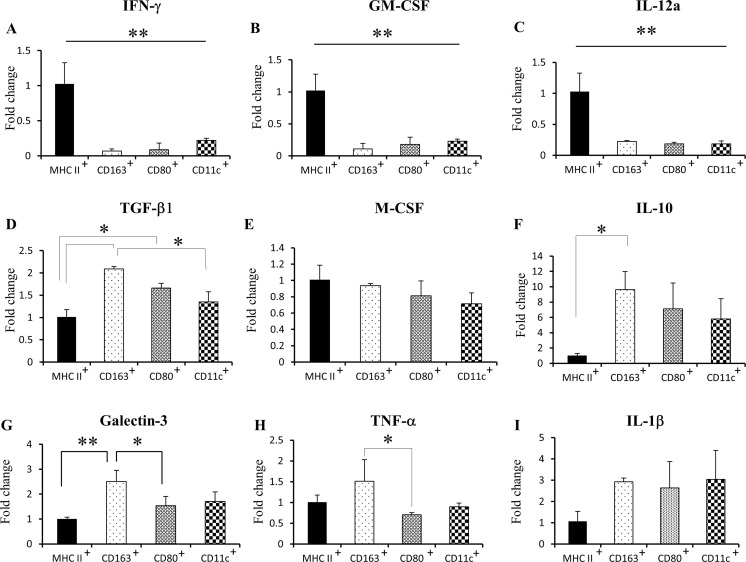
Real-time RT-PCR analyses sowed that mRNA levels of M1-related factors, such as IFN-γ (Fig. 7a), GM-CSF (Fig. 7b) and IL-12a (Fig. 7c) were increased in MHC class II+ cells, in comparison with other myeloid cell subsets. TGF-β1 mRNA (M2-related) was upregulated in CD163+ and CD80+ cells, in comparison to MHC class II+ and CD11c+ cells (Fig. 7d). There was no difference in M-CSF mRNA (M2) between sorted myeloid subpopulations (Fig. 7e). IL-10 mRNA (M2) was increased in CD163+ cells, in comparison with MHC class II+ cells (Fig. 7f). Also, CD163+ cells presented high levels of galectin-3 (M2) and TNF-α (Μ1 and M2) mRNA (Fig. 7g, h). IL-1β mRNA (Μ1) was not different between all cell subsets (Fig. 7i).
Fig. 7.
Real-time RT-PCR for tumor-associated myeloid cells in RMM nodules (3 cm) for IFN-γ (a), GM-CSF (b), IL-12a (c), TGF-β1 (d), M-CSF (e), IL-10 (f), Gal-3 (g) TNF-α (h) and IL-1β (i). MHC II+, CD11b+ MHC class II+ cells; CD163+, CD11b+ CD163+ cells; CD80+, CD11b+ CD80+ cells; CD11c+, CD11b+ CD11c+ cells. Tukey’s test. *P < 0.05, **P < 0.001, significantly different between groups indicated by bars
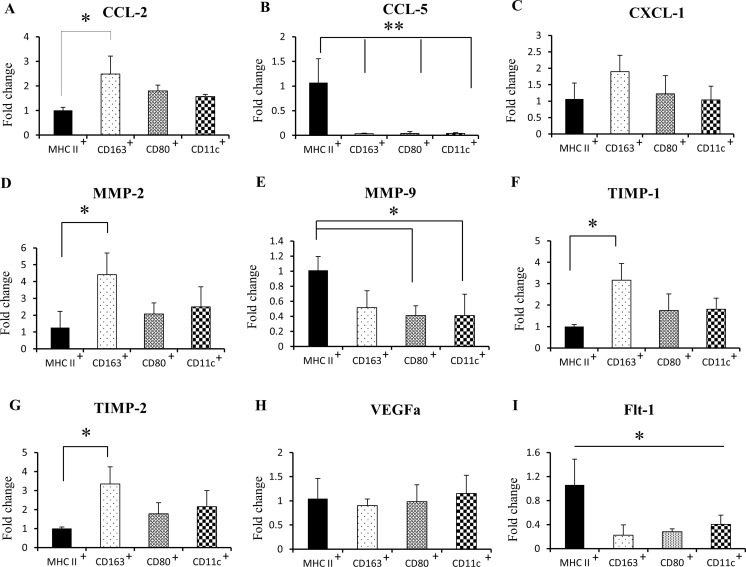
We investigated the mRNA levels of chemokines in RMM infiltrating myeloid cells: CCL-2 mRNA was upregulated in CD163+ cells (Fig. 8a), while CCL-5 mRNA was significantly increased in MHC class II+ cells (Fig. 8b). No difference was seen in CXCL1 mRNA between all cell subpopulations (Fig. 8c). CD163+ cells showed the highest mRNA levels of MMP-2, TIMP-1 and TIMP-2 (Fig. 8d, e, f). However, MMP-9 mRNA was significantly upregulated in MHC class II+ cells in comparison with other myeloid cell subpopulations (Fig. 8g). Although there was no significant difference in VEGFa levels (Fig. 8h), the VEGF receptor, Flt-1, was significantly up-regulated in MHC class II+ cells (Fig. 8i).
Fig. 8.
Real-time RT-PCR for tumor-associated myeloid cells in RMM nodules (3 cm) for CCL-2 (a), CCL-5 (b), CXCL-1 (c), MMP-2 (d), MMP-9 (e), TIMP-1 (f), TIMP-2 (g), VEGFa (h) and Flt-1 (i). MHC II+, CD11b+ MHC class II+ cells; CD163+, CD11b+ CD163+ cells; CD80+, CD11b+ CD80+ cells; CD11c+, CD11b+ CD11c+ cells
MHC Class II− Myeloid Cells Have Tumor-Promoting Roles in Comparison with MHC Class II+ Myeloid Cells
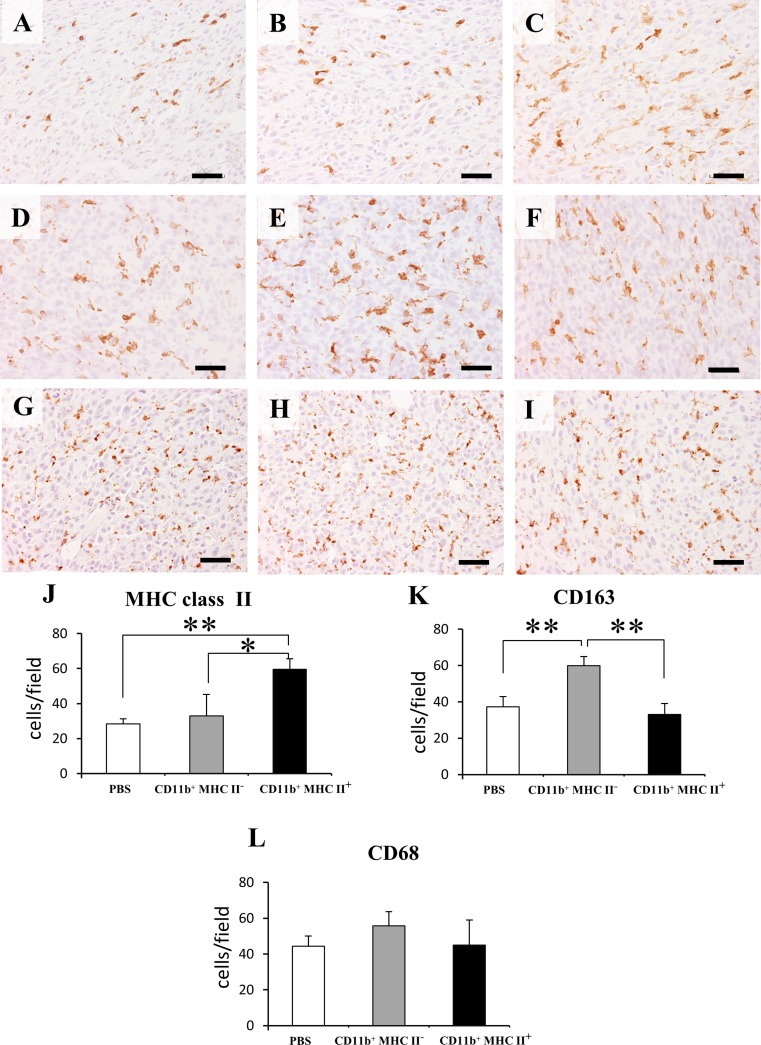
In order to assess the effects of two heterogeneous myeloid cell subsets on RMM tumor progression, CD11b+ MHC class II+ and CD11b+ MHC class II− cells were adoptively transferred to 0.5 cm RMM tumor-bearing rats (Fig. 9a). Prior to the adoptive transfer, we checked the mRNA levels of tumor progression-related factors in the two cell subsets. As expected, CD11b+ MHC class II+ cells had significantly higher levels of mRNA of M1-related factors, in comparison to CD11b+ MHC class II− cells (Supplemental Fig. 3). Interestingly, CD11b+ MHC class II− cells had higher mRNA expressions of TAM-specific molecules, CD68 and CD163. Treatment with CD11b+ MHC class II− significantly induced tumor growth, compared with the CD11b+ MHC class II+-treated group (Fig. 9b). However, no significant difference in tumor growth was seen between CD11b+ MHC class II+- treated group and PBS group (Fig. 9c). As shown in Fig.10a-c and Fig.10j, the number of MHC class II+ cells was significantly lower in the CD11b+ MHC class II− group. On the contrary, the number of CD163+ cells was significantly higher in CD11b+ MHC class II− -treated tumors (Fig.10d-f, k). No significant difference was seen in the number of CD68+ cells between all groups (Fig.10g-i, l).
Fig. 9.
Adoptive transfer of myeloid cell subsets into RMM tumor-bearing rats (0.5 cm tumors). (a) Cell sorting from RMM tumors of 2 cm (n = 4); bold quadrants represent the CD11b+ MHC class II+ and CD11b+ MHC class II− cell populations selected for adoptive transfer. 104 cells from each subpopulation were injected into F344 rats (n = 3 for each group), and PBS was used as control. (b) Graphic representation of tumor weight at day 7 post-adoptive transfer. (c) Graphic representation of tumor volume at day 7 post-adoptive transfer. Tukey’s test, *P < 0.05, significantly different between groups indicated by bars
Fig. 10.
Immunohistochemistry for MHC class II in: control RMM tumors (a), RMM tumors treated with CD11b+ MHC class II− cells (b) and RMM tumors treated with CD11b+ MHC class II+ cells (c). Immunohistochemistry for CD163 in. control RMM tumors (d), RMM tumors treated with CD11b+ MHC class II− cells (e) and RMM tumors treated with CD11b+ MHC class II+ cells (f). Immunohistochemistry for CD68 in. control RMM tumors (g), RMM tumors treated with CD11b+ MHC class II− cells (h) and RMM tumors treated with CD11b+ MHC class II+ cells (i). Graphic representation of cell counts for MHC class II+ cells (j), CD163+ cells (k) and CD68+ cells (l). Tukey’s test, *P < 0.05, **P < 0.001, significantly different between groups indicated by bars
Discussion
CD68+ and CD163+ TAMs are Not Affected by Tumor Growth, but MHC Class II+ Cells Have Different Kinetics in Growing RMM Tumors
TAM infiltration is often positively correlated with tumor progression in various human cancers, such as breast, endometrial and renal cell cancers [4]. In some murine tumor models, as well (e.g. lung adenocarcinoma, glioma), the number of tumor macrophages increases with tumor growth [24, 25], suggesting their direct implication in tumor progression. In human melanomas, the macrophage content in primary tumors varies from 0 to 30%, and the TAM density increases with tumor stage [26, 27]. In human melanoma metastatic lesions, macrophages comprise less than 10% of total cells; also, in metastases induced by B16 melanoma cell line in mice, the relative macrophage number decreases with the size of metastatic nodules, indicating that very aggressive tumor cells eventually overgrow the infiltrating macrophages [27]. In our rat model of amelanotic melanoma, the number of TAMs appeared to be unaffected by tumor growth. From early (tumor diameter of 0.5 cm) to advanced stage (tumor diameter of 3 cm), TAM density remained unchanged. One possible explanation for our findings could be that RMM tumors are rapidly growing and TAMs are having a hard time in keeping pace with tumor progression [28]. It is also worth considering the hypothesis that RMM tumor cells are malignant and aggressive enough not to require extensive macrophage participation in tumor progression.
However, the kinetics of MHC class II+ antigen-presenting cells in growing RMM tumors was different. In our study, the number of MHC class II+ cells was decreased in 3 cm tumors, demonstrated by both immunohistochemistry and flow cytometry analyses. Beside the decrease of MHC class II+ cells in 3 cm tumors, the breakdown of these cells was changed as well. Double immunofluorescence and flow cytometry demonstrated that a high percentage (approx. 80% in immunofluorescence analyses, and approx. 60% in flow cytometry analyses) of MHC class II+ cells were comprised of CD68+ macrophages; CD68 is regarded as a pan-macrophage marker [29]. However, in 0.5 and 1 cm tumors, only 25% -35% of the MHC class II+ cell population co-expressed the M2-related molecule CD163, whereas in 2 and 3 cm tumors, the double-positive cells increased to approximately 50% of the total MHC class II+ population. These results indicate a possible switch towards M2 of MHC class II+ cells with RMM tumor progression [30].
CD68+ and MHC Class II+ Cell Numbers are Reduced in Liver and Spleen of RMM Tumor-Bearing Rats
We investigated the CD68, CD163 and MHC class II expression in liver and red pulp of spleens from RMM tumor-bearing rats, due to the important implications of these organs in immune functions [31]. The red pulp of spleen comprises an extensive network of venous sinuses and antigen-presenting cells, such as red pulp macrophages and dendritic cells with roles in immunity [32]. We observed a significant decrease of CD68+ cells and MHC class II+ antigen-presenting cells in the livers and splenic red pulp of RMM tumor-bearing rats, with tumor progression. In a previous study on a rat model of liver cancer, the splenic macrophage phagocytic functions, antigen presentation and cytokine production were reduced in advanced cancer stages, suggesting a tumor-related immune suppression [33]. Spleen mobilizes monocytes which differentiate into TAMs in distant tumor stroma [34]. The decrease of CD68+ splenic cells in RMM tumor-bearing rats might be due to a possible mobilization of macrophage precursors into RMM tumor stroma. However, the number of CD163+ cells did not change in the liver, and suffered only a transient decrease in the spleen of rats bearing 1 cm RMM tumors. In liver and spleen, CD163 is expressed by tissue resident macrophages [20, 35]. CD163+ macrophages are implicated in the homeostasis of these organs [36] and, therefore, may not be significantly affected by distant tumor growth.
MHC Class II Expression on RMM Infiltrating Myeloid Cells is Correlated with M1-like Polarization, while CD163 Expression Indicates an M2-like Phenotype
TAMs are known to be recruited into hypoxic areas within tumors [37]. We investigated the levels of hypoxia-related factor HIF-1α in MHC II-HIGH areas, indicating that MHC class II+ cells are recruited into hypoxic RMM regions. However, tumor hypoxia did not appear to be responsible for the distinct distribution of MHC class II+ cells. mRNA level of IFN-γ was significantly increased in MHC II-HIGH regions. IFN-γ induces strong anti-tumor immune responses through enhancement of M1 macrophage cytotoxic activity and antigen presentation, and by blocking differentiation of monocytes into M2 TAMs [38, 39]. MHC II-HIGH regions were rich in mRNA of M1-related factors such as GM-CSF and IL-12a, as well. GM-CSF has been intensively studied for its use in cancer immunotherapy, due to its anti-tumor properties, such as stimulation of antigen presentation and tumor-specific T cell activation [40]. Interleukin-12 (IL-12) is a potent inducer of anti-tumor immunity and its effects have been shown to be mediated by the secretion of IFN-γ [41]. The above results show that RMM regions high in MHC class II are potentially rich in anti-tumor factors. Moreover, these M1-related factors, along with the MHC class II expression were significantly higher in MHC II-HIGH areas of 0.5 cm, in comparison to MHC II-HIGH areas of 3 cm; these results are possibly related to the decrease of MHC class II+ cell number in 3 cm RMM tumors. However, the LMD samples contain a multitude of cell types: tumor cells, immune cells, fibroblasts etc. [42]; taking this fact in consideration, it would be premature to assume that the difference in expression of the above factors is only due to the presence or absence of MHC class II+ cells.
Therefore, our next goal was to isolate the MHC class II+ cells from RMM tumor tissues and then, investigate their functional properties, in comparison with other myeloid cell subsets. Double immunofluorescence and flow cytometry analyses indicated that almost all MHC class II+ cells co-expressed CD11b, thus demonstrating a myeloid origin [21]. We investigated inflammation and tumor-progression related factors in tumor infiltrating MHC class II+ antigen-presenting myeloid cells, in comparison to myeloid cell subpopulations characterized by other markers, such as scavenger receptor CD163 for M2-polarization [43], costimulatory molecules CD80 for M1-polarization [39] and CD11c, a specific integrin found on dendritic cells [44].
Similar to MHC II-HIGH regions, CD11b+ MHC class II+ cells were rich in M1-related anti-tumor factors. CD11b+ CD163+ cells, on the other side, showed the highest expression of M2-related pro-tumor factors. These results are in agreement with previous studies on tumor-associated macrophages [6, 45]. Chemokines play vital roles in tumor progression, through facilitating tumor cell proliferation, angiogenesis or immune evasion. CCL-2, CCL-5, CXCL1 are only a few representatives from the plethora of chemokines implicated in tumor progression [46]. CCL-5, for example, promotes melanoma growth through attraction of immunosuppressive cells [47]. Matrix metalloproteinases (MMPs) and their natural inhibitors (TIMPs) are well known as mediators of tumor invasion and angiogenesis in a variety of cancers [48]. In the RMM melanoma model, CD163+ cells showed the highest expressions of CCL-2, MMP-2, TIMP-1 and TIMP-2, indicating their potentially pro-tumorigenic activity. Interestingly, the MHC class II+ cells exhibited the highest mRNA expressions of CCL-5 and MMP-9. Previous studies have shown a possible link between CCL-5 and MMP-9 in tumor progression, where stimulation of tumor cells with CCL-5 increases the MMP-9 production [49, 50]. MHC class II+ cells, although not significantly different in VEGFa expression compared to other myeloid cell subpopulations, highly expressed the VEGF receptor, Flt-1. Flt-1 gene encodes both the full-length receptor, which may stimulate tumor growth via macrophages, and a soluble protein, sFlt-1, which inhibits angiogenesis [51]. Therefore, the MHC class II+ cells may also have roles in tumor angiogenesis.
Although we could not assess by flow cytometry the breakdown of CD11b+ MHC class II− cells, we performed cell sorting and real-time RT-PCR for CD11b+ MHC class II+ and CD11b+ MHC class II− cells, and observed that the latter had significantly higher mRNA expressions of TAM molecules CD68 and CD163.These results suggest that CD11b+ MHC class II− may represent the M2 type of TAMs infiltrating RMM tumors. In fact, the CD11b+ MHC class II− cells induced a stronger tumor growth response upon adoptive transfer. The failure to demonstrate tumor inhibitory roles by treatment with CD11b+ MHC class II+ myeloid cells might be due to an insufficient number of adoptively transferred MHC class II+ cells. As RMM tumor cells are rapidly growing, a greater number of MHC class II+ cells might be necessary to counterattack the tumor progression.
According to our results, the MHC class II+ cells were predominantly polarized towards M1, while CD163+ cells were of M2 type polarization. The other myeloid cell subpopulations examined (CD80+ and CD11c+ cells) did not show significant differences in expression of the above factors, in comparison with either MHC class II+ or CD163+ cells, demonstrating a less clear polarization. Our results are different from those in published work on mouse models, where CD80+ cells are polarized towards M1 [14, 39]. CD11c is expressed by dendritic cells, which in tumors are frequently found in both mature and immature stages of differentiation. While CD11c+ mature dendritic cells exert anti-tumor functions, CD11c+ immature dendritic cells have low antigen presenting properties and show pro-tumorigenic activity [52]. Similar with other cancer- and inflammation-related studies, in our melanoma model as well, polarization of tumor-associated myeloid cells in vivo is more complex and may not be restricted solely to M1 and M2 extremes [7].
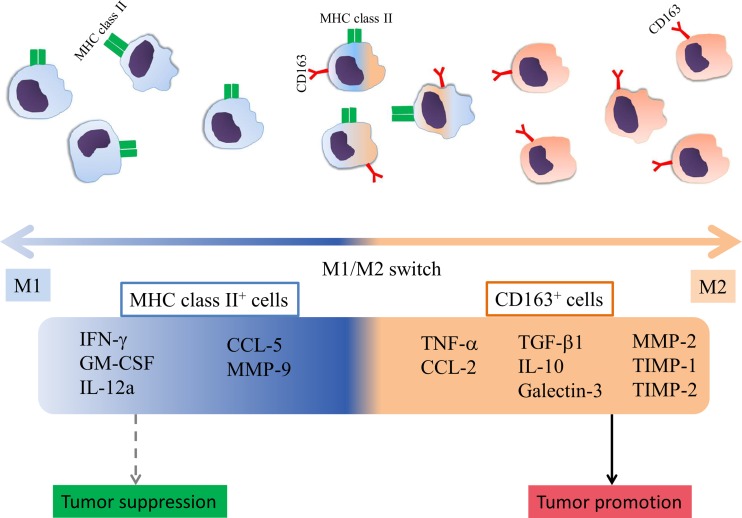
We are also aware of the limitations of our study; molecules such as MHC class II, CD163, CD80 and CD11c can be co-expressed by a single cell, thus, leading to a degree of overlapping between sorted cell subpopulations. However, we could successfully emphasize on the importance of certain molecule presence on tumor-associated myeloid cells, in regards with M1 and M2 polarized production of inflammation- and tumor progression-related factors. In our rat RMM melanoma model, the strongest polarization is determined by the expression of MHC class II (towards M1 type) and CD163 (towards M2 type) (Fig. 11), whereas the presence of CD80 and CD11c molecules is not significantly implicated in the polarization of tumor-associated myeloid cells.
Fig. 11.
Schematic representation of tumor-associated myeloid cell polarization in RMM melanoma model. MHC class II+ cells are polarized towards M1, while CD163+ cells, towards M2. MHC class II+ cells have up-regulated mRNA levels of M1-related anti-tumor factors IFN-γ, CSF-2 and IL-12a; mRNA levels of CCL-2 and MMP-9 are upregulated as well. MHC class II+ cells may have tumor growth inhibitory roles; however, these roles could not be demonstrated by the adoptive transfer of CD11b+ MHC class II+ cells into RMM tumors. CD163+ cells present increased mRNA levels of M2-related tumor-promoting factors TGF-β1, IL-10, Gal-3, MMP-2, TIMP-1, TIMP-2, and M1 & M2 factors, TNF-α and CCL-2, and may promote tumor growth, demonstrated by treatment with CD11b+ MHC class II− cells, which had rich mRNA levels of CD163 and induced tumor growth upon adoptive transfer
In conclusion, our study sheds light on the versatile properties of tumor-associated myeloid cells in a recently established model of amelanotic melanoma in F344 rats. The results provide important information which may prove useful in future research on melanoma immunopathology and development of therapeutic strategies against this malignancy.
Electronic Supplementary Material
(JPEG 209 kb)
(JPEG 74.9 kb)
(JPEG 113 kb)
Acknowledgements
This work was supported in part by JSPS KAKENHI grant number 22380173 to Yamate.
Abbreviations
- CCL
chemokine (C-C motif) ligand
- CD
cluster of differentiation
- CXCL
chemokine (C-X-C motif) ligand
- FACS
fluorescence-activated cell sorting
- FBS
fetal bovine serum
- Flt
FMS-related tyrosine kinase
- GM-CSF
granulocyte-macrophage colony-stimulating factor
- HE
hematoxylin and eosin
- HIF
hypoxia-inducible factor
- IFN
interferon
- IL
interleukin
- LMD
laser microdissection
- MDSC
myeloid-derived suppressor cell
- MHC
major histocompatibility complex
- MMP
matrix metalloproteinase
- NBF
neutral buffered formalin
- PBS
phosphate buffered saline
- PLP
periodate-lysine-paraformaldehyde
- RT-PCR
reverse transcriptase polymerase chain reaction
- TAM
tumor-associated macrophage
- TGF
transforming growth factor
- TIMP
tissue inhibitor of metalloproteinase
- TNF
tumor necrosis factor
- VEGF
vascular endothelial growth factor
Footnotes
Electronic supplementary material
The online version of this article (doi:10.1007/s12307-017-0193-x) contains supplementary material, which is available to authorized users.
References
- 1.Schmid MC, Varner JA. Myeloid cells in tumor inflammation. Vasc Cell. 2012;4:14. doi: 10.1186/2045-824X-4-14. [DOI] [PMC free article] [PubMed] [Google Scholar]
- 2.Sica A, Porta C, Morlacchi S, Banfi S, Strauss L, Rimoldi M, Totaro MG, Riboldi E. Origin and functions of tumor-associated myeloid cells (TAMCs) Cancer Microenviron. 2012;5:133–149. doi: 10.1007/s12307-011-0091-6. [DOI] [PMC free article] [PubMed] [Google Scholar]
- 3.Dong P, Ma L, Liu L, Zhao G, Zhang S, Dong L, Xue R, Chen S. CD86+/CD206+, diametrically polarized tumor-associated macrophages, predict hepatocellular carcinoma patient prognosis. Int J Mol Sci. 2016;17:320. doi: 10.3390/ijms17030320. [DOI] [PMC free article] [PubMed] [Google Scholar]
- 4.Hao NB, Lu MH, Fan YH, Cao YL, Zhang ZR, Yang SM (2012) Macrophages in tumor microenvironments and the progression of tumors. Clin Dev Immunol. doi:10.1155/2012/948098 [DOI] [PMC free article] [PubMed]
- 5.Liu CY, Xu JY, Shi XY, Huang W, Ruan TY, Xie P, Ding JL. M2-polarized tumor-associated macrophages promoted epithelial-mesenchymal transition in pancreatic cancer cells, partially through TLR4/IL-10 signaling pathway. Lab Investig. 2013;93:844–854. doi: 10.1038/labinvest.2013.69. [DOI] [PubMed] [Google Scholar]
- 6.Quatromoni JG, Eruslanov E. Tumor-associated macrophages: function, phenotype, and link to prognosis in human lung cancer. Am J Trans Res. 2012;4:376–389. [PMC free article] [PubMed] [Google Scholar]
- 7.Martinez FO and Gordon S (2014) The M1 and M2 paradigm of macrophage activation: time for reassessment. F100Prime rep 6:13. doi:10.12703/P6-13. [DOI] [PMC free article] [PubMed]
- 8.Umemura N, Saio M, Suwa T, Kitoh Y, Bai J, Nonaka K, Ouyang GF, Okada M, Balazs M, Adany R, Shibata T, Takami T. Tumor-infiltrating myeloid-derived suppressor cells are pleiotropic-inflamed monocytes/macrophages that bear M1- and M2-type characteristics. J Leukoc Biol. 2008;83:1136–1144. doi: 10.1189/jlb.0907611. [DOI] [PubMed] [Google Scholar]
- 9.Yang WC, Ma G, Chen SH, Pan PY. Polarization and reprogramming of myeloid-derived suppressor cells. J Mol Cell Biol. 2013;5:207–209. doi: 10.1093/jmcb/mjt009. [DOI] [PMC free article] [PubMed] [Google Scholar]
- 10.Fridlender ZG, Sun J, Kim S, Kapoor V, Cheng G, Ling L, Worthen GS, Albelda SM. Polarization of tumor-associated neutrophil (TAN) phenotype by TGF-β: “N1” versus “N2” TAN. Cancer Cell. 2009;8:183–194. doi: 10.1016/j.ccr.2009.06.017. [DOI] [PMC free article] [PubMed] [Google Scholar]
- 11.Thibodeau J, Bourgeois-Daigneault MC, Lapointe R. Targeting the MHC class II antigen presentation pathway in cancer immunotherapy. Oncoimmunology. 2012;1:908–916. doi: 10.4161/onci.21205. [DOI] [PMC free article] [PubMed] [Google Scholar]
- 12.Gerner MY, Mescher MF. Antigen processing and MHC-II presentation by dermal and tumor-infiltrating dendritic cells. J Immunol. 2009;182:2726–2737. doi: 10.4049/jimmunol.0803479. [DOI] [PMC free article] [PubMed] [Google Scholar]
- 13.Rőszer T (2014) Understanding the mysterious M2 macrophage through activation markers and effector mechanisms. Mediat Inflamm. doi:10.1155/2015/816460 [DOI] [PMC free article] [PubMed]
- 14.Yaddanapudi K, Putty K, Rendon BE, Lamont GJ, Faughn JD, Satoskar A, Lasnik A, Eaton JW, Mitchell RA. Control of tumor-associated macrophage alternative activation by macrophage migration inhibitory factor. J Immunol. 2013;190:2984–2993. doi: 10.4049/jimmunol.1201650. [DOI] [PMC free article] [PubMed] [Google Scholar]
- 15.Johnson DB, Estrada MV, Salgado R, Sanchez V, Doxie DB, Opalenik SR, Vilgelm AE, Feld E, Johnson AS, Greenplate AR, Sanders ME, Lovly CM, Frederick DT, Kelley MC, Richmond A, Irish JM, Shyr Y, Sullivan RJ, Puzanov I, Sosman JA, Balko JM. Melanoma-specific MHC-II expression represents a tumour-autonomous phenotype and predicts response to anti-PD-1/PD-L1 therapy. Nat Commun. 2016;7:10582. doi: 10.1038/ncomms10582. [DOI] [PMC free article] [PubMed] [Google Scholar]
- 16.Bondoc A, Katou-Ichikawa C, Golbar HM, Tanaka M, Izawa T, Kuwamura M, Yamate J. Establishment and characterization of a transplantable tumor line (RMM) and cell line (RMM-C) from a malignant amelanotic melanoma in the F344 rat, with particular reference to galectin-3 expression in vivo and in vitro. Histol Histopathol. 2016;7:11748. doi: 10.14670/HH-11-748. [DOI] [PubMed] [Google Scholar]
- 17.Barth RF, Kaur B. Rat brain tumor models in experimental neuro-oncology: the C6, 9L, T9, RG2, F98, BT4C, RT-2 and CNS-1 gliomas. J Neuro-Oncol. 2009;94:299–312. doi: 10.1007/s11060-009-9875-7. [DOI] [PMC free article] [PubMed] [Google Scholar]
- 18.Szpirer C. Cancer research in rat models. Methods Mol Biol. 2010;597:445–458. doi: 10.1007/978-1-60327-389-3_30. [DOI] [PubMed] [Google Scholar]
- 19.Faustino-Rocha A, Oliveira PA, Pinho-Oliveira J, Teixeira-Guedes C, Soares-Maia R, da Costa RG, Colaco B, Pires MJ, Colaco J, Ferreira R, Ginja M. Estimation of rat mammary tumor volume using caliper and ultrasonography measurements. Lab Anim. 2013;42:217–224. doi: 10.1038/laban.254. [DOI] [PubMed] [Google Scholar]
- 20.Pervin M, Golbar HM, Bondoc A, Izawa T, Kuwamura M, Yamate J. Immunophenotypical characterization and influence on liver homeostasis of depleting and repopulating hepatic macrophages in rats injected with clodronate. Exp Toxicol Pathol. 2016;68:113–124. doi: 10.1016/j.etp.2015.11.003. [DOI] [PubMed] [Google Scholar]
- 21.Lim SY, Gordon-Weeks A, Allen D, Kersemans V, Beech J, Smart S, Muschel RJ. Cd11b(+) myeloid cells support hepatic metastasis through down-regulation of angiopoietin-like 7 in cancer cells. Hepathology. 2015;62:521–533. doi: 10.1002/hep.27838. [DOI] [PubMed] [Google Scholar]
- 22.Misharin AV, Morales-Nebreda L, Mutlu GM, Scott Budinger GR, Perlman H. Flow cytometric analysis of macrophages and dendritic cell subsets in the mouse lung. Am J Respir Cell Mol Biol. 2013;49:503–510. doi: 10.1165/rcmb.2013-0086MA. [DOI] [PMC free article] [PubMed] [Google Scholar]
- 23.Li H, Zhang GX, Chen Y, Xu H, Fitzgerald DC, Zhao Z, Rostami A. CD11c+ CD11b+ dendritic cells play an important role in intravenous tolerance and the suppression of experimental autoimmune encephalomyelitis. J Immunol. 2008;181:2483–2493. doi: 10.4049/jimmunol.181.4.2483. [DOI] [PMC free article] [PubMed] [Google Scholar]
- 24.Fritz JM, Tennis MA, Orlicky DJ, Lin H, Ju C, Redente EF, Choo KS, Staab TA, Bouchard RJ, Merrick DT, Malkinson AM, Dwyear-Niels LD. Depletion of tumor-associated macrophages slows the growth of chemically induced mouse lung adenocarcinomas. Front Immunol. 2014;5:587. doi: 10.3389/fimmu.2014.00587. [DOI] [PMC free article] [PubMed] [Google Scholar]
- 25.Gabrusiewicz K, Hossain MB, Cortes-Santiago N, Fan X, Kaminska B, Marini FC, Fuevo J, Gomez-Manzano C. Macrophage ablation reduces M2-like populations and jeopardizes tumor growth in a MAFIA-based glioma model. Neoplasia. 2015;17:474–384. doi: 10.1016/j.neo.2015.03.003. [DOI] [PMC free article] [PubMed] [Google Scholar]
- 26.Torisu H, Ono M, Kiryu H, Furue M, Ohmoto Y, Nakayama J, Nishioka Y, Sone S, Kuwano M. Macrophage infiltration correlates with tumor stage and angiogenesis in human malignant melanoma: possible involvement of TNFalpha and IL-1alpha. Int J Cancer. 2000;85:182–188. doi: 10.1002/(SICI)1097-0215(20000115)85:2%3C182::AID-IJC6%3E3.0.CO;2-M. [DOI] [PubMed] [Google Scholar]
- 27.Hussein MR. Tumour-associated macrophages and melanoma tumourigenesis: integrating the complexity. Int J Exp Pathol. 2006;87:163–176. doi: 10.1111/j.1365-2613.2006.00478.x. [DOI] [PMC free article] [PubMed] [Google Scholar]
- 28.Normann SJ, Cornelius J. Concurrent depression of macrophage infiltration and systemic inflammation by progressive cancer growth. Cancer Res. 1978;38:3453–3459. [PubMed] [Google Scholar]
- 29.Gordon S, Pluddemann A, Martinez Estrada F. Macrophage heterogeneity in tissues: phenotypic diversity and functions. Immunol Rev. 2014;262:36–55. doi: 10.1111/imr.12223. [DOI] [PMC free article] [PubMed] [Google Scholar]
- 30.Chanmee T, Ontong P, Konno K, Itano N. Tumor-associated macrophages as major players in the tumor microenvironment. Cancers (Basel) 2014;6:1670–1690. doi: 10.3390/cancers6031670. [DOI] [PMC free article] [PubMed] [Google Scholar]
- 31.Tarantino G, Scalera A, Finelli C. Liver-spleen axis: intersection between immunity, infections and metabolism. World J Gastroenterol. 2013;19:3534–3542. doi: 10.3748/wjg.v19.i23.3534. [DOI] [PMC free article] [PubMed] [Google Scholar]
- 32.Hey YY, O'Neil HC. Murine spleen contains a diversity of myeloid and dendritic cells distinct in antigen presenting function. J Cell Mol Med. 2012;16:2611–2619. doi: 10.1111/j.1582-4934.2012.01608.x. [DOI] [PMC free article] [PubMed] [Google Scholar]
- 33.Zhang S, Li ZF, Pan D, Huang C, Zhou R, Liu ZW. Changes of splenic macrophage during the process of liver cancer induced by diethylnitrosamine in rats. Chin Med J. 2009;122:3043–3047. [PubMed] [Google Scholar]
- 34.Cortez-Retamozo V, Etzrodt M, Newton A, Rauch PJ, Chudnovskiy A, Berger C, Ryan RJ, Iwamoto Y, Marinelli B, Gorbatov R, Forghani R, Novobrantseva TI, Koteliansky V, Figueiredo JL, Chen JW, Anderson DG, Nahrendorf M, Swirski FK, Weissleder R, Pittet MJ. Origins of tumor-associated macrophages and neutrophils. Proc Natl Acad Sci U S A. 2012;14:2491–2496. doi: 10.1073/pnas.1113744109. [DOI] [PMC free article] [PubMed] [Google Scholar]
- 35.Graversen JH, Svendsen P, Dagnæs-Hansen F, Dal J, Anton G, Etzerodt A, Petersen MD, Christensen PA, Møller HJ, Moestrup SK. Targeting the hemoglobin scavenger receptor CD163 in macrophages highly increases the anti-inflammatory potency of dexamethasone. Mol Ther. 2012;20:1550–1558. doi: 10.1038/mt.2012.103. [DOI] [PMC free article] [PubMed] [Google Scholar]
- 36.Davies LC, Taylor PR. Tissue-resident macrophages: then and now. Immunology. 2015;144:541–548. doi: 10.1111/imm.12451. [DOI] [PMC free article] [PubMed] [Google Scholar]
- 37.Tripathi C, Tewari BN, Kanchan RK, Baghel KS, Nautiyal N, Shrivastava R, Kaur H, Bhatt ML, Bhadauria S. Macrophages are recruited to hypoxic tumor areas and acquire a pro-angiogenic M2-polarized phenotype via hypoxic cancer cell derived cytokines Oncostatin M and Eotaxin. Oncotarget. 2014;5:5350–5368. doi: 10.18632/oncotarget.2110. [DOI] [PMC free article] [PubMed] [Google Scholar]
- 38.Duluc D, Corvaisier M, Blanchard S, Catala L, Descamps P, Gamelin E, Ponsoda S, Delneste Y, Hebbar M, Jeannin P. Interferon-gamma reverses the immunosuppressive and protumoral properties and prevents the generation of human tumor-associated macrophages. Int J Cancer. 2009;125:367–373. doi: 10.1002/ijc.24401. [DOI] [PubMed] [Google Scholar]
- 39.Kalish SV, Lyamina SV, Usanova EA, Manukhina EB, Larionov NP, Malyshev IY. Macrophages reprogrammed in vitro towards the M1 phenotype and activated with LPS extend lifespan of mice with Ehrlich ascites carcinoma. Med Sci Monit basic res. 2015;21:226–234. doi: 10.12659/MSMBR.895563. [DOI] [PMC free article] [PubMed] [Google Scholar]
- 40.Gupta R, Emens LA. GM-CSF-secreting vaccines for solid tumors: moving forward. Discov Med. 2010;10:52–60. [PMC free article] [PubMed] [Google Scholar]
- 41.Tugues S, Burkhard SH, Ohs I, Vrohlings M, Nussbaum K, Vom Berg J, Kulig P, Becher B. New insights into IL-12-mediated tumor suppression. Cell Death Differ. 2015;22:237–246. doi: 10.1038/cdd.2014.134. [DOI] [PMC free article] [PubMed] [Google Scholar]
- 42.Balkwill FR, Capasso M, Hagemann T. The tumor microenvironment at a glance. J Cell Sci. 2012;125:5591–5596. doi: 10.1242/jcs.116392. [DOI] [PubMed] [Google Scholar]
- 43.Sousa S, Brion R, Lintunen M, Kronqvist P, Sandholm J, Mönkkönen J, Kellokumpu-Lehtinen PL, Lauttia S, Tynninen O, Joensuu H, Heymann D, Määttä JA. Human breast cancer cells educate macrophages toward the M2 activation status. Breast Cancer Res. 2015;17:101. doi: 10.1186/s13058-015-0621-0. [DOI] [PMC free article] [PubMed] [Google Scholar]
- 44.Kugathasan K, Roediger EK, Small CL, McCormick S, Yang P, Xing Z. CD11c+ antigen presenting cells from the alveolar space, lung parenchyma and spleen differ in their phenotype and capabilities to activate naïve and antigen-primed T cells. BMC Immunol. 2008;9:48. doi: 10.1186/1471-2172-9-48. [DOI] [PMC free article] [PubMed] [Google Scholar]
- 45.Heusinkveld M, van der Burg SH. Identification and manipulation of tumor associated macrophages in human cancers. J Transl Med. 2011;9:216. doi: 10.1186/1479-5876-9-216. [DOI] [PMC free article] [PubMed] [Google Scholar]
- 46.Sarvaiya PJ, Guo D, Ulasov I, Gabikian P, Lesniak MS. Chemokines in tumor progression and metastasis. Oncotarget. 2013;12:2171–2185. doi: 10.18632/oncotarget.1426. [DOI] [PMC free article] [PubMed] [Google Scholar]
- 47.Aldinucci D, Colombatti A (2014) The inflammatory chemokine CCL5 and cancer progression. Mediat Inflamm. doi:10.1155/2014/292376 [DOI] [PMC free article] [PubMed]
- 48.Gong Y, Chippada-Venkata UD, Oh WK. Roles of matrix metalloproteinases and their natural inhibitors in prostate cancer progression. Cancers (Basel) 2014;6:1298–1327. doi: 10.3390/cancers6031298. [DOI] [PMC free article] [PubMed] [Google Scholar]
- 49.Chuang JY, Yang WH, Chen HT, Huang CY, Tan TW, Lin YT, Hsu CJ, Fong YC, Tang CH. CCL5/CCR5 axis promotes the motility of human oral cancer cells. J Cell Physiol. 2009;220:418–426. doi: 10.1002/jcp.21783. [DOI] [PubMed] [Google Scholar]
- 50.Long H, Xie R, Xiang T, Zhao Z, Lin S, Liang Z, Chen Z, Zhu B. Autocrine CCL5 signaling promotes invasion and migration of CD133+ ovarian cancer stem-like cells via NF-κB-mediated MMP-9 upregulation. Stem Cells. 2012;30:2309–2319. doi: 10.1002/stem.1194. [DOI] [PubMed] [Google Scholar]
- 51.Shibuya M. Involvement of Flt-1 (VEGF receptor-1) in cancer and preeclampsia. Proc Jpn Acad Ser B Phys Biol Sci. 2011;87:167–178. doi: 10.2183/pjab.87.167. [DOI] [PMC free article] [PubMed] [Google Scholar]
- 52.Tran Janco JM, Lamichhane P, Karyampudi L, Knutson KL. Tumor-infiltrating dendritic cells in cancer pathogenesis. J Immunol. 2015;194:2985–2991. doi: 10.4049/jimmunol.1403134. [DOI] [PMC free article] [PubMed] [Google Scholar]
Associated Data
This section collects any data citations, data availability statements, or supplementary materials included in this article.
Supplementary Materials
(JPEG 209 kb)
(JPEG 74.9 kb)
(JPEG 113 kb)


