Abstract
The dual specificity phosphatases (DUSPs) constitute a family of stress-induced enzymes that provide feedback inhibition on mitogen-activated protein kinases (MAPKs) critical in key aspects of oncogenic signaling. While described in other tumor types, the landscape of DUSP mRNA expression in glioblastoma (GB) remains largely unexplored. Interrogation of the REpository for Molecular BRAin Neoplasia DaTa (REMBRANDT) revealed induction (DUSP4, DUSP6), repression (DUSP2, DUSP7–9), or mixed (DUSP1, DUSP5, DUSP10, DUSP15) DUSP transcription of select DUSPs in bulk tumor specimens. To resolve features specific to the tumor microenvironment, we searched the Ivy Glioblastoma Atlas Project (Ivy GAP) repository, which highlight DUSP1, DUSP5, and DUSP6 as the predominant family members induced within pseudopalisading and perinecrotic regions. The inducibility of DUSP1 in response to hypoxia, dexamethasone, or the chemotherapeutic agent camptothecin was confirmed in GB cell lines and tumor-derived stem cells (TSCs). Moreover, we show that loss of DUSP1 expression is a characteristic of TSCs and correlates with expression of tumor stem cell markers in situ (ABCG2, PROM1, L1CAM, NANOG, SOX2). This work reveals a dynamic pattern of DUSP expression within the tumor microenvironment that reflects the cumulative effects of factors including regional ischemia, chemotherapeutic exposure among others. Moreover, our observation regarding DUSP1 dysregulation within the stem cell niche argue for its importance in the survival and proliferation of this therapeutically resistant population.
Electronic supplementary material
The online version of this article (doi:10.1007/s12307-017-0197-6) contains supplementary material, which is available to authorized users.
Keywords: DUSP1, Glioblastoma multiforme, Tumor stem cell, Dexamethasone, Camptothecin, Mitogen-activated protein kinases, Hypoxia, Temozolomide
Introduction
Features of microvascular proliferation, cellular heterogeneity, bilateral invasion, and extensive necrosis define glioblastoma (GB) tumors. The accumulation of genomic mutations induce metabolic reprogramming, cellular proliferation, and enhanced survival culminating in the classical histological features characteristic of grade IV tumors [1, 2]. These phenotypes emerge via subsequent cycles of tumor outgrowth and secondary ischemia-induced necrosis creating marked regional heterogeneity across the tissue specimen. Specific tumor sub-regions include the leading edge consisting of the infiltrating, the bulk cellular tumor, and deeper regions characterized by neovascularization, pseudopalisading, and necrosis driven by the imbalance between metabolic supply and demand [3]. In addition to producing this regional heterogeneity within the tumor mass, intratumoral ischemia also plays a key role in the pathogenesis of glioblastoma, notably through the proliferation and self-renewal of tumor stem cells (TSCs). Defined by double labeling immunofluorescence studies of tumor stem cell markers within GB tissue specimens [4], the milieu within the perivascular and perinecrotic regions promote maintenance of TSC stem cell properties including their high rates of proliferation and chemotherapeutic resistance [5].
Mutations affecting tumor suppressor genes including TP53 and RB1 in tandem along with gain of function mutations in the tyrosine kinase receptor EGFR, among others produce synergistic oncogenic effects in glioblastoma [6]. These changes have important effects on the mitogen-activated protein kinase cascade comprised of extracellular signal-regulated kinase, c-Jun N-terminal kinase, and p38 kinase [6]. ERK, JNK, and p38 respond to a multitude of stimuli with their activation having classically been associated with a variety of cellular processes including proliferation, apoptosis, and differentiation [7, 8]. And although MAPK signaling is an attractive therapeutic target, the selective drugging of various effectors with small molecule kinase inhibitors in recurrent GB has yielded unimpressive results in the clinic [9]. Thus, identification of alternate pathways capable of attenuating MAPK signaling tone in glial tumors may have therapeutic benefit.
Under homeostatic conditions, growth factor signaling mediated by MAPKs is held in check by a family of mitogen-activated protein kinase dual-specificity phosphatases (MKP/DUSPs) that exhibit context-dependent feedback. To date, studies investigating DUSP family expression in various tumors have revealed marked diversity [8]. In the case of GBP, studies of DUSP1 and DUSP6 regulation argue for upregulation relative to normal tissue [10, 11]. And while somatic mutations of DUSP family members have not been reported in GB, studies have identified DUSP4 downregulation via mechanisms involving promoter hypermethylation [12]. Early studies also indicate that DUSPs respond dynamically to a variety of stimuli present in the tumor microenvironment including mitogenic stimulation [13], differentiation [14], ischemia [15], and exposure to corticosteroids and chemotherapeutics [16].
Given the importance of MKP/DUSP negative feedback on mitogenic signaling and the body of evidence linking their dysregulation in other cancer models, we asked whether changes in DUSP transcription contribute to unrestrained proliferation and therapeutic resistance observed in GB tumors. Our results indicate that the family of DUSPs exhibit marked heterogeneity across the tumor microenvironment. Further analysis of these trends suggested that DUSP1 dysregulation may play a particularly important role in regulating the tumor stem cell compartment in glial tumors.
Materials and Methods
REMBRANDT Microarray Analysis
The REpository for Molecular BRAin Neoplasia DaTa (REMBRANDT) database contains 228 pathologically confirmed cases of mixed primary and secondary GB including four, tumor re-resections that were subjected to expression profiling using the Affymetrix HG_U133 gene chips with the highest geometric mean intensity [17]. Sample data values were distributed as fold changes from the geometric mean of normal brain tissue obtained from patients undergoing surgical resection for medically refractory temporal lobe epilepsy (TLE).
Cerebral Cortex RNA-Seq Analysis
DUSP expression profiles were analyzed using the Barres RNA-Seq transcriptome generated from eight cell types present in the mouse cortex (web.stanford.edu/group/barres_lab/brain_rnaseq). Single cell suspensions were generated from the cortices of postnatal mice and purified by FACS sorting for cell-specific markers as described by Zhang et al. prior to RNA-seq analysis [18]. Although data were obtained for eight different cellular populations, we focused our analyses on oligodendrocyte progenitors (OPCs), astrocytes, microglia, and neurons. FPKM values were plotted for each dataset.
Ivy Glioblastoma Atlas Project RNA-Seq Analyses
RNA-seq datasets of total cell and TSC-only human tissue samples were downloaded from the Ivy Glioblastoma Atlas Project (Ivy GAP) website (http://glioblastoma.alleninstitute.org/rnaseq) [19]. Each dataset contained samples that were microdissected based on sub-regional localization prior to transcriptional analyses. Briefly, 122 RNA samples were curated from 10 grade IV GB tumors that were microdissected into five structural groups using ISH panels to identify regionally enriched genesets. For TSC sample isolation, a panel of seventeen GB TSC markers was used by Ivy GAP to identify and isolate GB TSC clusters within GB biopsy specimens that localized with micro environmental region markers.
The Cancer Genome Atlas Analyses
Gene expression datasets from grade IV GB samples analyzed by Affymetrix HT_HG-U133A microarray gene chips were curated from the Cancer Genome Atlas (TCGA) data portal [20]. R-values were computed between datasets not assumed to be sampled from Gaussian distributions using nonparametric Spearman correlation analysis. For heat map images, values for each gene target were first normalized to the maximum expression value within that geneset. Expression values were next sorted from max to min DUSP1 expression for each sample, before stratification into ten sample bins that were displayed as an average gene expression.
Transcriptional Analyses of Primary Glioblastoma Tumors
Clinical specimens used in this study were provided by the Neurosurgical Brain Tissue Bank of the University of Rochester under protocol #00049707 approved by the University of Rochester Research Subjects Review Board. Grade IV GB and epileptic control tissues were stored at −80°C prior to total RNA isolation. To harvest RNA, Buffer RLT and homogenizer beads were added to samples prior to agitation for three minutes and transfered to QIAshredder spin columns (Qiagen, Valencia, CA, USA). Cells were harvested for total mRNA using the RNeasy kit (Qiagen, Valencia, CA, USA) and cDNA was reverse transcribed using the iScript cDNA Synthesis kit (Bio-Rad, Hercules, CA, USA) for Taqman probe-based quantitative PCR reactions of human DUSP1 (FAM-MGB, Hs00610256_g1), DUSP2 (FAM-MGB, Hs00358879_m1), DUSP7 (FAM-MGB, Hs00997002_m1), and DUSP8 (FAM-MGB, Hs01014943_m1) (Life Technologies (Grand Island, NY, USA). 18SRRNA (VIC-MGB, Hs03003631_g1) was used as an internal reference gene for standardization in multiplex reactions. ∆∆CT analysis was performed for relative quantification of target gene regulation relative to control samples.
Cell Culture
U251 and U343 tumor cells (obtained from Dr. Carson-Walter, University of Rochester, Rochester, NY) were maintained in DMEM, high glucose with L-glutamine, sodium pyruvate, and 1× penicillin-streptomycin (Life Technologies, Grand Island, NY, USA), supplemented with 10% heat-inactivated fetal bovine serum (Innovative Research, Novi, MI, USA). GB TSCs obtained from Dr. Angelo Vescovi (IRCSS Casa Sollievo della Sofferenza, Opera di San Pio da Pietrelcina, viale dei Cappuccini, 1, 71,013 S. Giovanni Rotondo, Italy) [21] were maintained in DMEM/F12 with L-glutamine (Corning Life Sciences, Tewksbury, MA, USA) and 1× penicillin-streptomycin, supplemented with B-27 minus vitamin A (Thermo Fisher Scientific, Waltham, MA, USA), 20 ng/mL EGF, and 20 ng/mL bFGF (Peprotech, Rocky Hill, NJ, USA). Differentiation of GB TSCs was performed by plating cells on 60-mm laminin-coated plates (Sigma-Aldrich, St. Louis, MO, USA) in DMEM/F12 with L-glutamine and 1× penicillin-streptomycin, supplemented with 5% fetal bovine serum for a minimum of 3 days prior to harvest. In all conditions, cells were passed at 37°C under humidified, (21% O2) conditions supplemented with 5% CO2 (BINDER, Bohemia, NY, USA).
Flow Cytometry
GB TSCs were plated at 500 cells/mm2 72 h prior to harvest. Upon harvest, cells were fixed in 10% paraformaldehyde for 25 min and permeabilized in 0.5% Triton X-100 for 15 min before incubating with primary antisera. Staining for anti-SOX2-V450, anti-GLAST1-APC, and anti-NEUROD1-PE (BD Biosciences, San Jose, CA), was carried out for 30 min at 4°C in the dark. Forward scatter, side scatter, Violet C (V450), Red C (APC), and Blue E (PE) were collected on a 3-laser, 12-color BD LSR-II platform (BD Biosciences) and FlowJo software (FLOWJO, Portland, OR) were used for analysis. Data from 10,000 cells was collected, and live cells were gated using forward and side scatter data prior to fluorescence analyses.
Hypoxia/Drug Treatments
U251 cells and GB TSCs were plated at 400 and 250 cells/mm2, respectively, and incubated overnight under normal conditions. Hypoxic incubations were carried out under 0.5% O2 / 5% CO2 conditions in a Binder incubator. Drug stocks were reconstituted as follows: CPT (C9911; Sigma-Aldrich), 10 mM in DMSO; DEX (D2915; Sigma-Aldrich), 0.25 mM in ddH20; TMZ (sc-203,292; Santa Cruz Biotechnology), 10 mM in ddH2O; and TOPO (sc-204,919; Santa Cruz Biotechnology), 0.3 mM in ddH2O and treatments were administered for 24 h prior to cell harvest.
Statistical Analyses
All statistical comparisons were performed using the GraphPad Prism application. REMBRANDT and gene expression data from the URMC brain bank tumor specimens were analyzed using column statistics to calculate medians, standard deviations, and interquartile ranges. R-values were computed between datasets not assumed to be sampled from Gaussian distributions using nonparametric Spearman correlation analysis. GB microenvironment regional DUSP expression identified in the Ivy Allen Brain Dataset analyses, the primary tumor analyses, and in vitro analyses of DUSP1 regulation in both TSCs and established GB tumor lines were expressed as the mean ± standard deviation and were tested by one-way ANOVA using the Bonferroni test for multiple comparisons. Results with p-values less than 0.05 were considered significant.
Results
Profiling DUSP Expression in GB Tumors
To assess changes in MKP/DUSP expression within GB samples, we interrogated the REMBRANDT dataset plotting the expression of the ten active family members for each tumor specimen (n = 228) relative to non-tumorigenic brain tissue. Although results show significant variation in DUSP expression across clinical subjects, we observed several key trends in both the magnitude and direction of the average response (Fig. 1). In the first group including DUSP1 (1.41, IQR = 1.40), DUSP5 (1.04, IQR = 0.73), DUSP10 (0.96, IQR = 0.51), and DUSP16 (1.04, IQR = 0.53) gene expression changes were modest, exhibiting less than a two-fold change with little directional skew. The second group of targets including DUSP2 (0.24, IQR = 0.45), DUSP7 (0.57, IQR = 0.60), DUSP8 (0.33, IQR = 0.27), and DUSP9 (0.58, IQR = 0.40) exhibited greater than two-fold reductions in gene expression with relatively few outliers. Conversely, DUSP4 (3.22, IQR = 4.44) and DUSP6 (2.34, IQR = 2.41) showed greater than two-fold inductions in gene expression in the majority of samples. Given their prominence in the literature and distinct patterns of expression, we performed qPCR analysis for DUSP1 and DUSP2 from a cohort of grade IV primary GB samples deposited at the University of Rochester Brain Bank to corroborate these findings. Results demonstrate that, on average, DUSP1 levels were unchanged relative to epileptic controls (1.0 ± 0.44 vs. 1.65 ± 2.34; p = 0.822) while DUSP2 (1.0 ± 0.43 vs. 0.33 ± 0.38; p = 0.020), DUSP7 (1.0 ± 0.45 vs. 0.17 ± 0.15; p = 0.003), and DUSP8 (1.0 ± 0.37 vs. 0.33 ± 0.21; p = 0.003), expressions were significantly downregulated comparable to changes observed in the REMBRANDT analysis (Fig. 2).
Fig. 1.
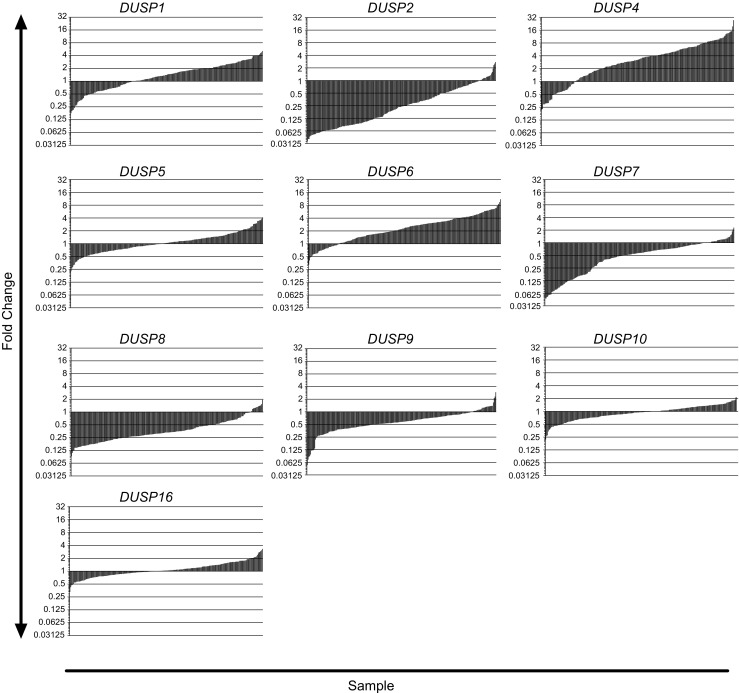
Microarray profiling of DUSPs across mixed primary and secondary GB tumors. Histograms depicting the fold change in mRNA expression for each of the DUSP members analyzed using the REMBRANDT Microarray dataset. Gene expression levels for each GB tumor (n = 228) are presented as fold change relative to the average level across normal tissue controls (n = 28) and plotted on a log2 scale
Fig. 2.
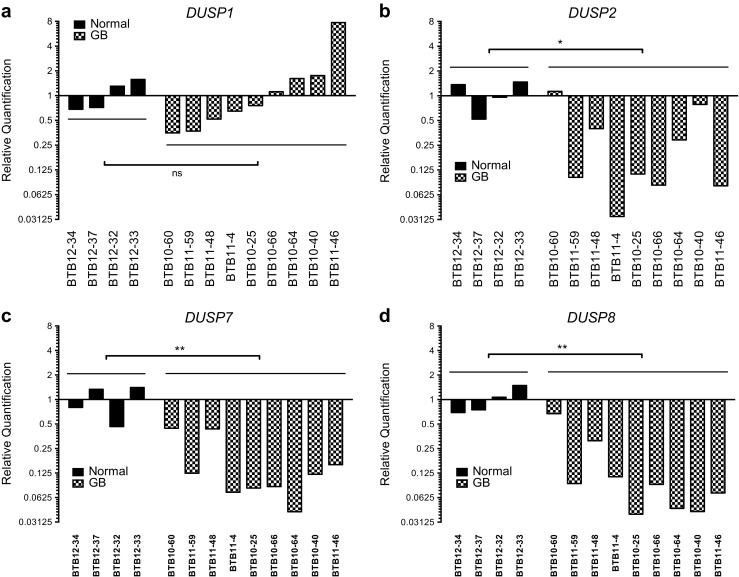
Quantitative PCR analysis of DUSP expressions in epileptic control and grade IV GB tumors. Quantitative PCR analysis of DUSP1, DUSP2, DUSP7, and DUSP8 expression in human grade IV GB tissue samples (GB, n = 9) and temporal lobe epileptic controls (normal, n = 4) maintained by the University of Rochester Brain Tissue Bank. Fold-induction data are presented relative to the average expression of the comparator gene within epileptic controls and presented using a log2 scale. Statistical significance was measured across groups by one-way ANOVA (ns = not significant, * = p < 0.05, ** = p < 0.01)
Effects of Tumor Cellular Composition and Microenvironment on DUSP Expression in GB
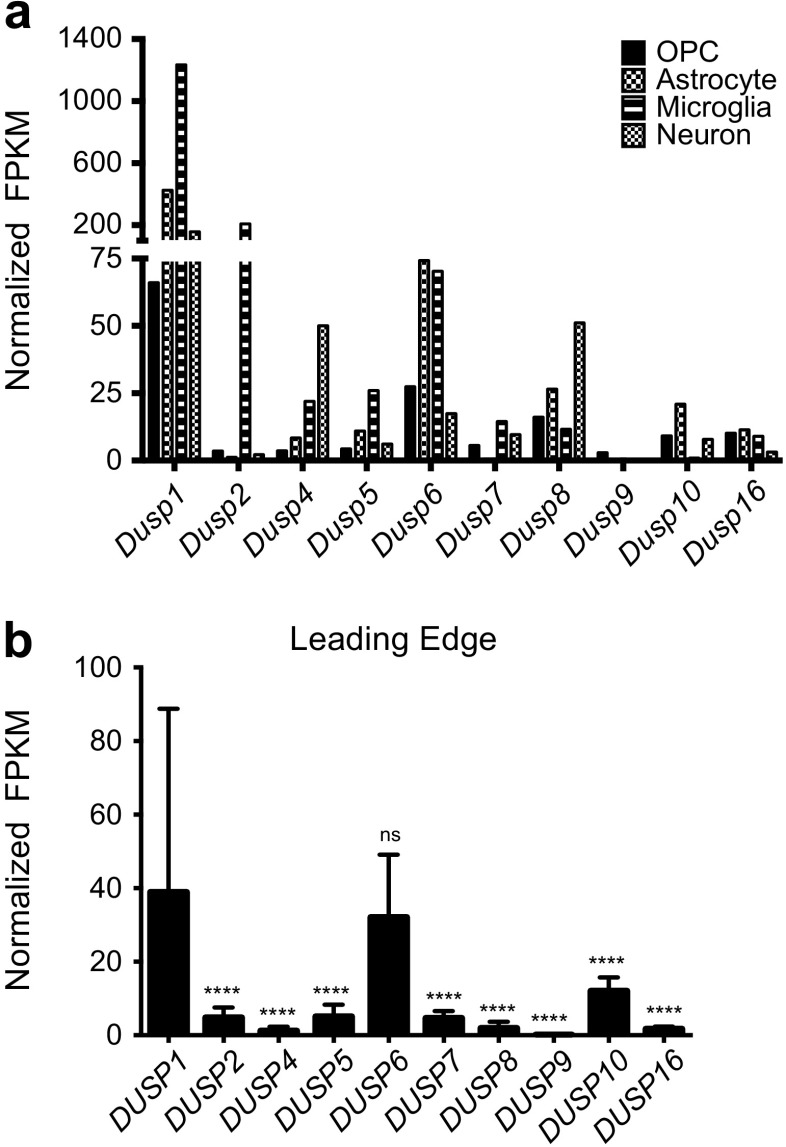
We next asked whether the transition away from the transcriptional composition of normal brain parenchyma, towards a glial-type phenotype characteristic of GBM, might explain the shifting expression of DUSP family members observed in the REMBRANDT dataset. To test this hypothesis, we first compared Dusp expression in purified mouse glia against levels in neurons, oligodendroglia, among other cell types isolated by immunopanning from the cerebral cortex with the Barres RNA-Seq database [18]. Results demonstrate considerable differences in Dusp expression across the four lineages analyzed (Fig. 3a). Overall, Dusp1 and Dusp6 were the most highly expressed dual specificity phosphatase across all cell types. Other trends were noted, including expression peaks in microglia (Dusp2, Dusp6), astrocytes (Dusp1, Dusp6), and neurons (Dusp1, Dusp4, Dusp8). To corroborate these results, we performed a secondary RNA-seq analysis using the Ivy Glioblastoma Atlas database (IvyGAP) [19]. The Ivy dataset is comprised of 122 RNA samples from ten GB tumors that were laser micro-dissected into five structural groups using ISH panels to identify regionally enriched genesets. The leading edge (LE) on the outer rim of the tumor contains the highest ratio (50:1) of normal to cancerous tissue. Comparable to our prior analyses, we found that DUSP1 expression (39.0 ± 49.8) was significantly higher (p < 0.0001) than all other DUSP members except DUSP6 (32.1 ± 17.0) (Fig. 3b).
Fig. 3.
Cell type and region specific profile of DUSP expression. a RNA-Seq expression levels of the Dusp family obtained from the Barres online dataset presented as normalized fragments per kilobase of transcript per million mapped reads (FPKM) across various cell types. RNA-Seq data were originally generated from purified oligodendrocyte precursor cell (OPC), astrocyte, microglia, and neuronal populations isolated from mouse P7 cortices by immunopanning (n = 19) as described [18]. b Analysis of DUSP expression within the “normal” leading edge (LE) of human GB tumors. RNA-Seq data from the Ivy GAP database are presented. LE regions of GB biopsy samples (50:1 normal:tumor cells) were identified using ISH panels and microdissected by the Ivy GAP consortium prior to RNA-Seq analysis. The data in (b) are presented as the average ± standard deviation, and statistical significance was determined using one-way ANOVA with Bonferroni correction for multiple comparisons (DUSP1 vs. all datasets; ns = not significant, **** = p < 0.0001)
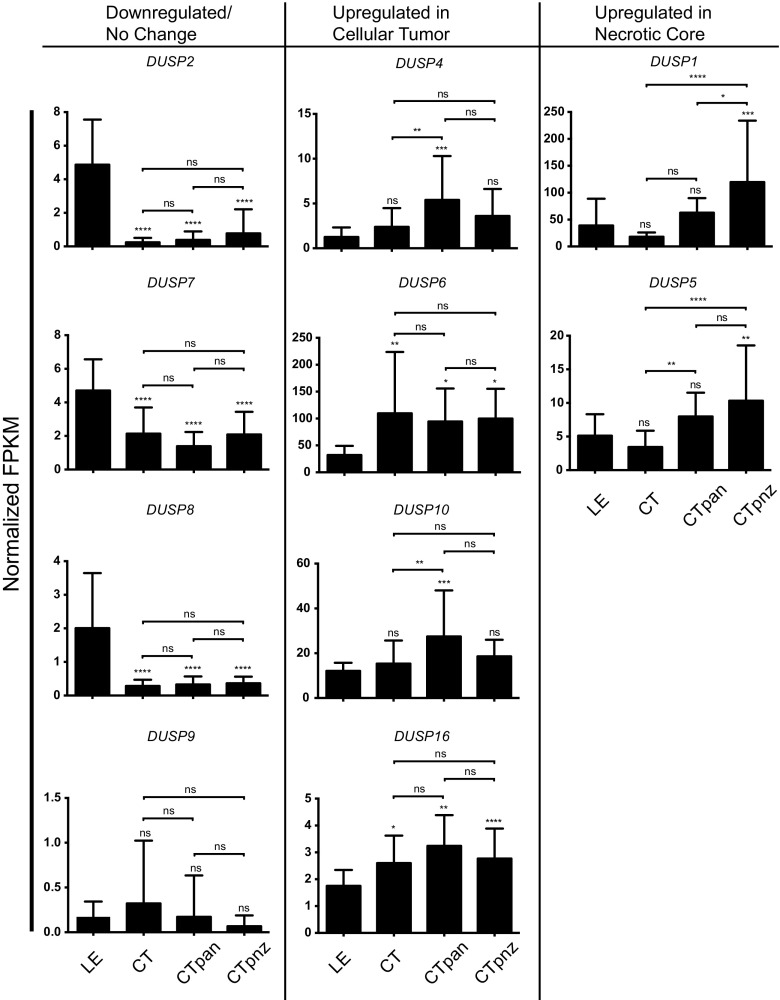
Given the observed variability in expression of select DUSPs across clinical specimens, we considered whether parsing factor expression based on regional physiological changes across the tumor microenvironment might be informative. To test this, we profiled DUSP expression within the leading edge (LE), bulk cellular tumor (CT), pseudopalisading around necrosis (CTpan), and perinecrotic (CTpnz) zones dissected from human GB samples using laser capture microdissection followed by RNA-seq as described [19]. Using LE regional expression as the control reference, we found that the general trends in expression were consistent with the REMBRANDT analyses. Relative to LE controls, FPKM values for DUSP2 (LE: 4.9 ± 2.7; CT: 0.2 ± 0.3; CTpan: 0.4 ± 0.5; CTpnz: 0.8 ± 1.4; p < 0.0001), DUSP7 (LE: 4.7 ± 1.9; CT: 2.1 ± 1.6; CTpan: 1.4 ± 0.8; CTpnz: 2.1 ± 1.3; p < 0.0001), and DUSP8 (LE: 2.0 ± 1.6; CT: 0.3 ± 0.2; CTpan: 0.3 ± 0.2; CTpnz: 0.4 ± 0.2; p < 0.0001) were downregulated in all tumor regions. Conversely, FPKM values for DUSP4 (LE: 1.3 ± 1.1; CT: 2.4 ± 2.1, ns; CTpan: 5.4 ± 4.9, p < 0.001; CTpnz: 3.6 ± 3.0, ns), DUSP6 (LE: 32.1 ± 17.0; CT: 109.6 ± 114.0, p < 0.01; CTpan: 94.5 ± 61.3, p < 0.05; CTpnz: 99.8 ± 55.5, p < 0.05), DUSP10 (LE: 12.1 ± 3.6; CT: 15.4 ± 10.3, ns; CTpan: 27.5 ± 20.6, p < 0.001; CTpnz: 18.6 ± 7.4, ns), and DUSP16 (LE: 1.8 ± 0.6; CT: 2.6 ± 1.0, p < 0.05; CTpan: 3.2 ± 1.1, p < 0.01; CTpnz: 2.8 ± 1.1, p < 0.0001) increased. Notably, the expression of both DUSP1 (LE: 40.0 ± 49.8; CT: 18.1 ± 7.9, ns; CTpan: 62.9 ± 26.9, ns; CTpnz: 119.7 ± 114.1, p < 0.001; CT vs CTpan: ns; CT vs CTpnz: p < 0.0001) and DUSP5 (LE: 5.1 ± 3.2; CT: 3.4 ± 2.4, ns; CTpan: 8.0 ± 3.5, ns; CTpnz: 10.3 ± 8.2, p < 0.01; CT vs CTpan: p < 0.01; CT vs CTpnz: p < 0.0001) were initially reduced in CT regions with subsequent induction in regions of tumor necrosis (CTpan and CTpnz; Fig. 4).
Fig. 4.
Differential DUSP expression across the GB tumor microenvironment. The expression of DUSP family across discrete regions of the tumor microenvironment are shown. Data obtained from the Ivy GAP consortium are presented as normalized fragments per kilobase of transcript per million mapped reads (FPKM). Regions of GB biopsy samples including the “normal” leading edge (LE, n = 19), bulk cellular tumor (CT, n = 11), pseudopalisading cells around necrosis (CTpan, n = 40), and perinecrotic zone (CTpnz, n = 26) were identified using ISH panels prior to laser-capture microdissection. “Downregulated/No Change” and “Upregulated in Cellular Tumor” groups include DUSPs with unchanged/decreased or increased expressions in tumor structures (CT, CTpan, CTpnz) relative to “normal” LE tissues, respectively. The “Upregulated in Necrotic Core” group represents DUSPs with increased expression in only necrotic CTpan and CTpnz regions relative to LE. Statistical significance was determined using one-way ANOVA with Bonferroni correction to correct for multiple comparisons (ns = not significant, * = p < 0.05, ** = p < 0.01, *** = p < 0.001, **** = p < 0.0001)
Oxygen-Dependent Expression of DUSP1 in GB
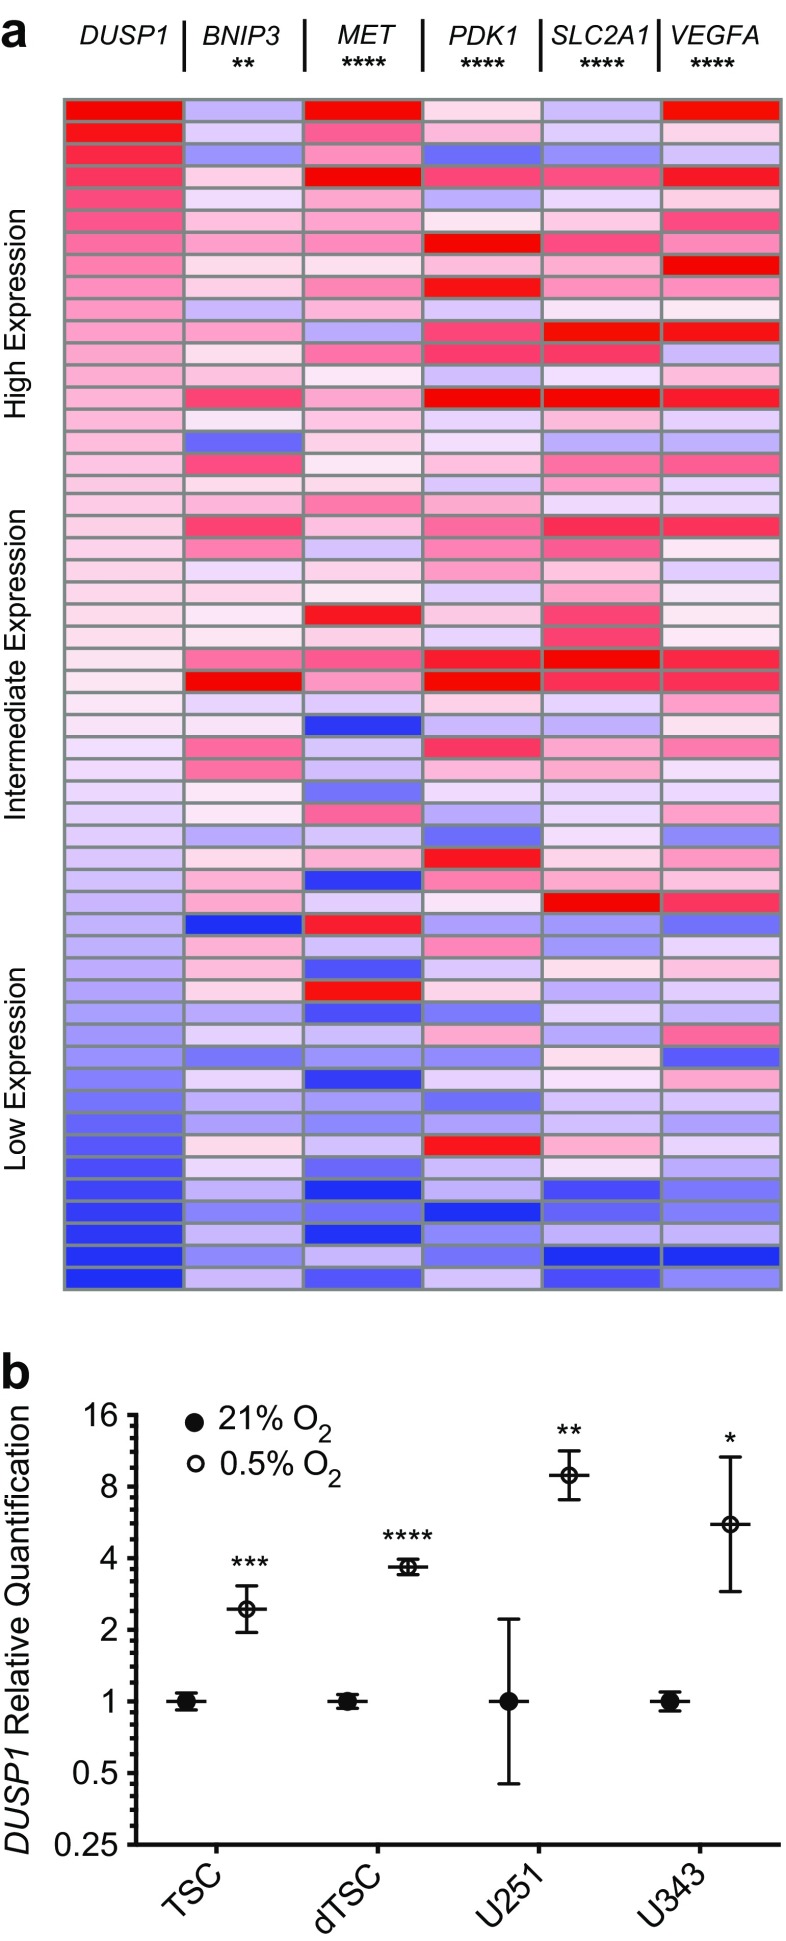
The observed relationship between DUSP1 expression and tumor sub-region argued strongly that ischemia and among other physiological perturbations were driving DUSP responses in situ [15]. To compare DUSP1 regulation against other oxygen-dependent genes, we identified a set of transcriptional targets regulated by the hypoxia-inducible factor 1 alpha (HIF1A). Non-parametric Spearman correlation analyses on microarray data from the Cancer Genome Atlas (TCGA) database (n = 547) [20] revealed that DUSP1 expression matched that of other hypoxia-inducible genes in GB clinical specimens (Fig. 5a). The HIF1A targets analyzed included BNIP3 (r = 0.11, p = 0.009), MET (r = 0.34, p < 0.0001), PDK1 (r = 0.18, p < 0.0001), SLC2A1 (r = 0.21, p < 0.0001), and VEGFA (r = 0.25, p < 0.0001). To confirm hypoxic regulation in vitro, we performed qPCR analyses on tumor-derived cell lines and patient tumor-derived stem cells (TSCs) (Fig. 5b). Results demonstrate that hypoxia stimulated DUSP1 expression in both the U251 (1.00 [+1.22, −0.55] vs. 8.92 [+2.37, −1.87], p < 0.01) and U343 (1.00 [+0.10, −0.09] vs. 5.55 [+5.10, −2.66], p < 0.05) cell lines. Interestingly, while hypoxia-induced DUSP1 transcriptional induction was present in undifferentiated TSCs (TSC: 2.45 [+0.62, −0.49], p < 0.001), the effect was increased five-fold upon TSC differentiation (10.54 [+0.82, −0.6], p < 0.0001).
Fig. 5.
Hypoxia induces DUSP1 in cultured GB tumor cell lines. a Expression heat maps illustrating gene expression profiles for DUSP1, BNIP3, MET, PDK1, SLC2A1, and VEGFA from the TCGA GB microarray dataset (n = 547). For each gene, expression was normalized to the maximum expression values, sorted from max to min DUSP1 expression, and stratified into ten sample bins that are displayed as an average gene expression heatmap. Statistical comparisons between DUSP1 and five HIF1A transcriptional targets were performed using two-tailed, non-parametric Spearman correlation. b qPCR analysis of DUSP1 expression within GB tumor stem cells, serum-differentiated tumor stem cells (dTSCs), and U251/U343 GB cell lines cultured under normoxic (21% O2) or hypoxic (0.5% O2, 24 h) conditions. Data are presented as quantification relative to the average of normoxic controls on a log2 scale (n = 3 per group). Statistical analyses were performed using one-way ANOVA. (* = p < 0.05, ** = p < 0.01, *** = p < 0.001, **** = p < 0.0001)
Chemotherapeutic Induction of DUSP1 in GB Cells
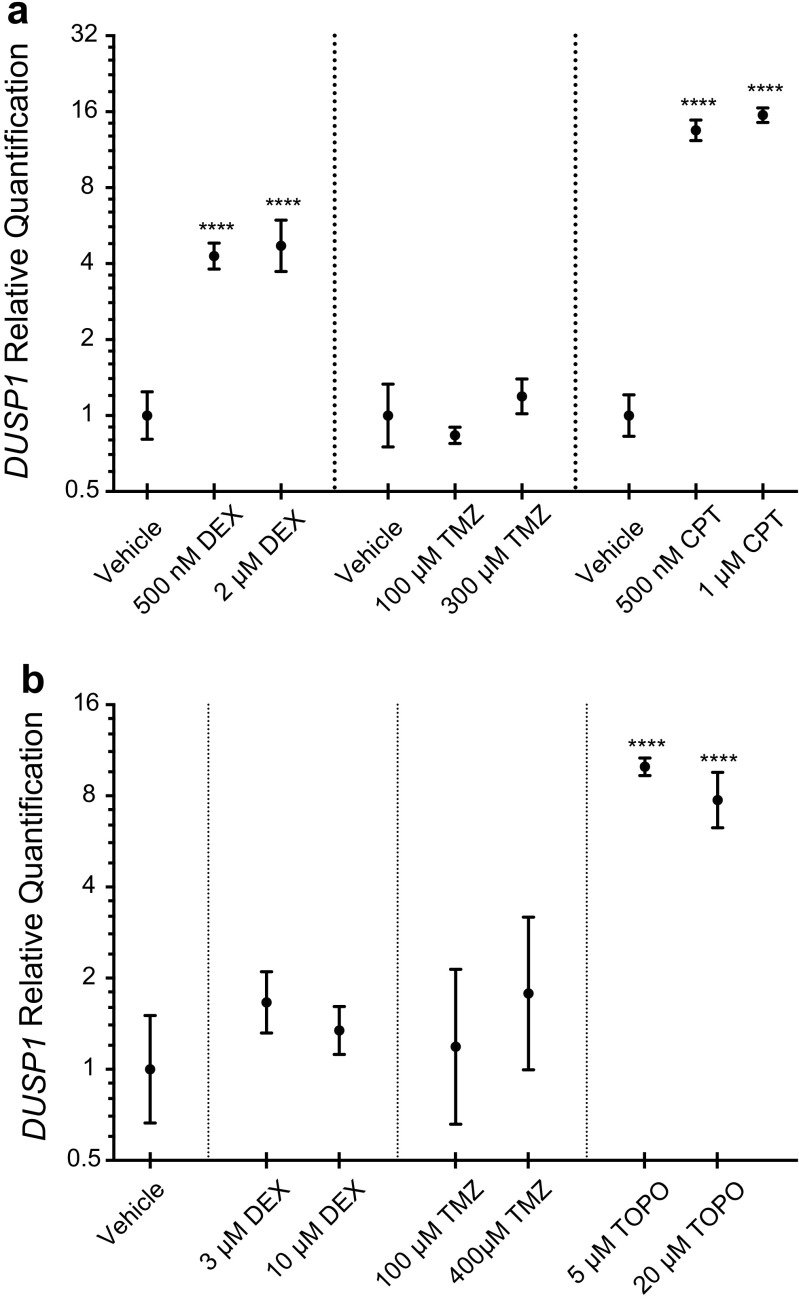
Given the marked variability of DUSP1 expression observed across tumor specimens, we next asked to what extent chemotherapeutic exposure might be involved. To test this, we performed qRT-PCR for DUSP1 in both tumor-derived cell lines and TSCs treated with the first-line agents dexamethasone (DEX) and temozolomide (TMZ), as well as the second-line topoisomerase I inhibitor camptothecin (CPT), and its analog topotecan (TOPO) (Fig. 6a). While the steroid DEX-induced DUSP1 expression in U251 cells relative to control (2μM: 4.71 [+1.24, −0.98], p < 0.0001), a range of TMZ dosing had no discernable effect (1.00 [+0.33, −0.25] vs. 1.19 [+0.21, −0.17], p = 0.233). Induction responses were observed at both doses of CPT (1μM: 15.5 [+1.06, −0.10], p < 0.0001). We also assessed drug effects in undifferentiated, patient-derived TSCs. Unexpectedly, neither TMZ nor DEX had an appreciable effect on mean DUSP1 expression values relative to vehicle controls (400μM TMZ: 1.78 [+1.40, −0.78], p = 0.419; 10μM DEX: 1.34 [+0.27, −0.22], p = 0.523). Conversely, topoisomerase I inhibition remained active, inducing DUSP1 transcription at both doses tested (20μM TOPO: 7.75 [+1.82, −1.47], p < 0.0001) (Fig. 6b).
Fig. 6.
DUSP1 regulation by GB chemotherapeutic agents. U251 and U343 GB cell lines (a) and GB TSCs (b) were treated with the steroid dexamethasone (DEX), or the chemotherapeutics temozolomide (TMZ), camptothecin (CPT), and topotecan (TOPO) for 24 h. Fold-induction responses for DUSP1 gene expression were determined by qPCR analysis relative to vehicle (DMSO) treated controls and are presented on a log2 scale (n = 3 per group). Statistical significance was assessed using one-way ANOVA with Bonferroni correction to account for multiple comparisons (**** = p < 0.0001)
DUSP1 Expression Correlates with Markers of TSC Differentiation
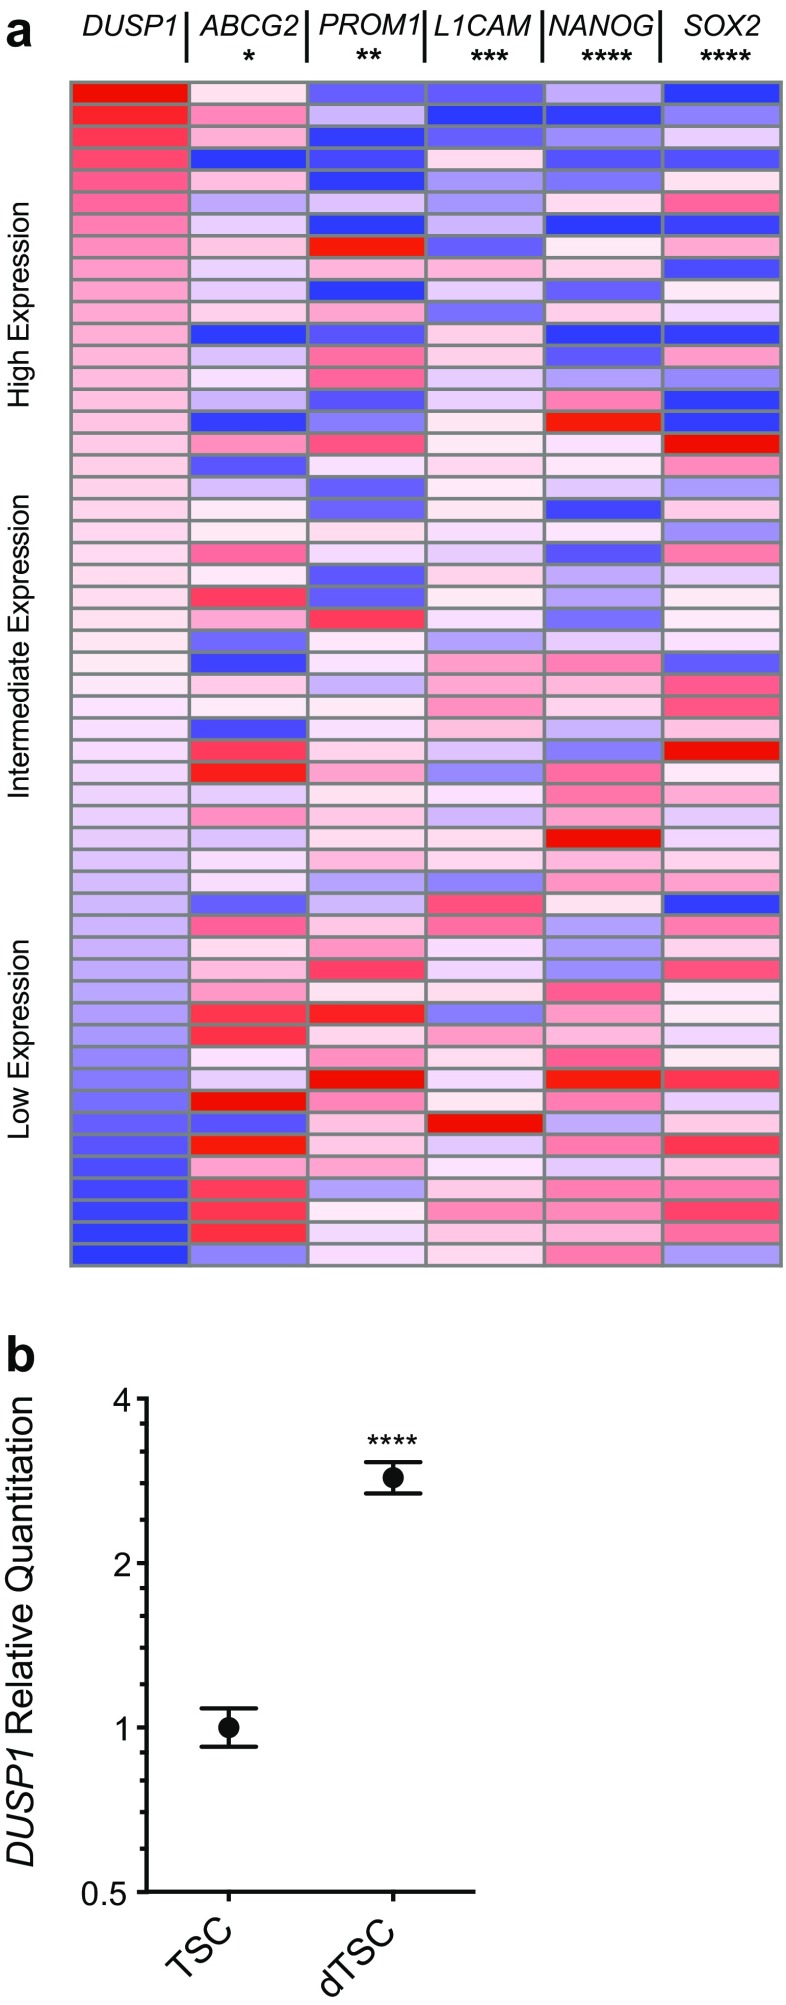
Differentiation induces DUSP1 transcription in pre-adipocytes [22], human embryoid bodies [23], and breast cancer cells [24]. To determine whether the variability in DUSP1 expression observed in clinical GB samples may also reflect the contribution of DUSP1LOW stem cell populations within tumors, we evaluated the relationship between DUSP expression and that of several tumor stem cell markers reported in the TCGA database (Fig. 7a). mRNA levels of the tumor stem cell markers ATP-binding cassette subfamily G member 2 (ABCG2), promonin 1 (PROM1), L1 cell adhesion molecule (L1CAM), Nanog homeobox (NANOG), and SRY-box 2 (SOX2) were extracted and plotted relative to the gradient of DUSP1 mRNA levels across these samples [25–27]. Using non-parametric Spearman correlations, results show an inverse relationship between DUSP1 and each of the TSC markers studied as shown (ABCG2: r = −0.09, p = 0.05; PROM1: r = −0.13, p = 0.003; L1CAM: r = −0.16, p = 0.001; NANOG: r = −0.19, p < 0.0001; SOX2: r = −0.21, p < 0.0001).
Fig. 7.
DUSP1 expression correlates with markers of GB TSC differentiation. a Expression heat maps for DUSP1 and the differentiation markers ABCG2, PROM1, L1CAM, NANOG, and SOX2 in GB samples from the TCGA microarray dataset (n = 547). Gene expression was normalized to the maximum expression values, sorted from max to min DUSP1 expression, and stratified into ten sample bins that are displayed as an average gene expression heatmap. Significance testing was performed using two-tailed, non-parametric Spearman correlation of DUSP1 with the known TSC markers (* = p < 0.05, ** = p < 0.01, *** = p < 0.001, **** = p < 0.0001). b qPCR analysis of DUSP1 expression in a patient-derived GB TSC line cultured for three days in vitro under conditions of serum-based differentiation. Fold induction of DUSP1 are plotted against the Log2 scale for differentiated (dTSC) group relative to undifferentiated stem cells (TSCs; n = 3 per group). Significance testing was performed using a t-test (**** = p < 0.0001)
To directly assess the dependence of DUSP1 expression on differentiation, we induced differentiation in TSC cultures and harvested RNA for qRT-PCR. As expected, TSC differentiation resulted in the downregulation of the stem cell marker SOX2 (5962 A.U. vs. 755 A.U.), and increased expression of mature glial (GLAST1; 43 A.U. vs. 135 A.U.) and neuronal (NEUROD1; 241 A.U. vs. 454 A.U.) markers measured by FACS (Fig. S1) [28, 29]. TSC differentiation was also associated with a reduction in average cell size measured by forward scatter (70,744 A.U. vs. 36,595 A.U.). Notably, qRT-PCR analysis demonstrated increased DUSP1 expression with induced TSC differentiation (1.00 [+0.08, −0.08] vs. 2.87 [+0.20, −0.18], p < 0.0001; Fig. 7b).
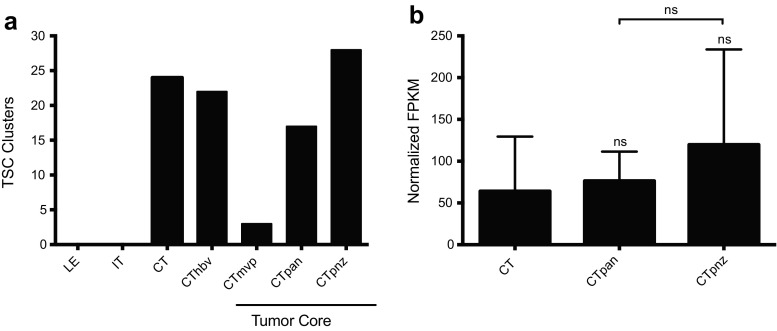
Given the link between DUSP1 and GB TSC maturity, we next asked whether DUSP1 expression correlated with TSC populations in situ. Using the panel of seventeen GB TSC markers from the Ivy GAP protocol, we first established the location of TSC clusters within GB biopsy specimens relative to the standard histological markers (Fig. 8a). As expected, most TSCs were clustered around regions of necrosis, including the CTpan (18%) and CTpnz (30%). Additional foci were identified around microvascular structures including hyperplastic blood vessels (CThbv: 23%) and regions of microvascular proliferation (CTmvp: 3%). The expression of DUSP1 in TSC clusters micro-dissected from CTpan and CTpnz structures were not elevated to a significant degree relative to levels observed in TSC clusters found within the cellular tumor region (CT: 64.11±65.27; CTpan: 76.41±35.01; CTpnz: 119.7±114.1; Fig. 8b).
Fig. 8.
DUSP1 expression in perinecrotic regions within GB tumors. a) Quantification of TSC clusters identified and microdissected per GB subregion (LE = leading edge, IT = infiltrating tumor, CT = cellular tumor, CThbv = hyperplastic blood vessels, CTmvp = microvascular proliferation, CTpan = pseudopalisading cells around necrosis, CTpnz = perinecrotic zone) in Ivy GAP datasets. b DUSP1 RNA-seq data expressed as normalized fragments per kilobase of transcript per million mapped reads (FPKM) were obtained from the Ivy GAP consortium. TSC clusters identified in GB specimens were segmented into discrete tumor sub-regions including bulk cellular tumor (CT, n = 22), pseudopalisading cells around necrosis (CTpan, n = 16) and the perinecrotic zone (CTpnz, n = 26). Statistical analyses were performed using one-way ANOVA using Bonferroni to correct for multiple comparisons (ns = not significant)
Discussion
The purpose of this work was to establish the expression pattern of the family of human dual specificity phosphatases (DUSPs) across primary glioblastoma (GB) samples and to investigate whether the observed changes in one or more DUSPs might serve as a therapeutic target for this devastating condition. Employing a combination of in silico and in vitro approaches, we found that relative to other DUSPs, DUSP1 and DUSP6 exhibited the highest-level expression in normal CNS tissue specimens as well as across a broad range of human GB tumors. Although we noted significant variability between the DUSPs across the tumor microenvironment of clinical specimens, three transcriptional signatures emerged characterized by transcriptional induction (DUSP4 & 6), repression (DUSP2, 7, 8, & 9), and a mixed phenotype (DUSP1, 5, 10, & 16). And in the case of DUSP1, we corroborate these findings in vitro demonstrating the stimulatory effect of hypoxia or several chemotherapeutic drugs on DUSP1 expression. Finally, based on changes observed in our analyses of the IVY Consortium in situ data set, we found that DUSP1 is induced under conditions of TSC differentiation, suggesting that DUSP1 dysregulation may play a role in the maintenance and self-renewal of the stem cell population in GBM tumors.
Our results reveal marked diversity in the basal pattern of Dusp expression across cells comprising the adult mammalian CNS. Unlike the rather broad expression exemplified by other Dusps, expression of Dusp4 & 8 was restricted largely to neurons while Dusp2 was expressed predominantly by microglia. Conversely, analyses revealed that DUSP1 and DUSP6 exhibited broad, high-level expression in both non-transformed CNS tissue and glioblastoma tumor specimens. This is noteworthy considering the distinct and complementary subcellular localization of DUSP1 (nuclear) and DUSP6 (cytoplasmic) and MAPK specificity (JNK, P38, ERK vs. ERK, respectively). While we did not validate Dusp6 expression under basal or stress-induced conditions, these results suggest that DUSP1 & DUSP6 play a dominant role in regulating MAPK signaling and other emergent properties in GB tumors over those conveyed by the remaining DUSP family members.
To explore the transcriptional landscape of DUSP expression in glioblastoma and generate hypotheses regarding DUSP function in this context, we also performed in silico analyses using datasets from several publically available tumor registries. The tumor-suppressive capacities of various DUSP family members including the cytosolic ERK-specific DUSP6 and DUSP9 have been described elsewhere [8]. Similarly, DUSP4 overexpression inhibits colony formation via effects on proliferation in vitro [12]. Although we expected expression to be attenuated through either mutation or epigenetic suppression of the tumor suppressor and transcriptional regulator TP53 [12, 30], DUSP4 mRNA was in fact induced in the majority of registered REMBRANDT samples. Conversely, multiple ERK-specific members including DUSP2, 7, & 9 were downregulated in these analyses. Considering how often activating mutations and overexpression of the EGFR receptor are observed in GB tumors, it is interesting to consider the dramatic effects that loss of one or more DUSPs would have on overall ERK1/2 activity. Given its importance in promoting chemotherapeutic resistance in GB through high affinity, inhibitory effects on JNK activity [11], our observation of high-level DUSP6 expression broadly across the tumor microenvironment seems particularly relevant. And, while other DUSP family members may well influence glioma biology, based on their broad and high-level expression, our data argue that manipulation of both DUSP1 and DUSP6 would likely confer the greatest therapeutic benefit in GB.
We also studied inducible DUSP1 transcription in vitro using both GB cell lines and patient-derived TSCs exposed to hypoxia [15], dexamethasone [16], and DNA damaging agents [31, 32]. While our results confirmed hypoxia and dexamethasone inducibility, we identified that while treatment with the topoisomerase I inhibitors camptothecin (CPT) and topotecan (TOPO) activated DUSP1 transcription, the standard of care DNA alkylating agent temozolomide (TMZ) did not. Why might this be the case? Where CPT and TOPO specifically inhibit the topoisomerase I DNA damage response leaving single and double strand breaks in the phosphodiester backbone, DNA alkylating agents like TMZ rely on defects in the DNA damage response for maximum therapeutic efficacy. TMZ-induced O6 guanine alkylation is reversed under conditions where the O6-methylguanine-DNA-methyltransferase (MGMT) is maximally expressed, which in turn prevents subsequent DNA mismatch repair-mediated cell death [33]. However, methylation-induced repression of the MGMT promoter is present in 40% of GB cases and provides an opportunity for TMZ to extend patient survival by 6.4-months [34, 35]. The lack of a DUSP1 response to TMZ in vitro may reflect insufficient levels of DNA damage induced by this particular chemotherapeutic agent.
The hypoxic core in GB tumors is enriched in cells with stem-like properties including multipotency and the capacity for self-renewal. These cells are also resistant to chemotherapeutic toxicity and likely contribute to secondary tumor recurrence [21]. Reports regarding the relationship between DUSP regulation and the state of cellular differentiation are mixed [22–24]. For example, while DUSP1 is induced in differentiating adipocytes [36], increased ERK1/2 phosphorylation (indicative of low DUSP activity) enhances both the metabolism [37] and differentiation of neural progenitor cells [38]. In other studies, Dusp1 −/− mice exhibit metabolic amplification in response to overactive MAPK signaling [39].
We were particularly interested to understand the potential relationship between DUSP1 regulation and the tumor stem cell niche. First, we found that DUSP1 expression increased in differentiated cultures of patient-derived TCS confirmed using standard markers. Of note, analysis of DUSP1 expression within TSC-rich regions of the tumor microenvironment using the IVY Consortium data set revealed no significant changes between cellular tumor (CT), hypoxic pan necrosis (CTpan), and perinecrotic (CTpnz) regions. Given our observation that average DUSP1 expression was induced within the core region of GBM tumors (Fig. 4), failure to induce DUSP1 within the stem cell niche could reflect either the loss of one or more factors required for transcriptional activation or possibly the persistent expression of a transcriptional repressor. Like DUSP4, DUSP1 is both a transcriptional target of TP53 [31] and an important effector in P53-dependent cell cycle regulation and apoptosis [31, 32]. Notably, loss of dusp1 expression in Tp53 −/− mice results in the upregulation of several genes that promote NSC survival and proliferation [40]. This observation is particularly relevant in the transformed tumor stem cell background since 87% of GB cases harbor aberrations in TP53 activity leading to enhanced TSC self-renewal [41].
While our use of several well characterized cancer genomics datasets was a fruitful platform for generating novel hypotheses regarding the role of DUSP regulation in glioblastoma, the limitations inherent to this approach should be acknowledged. While we have validated the regulation of four DUSP family members in homogenized bulk tumors, further study will be required to determine whether the data from our in silico analyses accurately reflect the pattern of DUSP expression within discrete cells of the mature cortex and regions of the tumor microenvironment. Additionally, our focus on transcriptional responses overlooks the complex interactions across the network of MAPK-DUSP since shifts in DUSP1 protein stability and sub-cellular localization impinge on a wide array of MAPK-dependent processes. For example, growth factor stimulation of the MAPKs by ERK1/2 and p38 leads to increased production of DUSP1 mRNA [42]. ERK1/2-dependent phosphorylation of DUSP1 protein at S359/364 also enhances its turnover via ubiquitin-dependent degradation, a process that is reversed under conditions in which the ubiquitin-proteasome complex is inhibited [43]. However, our ability to study DUSP1 at the protein level is impeded by the lack of reliable DUSP1 antisera capable of distinguishing total from modified forms DUSP1 from other members of the DUSP family (data not shown).
In conclusion, we present results from a systematic analysis of DUSP family mRNA expression in glioblastoma multiforme. While our initial interrogation of DUSP expression revealed uniform trends for several factors, signals for others including DUSP1 were mixed and otherwise obscured by signal averaging in homogenized bulk tumor specimens. Using a complementary in silico approach, we found DUSP1 exhibited marked heterogeneity in expression across the tumor microenvironment. Subsequent analyses performed in vitro identified several potential mediators of DUSP1 inducibility including hypoxic stress as well as exposure several clinically relevant chemotherapeutic agents. We also demonstrate that DUSP1, along with other traditional markers, is induced in differentiated, patient-derived tumor stem cells. Analyses of cancer stem cell RNA-Seq data derived from primary glial tumors suggest a failure to induceDUSP1 expression in regions of significant intratumoral stress. And although not directly tested here, our findings argue that approaches geared towards reactivating DUSP1 expression in situ may render this otherwise refractory cell population sensitive to therapeutic intervention.
Electronic supplementary material
Characterization of GB TSC differentiation. Flow cytometry contour plots (a) and geometric mean histogram representations (b) of primitive TSCs (red) and 3-day serum-differentiated dTSCs (blue) for expression of the stem cell marker SOX2, mature glial marker GLAST1, and mature neuronal marker NEUROD1 (n = 1). (GIF 132 kb)
Acknowledgments
This project was funded by awards from the National Institutes of Health to Marc W. Halterman (R01-NS076617) and Bradley N. Mills (F31-CA180358).
Abbreviations
- DUSP1
Dual specificity phosphatase 1
- GB
Glioblastoma
- TSC
Tumor stem cell
- DEX
Dexamethasone
- CPT
Camptothecin
- LE
Leading edge
- CT
Bulk cellular tumor
- CTpan
Cellular tumor pseudopalisading around necrosis
- CTpnz
Cellular tumor perinecrotic zone
Footnotes
Electronic supplementary material
The online version of this article (doi:10.1007/s12307-017-0197-6) contains supplementary material, which is available to authorized users.
References
- 1.Rong Y, et al. 'Pseudopalisading' necrosis in glioblastoma: a familiar morphologic feature that links vascular pathology, hypoxia, and angiogenesis. J Neuropathol Exp Neurol. 2006;65(6):529–539. doi: 10.1097/00005072-200606000-00001. [DOI] [PubMed] [Google Scholar]
- 2.Persano L, et al. The three-layer concentric model of glioblastoma: cancer stem cells, microenvironmental regulation, and therapeutic implications. Sci World J. 2011;11:1829–1841. doi: 10.1100/2011/736480. [DOI] [PMC free article] [PubMed] [Google Scholar]
- 3.Vartanian A, et al. GBM's multifaceted landscape: highlighting regional and microenvironmental heterogeneity. Neuro-Oncology. 2014;16(9):1167–1175. doi: 10.1093/neuonc/nou035. [DOI] [PMC free article] [PubMed] [Google Scholar]
- 4.Li Z, et al. Hypoxia-inducible factors regulate tumorigenic capacity of glioma stem cells. Cancer Cell. 2009;15(6):501–513. doi: 10.1016/j.ccr.2009.03.018. [DOI] [PMC free article] [PubMed] [Google Scholar]
- 5.Li Z et al. (2009) Hypoxia-inducible factors regulate tumorigenic capacity of glioma stem cells. In: Cancer Cell. Elsevier Ltd. p 501–513 [DOI] [PMC free article] [PubMed]
- 6.Vitucci M, et al. Cooperativity between MAPK and PI3K signaling activation is required for glioblastoma pathogenesis. Neuro-Oncology. 2013;15(10):1317–1329. doi: 10.1093/neuonc/not084. [DOI] [PMC free article] [PubMed] [Google Scholar]
- 7.Raman M, Chen W, Cobb MH. Differential regulation and properties of MAPKs. Oncogene. 2007;26(22):3100–3112. doi: 10.1038/sj.onc.1210392. [DOI] [PubMed] [Google Scholar]
- 8.Boutros T, Chevet E, Metrakos P. Mitogen-activated protein (MAP) kinase/MAP kinase phosphatase regulation: roles in cell growth, death, and cancer. Pharmacol Rev. 2008;60(3):261–310. doi: 10.1124/pr.107.00106. [DOI] [PubMed] [Google Scholar]
- 9.De Witt Hamer PC. Small molecule kinase inhibitors in glioblastoma: a systematic review of clinical studies. Neuro-Oncology. 2010;12(3):304–316. doi: 10.1093/neuonc/nop068. [DOI] [PMC free article] [PubMed] [Google Scholar]
- 10.Yu H, et al. Constitutive expression of MAP kinase phosphatase-1 confers multi-drug resistance in human glioblastoma cells. Cancer Res Treat. 2012;44(3):195–201. doi: 10.4143/crt.2012.44.3.195. [DOI] [PMC free article] [PubMed] [Google Scholar]
- 11.Messina S, et al. Dual-specificity phosphatase DUSP6 has tumor-promoting properties in human glioblastomas. Oncogene. 2011;30(35):3813–3820. doi: 10.1038/onc.2011.99. [DOI] [PubMed] [Google Scholar]
- 12.Waha A, et al. Epigenetic downregulation of mitogen-activated protein kinase phosphatase MKP-2 relieves its growth suppressive activity in glioma cells. Cancer Res. 2010;70(4):1689–1699. doi: 10.1158/0008-5472.CAN-09-3218. [DOI] [PubMed] [Google Scholar]
- 13.Wayne J, et al. ERK regulation upon contact inhibition in fibroblasts. Mol Cell Biochem. 2006;286(1–2):181–189. doi: 10.1007/s11010-005-9089-z. [DOI] [PubMed] [Google Scholar]
- 14.Sakaue H, et al. Role of MAPK phosphatase-1 (MKP-1) in adipocyte differentiation. J Biol Chem. 2004;279(38):39951–39957. doi: 10.1074/jbc.M407353200. [DOI] [PubMed] [Google Scholar]
- 15.Laderoute KR, et al. Mitogen-activated protein kinase phosphatase-1 (MKP-1) expression is induced by low oxygen conditions found in solid tumor microenvironments. A candidate MKP for the inactivation of hypoxia-inducible stress-activated protein kinase/c-Jun N-terminal protein kinase activity. J Biol Chem. 1999;274(18):12890–12897. doi: 10.1074/jbc.274.18.12890. [DOI] [PubMed] [Google Scholar]
- 16.Lin YM, et al. Dexamethasone reduced invasiveness of human malignant glioblastoma cells through a MAPK phosphatase-1 (MKP-1) dependent mechanism. Eur J Pharmacol. 2008;593(1–3):1–9. doi: 10.1016/j.ejphar.2008.06.111. [DOI] [PubMed] [Google Scholar]
- 17.Scarpace L et al. (2015) Data from REMBRANDT. The Cancer Imaging Archive. Available from: https://doi.org/10.7937/K9/TCIA.2015.588OZUZB
- 18.Zhang Y, et al. An RNA-sequencing transcriptome and splicing database of glia, neurons, and vascular cells of the cerebral cortex. J Neurosci. 2014;34(36):11929–11947. doi: 10.1523/JNEUROSCI.1860-14.2014. [DOI] [PMC free article] [PubMed] [Google Scholar]
- 19.Ivy (2015) Ivy Glioblastoma Atlas Project Available from: http://glioblastoma.alleninstitute.org/rnaseq
- 20.NCI (2015) The cancer genome atlas; Available from: https://www.cancer.gov/
- 21.Galli R, et al. Isolation and characterization of tumorigenic, stem-like neural precursors from human glioblastoma. Cancer Res. 2004;64(19):7011–7021. doi: 10.1158/0008-5472.CAN-04-1364. [DOI] [PubMed] [Google Scholar]
- 22.Inuzuka H, et al. Differential regulation of immediate early gene expression in preadipocyte cells through multiple signaling pathways. Biochem Biophys Res Commun. 1999;265(3):664–668. doi: 10.1006/bbrc.1999.1734. [DOI] [PubMed] [Google Scholar]
- 23.Sahu M, Mallick B. An integrative approach predicted co-expression sub-networks regulating properties of stem cells and differentiation. Comput Biol Chem. 2016;64:250–262. doi: 10.1016/j.compbiolchem.2016.07.006. [DOI] [PubMed] [Google Scholar]
- 24.Boulding T, et al. Differential roles for DUSP family members in epithelial-to-mesenchymal transition and cancer stem cell regulation in breast cancer. PLoS One. 2016;11(2):e0148065. doi: 10.1371/journal.pone.0148065. [DOI] [PMC free article] [PubMed] [Google Scholar]
- 25.Bleau AM, Huse JT, Holland EC. The ABCG2 resistance network of glioblastoma. Cell Cycle. 2009;8(18):2936–2944. doi: 10.4161/cc.8.18.9504. [DOI] [PubMed] [Google Scholar]
- 26.Hjelmeland AB, et al. Twisted tango: brain tumor neurovascular interactions. Nat Neurosci. 2011;14(11):1375–1381. doi: 10.1038/nn.2955. [DOI] [PMC free article] [PubMed] [Google Scholar]
- 27.Bradshaw A, et al. Cancer stem cell hierarchy in glioblastoma Multiforme. Front Surg. 2016;3:21. doi: 10.3389/fsurg.2016.00021. [DOI] [PMC free article] [PubMed] [Google Scholar]
- 28.Martinez-Lozada Z, et al. Activation of sodium-dependent glutamate transporters regulates the morphological aspects of oligodendrocyte maturation via signaling through calcium/calmodulin-dependent kinase IIbeta's actin-binding/−stabilizing domain. Glia. 2014;62(9):1543–1558. doi: 10.1002/glia.22699. [DOI] [PMC free article] [PubMed] [Google Scholar]
- 29.Roybon L, et al. Neurogenin2 directs granule neuroblast production and amplification while NeuroD1 specifies neuronal fate during hippocampal neurogenesis. PLoS One. 2009;4(3):e4779. doi: 10.1371/journal.pone.0004779. [DOI] [PMC free article] [PubMed] [Google Scholar]
- 30.Shen WH, et al. Mitogen-activated protein kinase phosphatase 2: a novel transcription target of p53 in apoptosis. Cancer Res. 2006;66(12):6033–6039. doi: 10.1158/0008-5472.CAN-05-3878. [DOI] [PubMed] [Google Scholar]
- 31.Li M, et al. The phosphatase MKP1 is a transcriptional target of p53 involved in cell cycle regulation. J Biol Chem. 2003;278(42):41059–41068. doi: 10.1074/jbc.M307149200. [DOI] [PubMed] [Google Scholar]
- 32.Liu YX, et al. DUSP1 is controlled by p53 during the cellular response to oxidative stress. Mol Cancer Res. 2008;6(4):624–633. doi: 10.1158/1541-7786.MCR-07-2019. [DOI] [PubMed] [Google Scholar]
- 33.Lord CJ, Ashworth A. The DNA damage response and cancer therapy. Nature. 2012;481(7381):287–294. doi: 10.1038/nature10760. [DOI] [PubMed] [Google Scholar]
- 34.Esteller M, et al. Inactivation of the DNA-repair gene MGMT and the clinical response of gliomas to alkylating agents. N Engl J Med. 2000;343(19):1350–1354. doi: 10.1056/NEJM200011093431901. [DOI] [PubMed] [Google Scholar]
- 35.Hegi ME, et al. MGMT gene silencing and benefit from temozolomide in glioblastoma. N Engl J Med. 2005;352(10):997–1003. doi: 10.1056/NEJMoa043331. [DOI] [PubMed] [Google Scholar]
- 36.Ferguson BS, et al. Mitogen-dependent regulation of DUSP1 governs ERK and p38 signaling during early 3T3-L1 adipocyte differentiation. J Cell Physiol. 2016;231(7):1562–1574. doi: 10.1002/jcp.25248. [DOI] [PMC free article] [PubMed] [Google Scholar]
- 37.Kim DY, Rhee I, Paik J. Metabolic circuits in neural stem cells. Cell Mol Life Sci. 2014;71(21):4221–4241. doi: 10.1007/s00018-014-1686-0. [DOI] [PMC free article] [PubMed] [Google Scholar]
- 38.Li Z, Theus MH, Wei L. Role of ERK 1/2 signaling in neuronal differentiation of cultured embryonic stem cells. Develop Growth Differ. 2006;48(8):513–523. doi: 10.1111/j.1440-169X.2006.00889.x. [DOI] [PubMed] [Google Scholar]
- 39.Wu JJ, et al. Mice lacking MAP kinase phosphatase-1 have enhanced MAP kinase activity and resistance to diet-induced obesity. Cell Metab. 2006;4(1):61–73. doi: 10.1016/j.cmet.2006.05.010. [DOI] [PubMed] [Google Scholar]
- 40.Meletis K, et al. p53 suppresses the self-renewal of adult neural stem cells. Development. 2006;133(2):363–369. doi: 10.1242/dev.02208. [DOI] [PubMed] [Google Scholar]
- 41.Cancer Genome Atlas Research, N Comprehensive genomic characterization defines human glioblastoma genes and core pathways. Nature. 2008;455(7216):1061–1068. doi: 10.1038/nature07385. [DOI] [PMC free article] [PubMed] [Google Scholar]
- 42.Li J, et al. Transcriptional induction of MKP-1 in response to stress is associated with histone H3 phosphorylation-acetylation. Mol Cell Biol. 2001;21(23):8213–8224. doi: 10.1128/MCB.21.23.8213-8224.2001. [DOI] [PMC free article] [PubMed] [Google Scholar]
- 43.Brondello J. Reduced MAP kinase phosphatase-1 degradation after p42/p44MAPK-dependent phosphorylation. Science. 1999;286(5449):2514–2517. doi: 10.1126/science.286.5449.2514. [DOI] [PubMed] [Google Scholar]
Associated Data
This section collects any data citations, data availability statements, or supplementary materials included in this article.
Supplementary Materials
Characterization of GB TSC differentiation. Flow cytometry contour plots (a) and geometric mean histogram representations (b) of primitive TSCs (red) and 3-day serum-differentiated dTSCs (blue) for expression of the stem cell marker SOX2, mature glial marker GLAST1, and mature neuronal marker NEUROD1 (n = 1). (GIF 132 kb)


