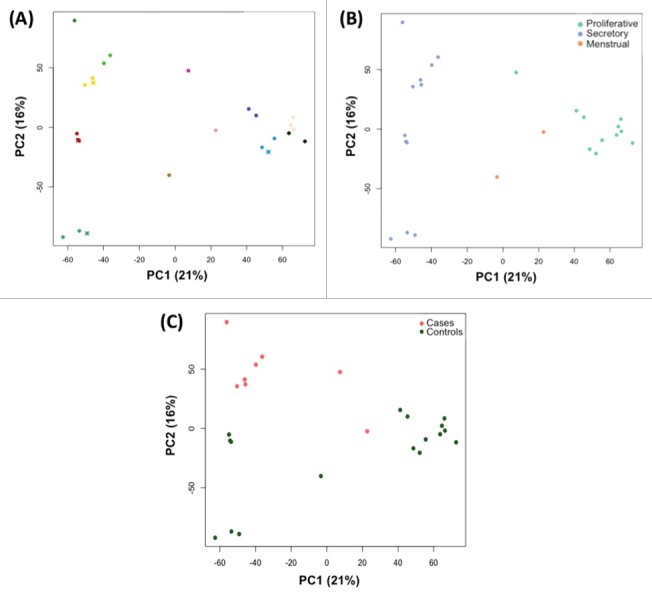
Figure 3.

PCA analysis of RNA profiles in endometrium, showing total variation in profiles explained between PC1 and PC2. Each circle represents a sample; color coding designates (A) individual woman [same color circles represent the sample splits and crosses (x) indicate technical replicates]; (B) menstrual phase according to calculated cycle day based on self-reported LMP; (C) case/control status.
