

Abstract
Cerebral ischemia entails rapid tissue damage in the affected brain area causing devastating neurological dysfunction. How each component of the neurovascular unit contributes or responds to the ischemic insult in the context of the human brain has not been solved yet. Thus, the analysis of the proteome is a straightforward approach to unraveling these cell proteotypes. In this study, post-mortem brain slices from ischemic stroke patients were obtained corresponding to infarcted (IC) and contralateral (CL) areas. By means of laser microdissection, neurons and blood brain barrier structures (BBB) were isolated and analyzed using label-free quantification. MS data are available via ProteomeXchange with identifier PXD003519. Ninety proteins were identified only in neurons, 260 proteins only in the BBB and 261 proteins in both cell types. Bioinformatics analyses revealed that repair processes, mainly related to synaptic plasticity, are outlined in microdissected neurons, with nonexclusive important functions found in the BBB. A total of 30 proteins showing p < 0.05 and fold-change> 2 between IC and CL areas were considered meaningful in this study: 13 in neurons, 14 in the BBB and 3 in both cell types. Twelve of these proteins were selected as candidates and analyzed by immunohistofluorescence in independent brains. The MS findings were completely verified for neuronal SAHH2 and SRSF1 whereas the presence in both cell types of GABT and EAA2 was only validated in neurons. In addition, SAHH2 showed its potential as a prognostic biomarker of neurological improvement when analyzed early in the plasma of ischemic stroke patients. Therefore, the quantitative proteomes of neurons and the BBB (or proteotypes) after human brain ischemia presented here contribute to increasing the knowledge regarding the molecular mechanisms of ischemic stroke pathology and highlight new proteins that might represent putative biomarkers of brain ischemia or therapeutic targets.
Stroke is currently a leading cause of death and disability worldwide. Ischemic stroke represents ∼85% of all stroke cases and is characterized by the impairment of blood flow to a specific region of the brain parenchyma caused by the occlusion of a cerebral artery (1). During ischemia, a complex cascade of events is triggered by the lack of oxygen and nutrient supply. This process includes an increase in excitotoxicty and oxidative stress, an exacerbated inflammatory response and the disruption of the blood-brain barrier (BBB)1. Finally, rapid cell death and tissue injury lead to a loss of neurological function (2).
Prompter and more accurate diagnosis of stroke relies mainly on neuroimaging and is essential for prescribing the most adequate primary treatment, currently based on reperfusion strategies (3, 4). Although effective, these therapies are given to a small number of ischemic stroke patients, because of their narrow therapeutic window and some contraindications. Besides, and unfortunately, neuroprotective therapies have systematically failed when tried in a real clinical setting (5); thus, new therapeutic targets are still needed for stroke patients. In relation to diagnosis, despite their relatively wide availability, neuroimaging devices are not easily accessible in certain scenarios such as primary healthcare centers, pre-hospital settings or developing countries. The use of molecular biomarkers to rapidly distinguish ischemic stroke from other neurological disorders represents a plausible and affordable tool, especially in those situations (6, 7). Besides, stroke biomarkers have also shown evidence of their potential usefulness at other management stages of stroke patients such as the evaluation of poststroke prognosis and complications (8, 9).
During recent years, the identification of multiple proteins related to the mechanisms underlying brain ischemia has been boosted by the development of new proteomic approaches (10). Most of these approaches are based on the examination of body fluids such as serum, plasma or cerebrospinal fluid. However, the exploration of protein dynamic changes directly in the injured tissue might aid in unraveling new pathophysiological processes allowing the discovery of potential therapeutic targets and new putative biomarkers after the translation of these alterations from tissue to biological fluids (11–13). Following this reasoning, cerebral tissue homogenates have been examined in the context of ischemia in human samples (14, 15) and in stroke experimental models (16, 17). However, when tissue homogenates are analyzed only global changes in the protein expression profile can be identified and the alterations in protein expression at a particular cellular level are not considered. Following a cell isolation approach based on laser microdissection (LMD), our group previously described ischemia-related changes in matrix metalloproteinase (18) and in chemokine (19) expression profiles in neurons and vascular cells dissected from human brain parenchyma.
The main aim of the present study was to define the quantitative proteome of different components of the neurovascular unit after ischemic stroke (or the proteotypes of brain cell types after ischemia), following an approach that couples LMD and label-free MS quantification. As a secondary objective, we tested the performance of validated proteins for use as diagnostic or prognostic blood biomarkers for stroke.
EXPERIMENTAL PROCEDURES
Experimental Design and Statistical Rationale
This study was divided into two main parts: a first discovery and validation experiment in human brain samples and a second pilot exploration of some brain biomarker candidates in blood samples from stroke patients. Details about demographics, sample size and the internal controls considered in each experiment are given below together with a complete explanation regarding the statistical analyses performed in each step.
Individuals and Sample Collection
Human Brain Tissue Samples
Twelve patients who died because of an ischemic stroke were included in this study, based on the availability of specimens in our brain tissue collection. Briefly, postmortem tissue samples from the infarct core (IC) and the contralateral (CL) areas were collected within the first hours after death by an experienced neuropathologist supported by computed tomography imaging. Similar specimens of ∼2 cm2, 1 cm thick were preserved either immediately by snap freezing in liquid nitrogen or fixed for 24 h with 4% paraformaldehyde (PFA) at 4 °C followed by 24 h sucrose dehydration at 4 °C; afterward, in both cases samples were stored at −80 °C until use. Brain tissue from the IC and CL areas was also collected after being fixed into 10% buffered formalin for 3 weeks and embedded in paraffin blocks. Table I shows the demographic and clinical data of the patients as well as the phase of the study in which each sample was employed.
Table I. Demographic and clinical data from patients included in the brain tissue study. Brain samples were obtained from both infarcted core (IC) and healthy contralateral (CL) areas. rt-PA: recombinant tissue-plasminogen activator; T-O-D: time from onset of stroke symptoms to death; PMI: postmortem interval (from death to brain samples collection); BBB: blood-brain barrier structures; IHF: immunohistofluorescence.
| Patient number | Sex | Age (years) | Lesion location (hemisphere) | rt-PA treatment | T-O-D (h) | PMI (h) | Necropsy collection (year) | Included in MS analysis |
Included in IHF analysis | |
|---|---|---|---|---|---|---|---|---|---|---|
| Neurons | BBB | |||||||||
| N 12 | Female | 77 | Left | Yes | 72 | 4 | 2005 | X | ||
| N 15 | Male | 72 | Right | No | 13 | 3 | 2005 | X | ||
| N 16 | Female | 79 | Left | No | 88 | 5 | 2005 | X | X | |
| N 19 | Female | 50 | Left | Yes | >120 | 9 | 2006 | X | ||
| N 22 | Male | 67 | Left | Yes | 62 | 7 | 2007 | X | ||
| N 24 | Female | 83 | Left | Yes | 100 | 14.5 | 2007 | X | ||
| N 29 | Female | 92 | Right | No | 67 | 25 | 2007 | X | ||
| N 32 | Male | 73 | Left | No | 360 | 6 | 2008 | X | ||
| N 33 | Male | 80 | Right | No | 100 | 4.5 | 2009 | X | X | |
| N 35 | Male | 84 | Left | No | 40 | 8 | 2009 | X | X | |
| N 36 | Female | 73 | Left | Yes | 44 | 4 | 2010 | X | X | |
| N 38 | Male | 75 | Left | Yes | 19 | 5 | 2011 | X | ||
Blood Samples
All included patients were consecutively admitted into the emergency department of the Vall d'Hebron University Hospital (Barcelona, Spain) from December 2013 to August 2014 within the first 6 h after neurological symptoms onset and with stroke suspicion. On admission, all patients underwent a standardized protocol of brain imaging for the differential diagnosis of ischemic stroke or stroke-mimicking conditions. Trained neurologists performed a neurological severity assessment by means of the National Institutes of Health Stroke Scale (NIHSS), functional state assigned using the modified Rankin scale (mRS) and etiological classification following the TOAST definitions (20) and demographic and clinical data were also obtained. When eligible, ischemic stroke patients received the standard thrombolytic treatment [intravenous 0.9 mg/Kg recombinant tissue-plasminogen activator (rt-PA)] and/or mechanical thrombectomy to remove the arterial clot.
Peripheral blood samples were drawn on admission and always before any treatment was administered. EDTA plasma and serum were separated by centrifugation at 1500 × g for 15 min at 4 °C and aliquots were stored at −80 °C until use. From this codified blood collection, and based on sample availability, 45 ischemic stroke patients and 13 patients with stroke-mimicking conditions were retrospectively selected. Additionally, 8 subjects free of brain lesions from the ISSYS cohort (21) were also included as controls.
Ethics Statement
The ethical committee of Vall d'Hebron Hospital approved all studies (brain - PR[HG]85/2004 - and blood - PR[AG]157/2011 and PR[IR]87/2010 - sampling) and written informed consent was obtained from all subjects or relatives in accordance with the Declaration of Helsinki.
Laser Microdissection (LMD)
Henceforth, all materials were purchased from Sigma-Aldrich (Saint Louis, MO) unless the contrary is stated.
Snap frozen brain samples were embedded in Tissue-Tek OCT (Sakura Finetek, Torrance, CA) to be cut into 10 μm-thick sections using a HM505E cryostat (Microm International GmbH, Walldorf, Germany). Sections were mounted onto ultraviolet-irradiated 2 μm polyethylene naphthalate membrane slides (MicroDissect GmbH, Herborn, Germany) and stored at −80 °C for less than 1 week with silica desiccant pads.
Rapid fluorescence detection of brain structures was performed following the procedure previously described (18). Neurons were immunostained using a mouse anti-neuronal nuclei antibody (NeuN, 1:50; cat.#: MAB377, Millipore, Burlington, MA) and a secondary anti-mouse antibody (AlexaFluor®568, 1:50; cat.#: A11004, Invitrogen, Carlsbad, CA) whereas endothelial cells from brain microvessels were stained using a FITC conjugated Ulex europaeus agglutinin I (UEA-I, 1:20; cat.#: L9006). Immediately after staining, LMD was performed on individual cells, either neuronal bodies or BBB structures. The term “BBB structures” is used instead of “endothelial cells” because astrocytes' end-feet and pericytes are closely related to endothelial cells and as a result brain microvasculature cannot be completely isolated (22, 23). The 20× objective of a LMD6000 microscope (Leica Microsystem, Wetzlar, Germany) was used to dissect the cells in a contact-free manner into dry 0.65 ml tube caps (Sorenson BioScience, Murray, UT) at a power of 45 KW, an aperture of 11 and a speed of 14 ns for a maximum of 4.5 h. Approximate total areas of 106 μm2 for neurons (∼2500 cells) and BBB (∼4000 units) were collected from both IC and CL areas in 60 μl of 0.1% Rapigest surfactant (Waters, Milford, MA) in 0.1 m triethylammonium bicarbonate (TEAB). Samples were sonicated on ice at 70% amplitude for intervals of 10 s for a total of 2 min and stored at −80 °C until use. An equivalent area of polyethylene naphthalate membrane pieces without brain tissue was also dissected as a negative control.
Proteomics Analysis
Sample Preparation
A total of 30 μl of each sample enriched in human neurons or BBB structures were reduced with 2 μl freshly prepared 50 mm Tris(2-carboxyethyl)phosphine (TCEP) for 1 h at 60 °C, alkylated with 1 μl freshly prepared 400 mm iodoacetamide (IAA) for 30 min at room temperature under agitation in the dark, and finally digested with 2 μl 0.05 μg/μl trypsin (Promega, Madison, WI) in 0.1 m TEAB overnight at 37 °C. Afterward, Rapigest was removed from the preparation by precipitation with 20 μl 3.5% TFA for 1 h at 37 °C. The same process was followed for LMD negative control samples. All samples were centrifuged for 20 min at 13,000 × g and supernatants were dried under vacuum. Samples were solubilized in 300 μl 5% ACN 0.1% formic acid (FA), purified using microspin C18 columns (Harvard Apparatus, Cambridge, MA) according to the manufacturer's instructions and dried again under vacuum. Lyophilized samples were solubilized in 20 μl 5% ACN 0.1% FA, centrifuged for 5 min at 14,000 × g, transferred to a sample vial and frozen at −20 °C until use.
LC-MS/MS Analysis
LMD samples were analyzed by LC-ESI-MS/MS on a linear trap quadrupole (LTQ) Orbitrap Velos Pro (Thermo Fisher Scientific, Waltham, MA) equipped with a NanoAcquity UPLC system (Waters). A total of 4 injections (4 μl each) per sample were performed. Peptides were trapped on a home-made 5 μm 200 Å Magic C18 AQ 0.1 × 20 mm pre-column (Unichrom Scientific, Taipei city, PR China) and separated on a commercial 0.075 × 150 mm 5 μm 100 Å C18 analytical nanocolumn (Nikkyo Technos Co., Ltd, Tokyo, Japan). The analytical separation was performed using a gradient of H2O/FA 99.9%/0.1% (solvent A) and ACN/FA 99.9%/0.1% (solvent B) as follows: 0–1 min 95% A and 5% B, then to 65% A and 35% B in 54 min, then to 20% A and 80% B in 10 min, then stay 2 min at 20% A and 80% B, then back to 95% A and 5% B in 2 min and finally re-equilibrate at 95% A and 5% B for 16 min. The flow rate was always of 220 nL/min for a total run time of 85 min.
For MS survey scans, the Orbitrap resolution was set to 60,000 and the ion population was set to 5 × 10⁵. Up to five precursor ions were selected for CID in the LTQ. The ion population was set to 104 with an isolation width of 2 m/z. The normalized collision energies were set to 35% for CID. Gas phase fractionation (GPF) (24) was performed using four mass ranges for data-dependent MS/MS selection. The GPF ranges were the following: 400–520 m/z; 515–690 m/z; 685–979 m/z and 974–2000 m/z.
Complete MS raw data have been uploaded to the ProteomeXchange Consortium through the PRIDE repository (25) with data identifiers PXD003519 and 10.6019/PXD003519. Furthermore, protein and peptide identifications in both neurons and the BBB are provided as supplemental Data S1.
Protein Quantification and Identification
Progenesis® QI for proteomics software v3.0 (Nonlinear dynamics, Newcastle upon Tyne, UK) was used for MS data analysis using default settings. In this study, neuron and BBB samples were considered as independent experiments and were analyzed separately. Each GPF range was analyzed independently and all MS runs were automatically aligned to an automatically selected reference sample with manual supervision and they were automatically normalized to all features. Only nonconflicting features within the 400 to 1500 m/z range, 20 to 80 min retention time and with positive charges between 2 to 7 were considered for identification and quantification. Peak lists were generated by Progenesis and analyzed using the Mascot search engine (v2.2, Matrix Science, London, UK). Protein identification was carried out using the SwissProt-human database (2017_01: 20,171 entries), setting precursor mass tolerance to 10 ppm and fragment mass tolerance to 0.6 Da. Oxidized methionine was considered as variable amino acid modification and carbamidomethylation of cysteines as fixed modification. Trypsin was selected as the enzyme allowing up to one missed cleavage. Significant threshold for protein identification was set to p < 0.05 for the probability-based Mascot score and at least 2 spectra per peptide.
Finally, the four GPF fractions were combined into one single Progenesis experiment. Label-free protein abundance quantification was based on the sum of the peak areas within the isotope boundaries of peptide ion peaks. To allow comparison across different sample runs, the abundance of each protein was normalized to all proteins. All proteins showed a coefficient of variation (CV) in their abundance higher than 20% across biological replicates (i.e. IC and CL all together for each protein). Thus, all proteins were analyzed with a paired parametric statistical test, comparing IC and CL areas in both neuron and BBB experiments. Only those proteins quantified and identified with at least 2 unique peptides, a p value <0.05 and a fold-change > 2 were considered meaningful for further analyses. Fold-change was calculated by dividing the highest mean normalized protein abundance by the lowest mean normalized protein abundance. We added a minus sign (-) when the highest abundance was found in CL area to indicate that protein levels were lower in the IC area. Furthermore, false discovery rate (FDR) using the Benjamini-Hochberg procedure was calculated accounting all proteins identified with at least 2 unique peptides, for each dataset (R software (3.3.2, R development core team 2012; Austria), multtest R package).
Bioinformatics Analysis
Proteins identified with at least 2 unique peptides in neurons and BBB experiments were analyzed separately through core analyses using Qiagen's Ingenuity® Pathway Analysis (IPA, Qiagen, Hilden, Germany). Default settings were used but different background IPA Knowledge Bases were selected for each cell type. IPA contents of the central nervous system and neurons were selected in the case of neurons, whereas central nervous system, endothelial cells, astrocytes and vascular smooth muscle cells were exclusively selected for BBB analysis. In both cases, a filter of p value <0.05 and fold-change > 2 for the IC versus CL comparison was applied to highlight key proteins through the IPA outputs. Protein identifiers were mapped into the IPA Knowledge Base to identify connectivity networks, biological functions and canonical pathways in which foremost proteins in neurons and/or the BBB are relevant in stroke setting. To that end, overlap p values were calculated by right-tailed Fisher's exact test, adjusted by Benjamini-Hochberg multiple testing correction and considered significant at an adjusted p value <0.05 (likewise -log(p value)>1.3). Moreover, z-scores to predict activation or inhibition of a network, pathway, or upstream regulator were calculated based on the overlap between uploaded datasets and IPA Knowledge Base; a cut-off of unbiased z-score ≥ 2 was applied to consider this prediction significant. Afterward, both analyses (neurons and BBB) were compared side-by-side.
Immunohistofluorescence
After the proteomics analysis, protein candidates were chosen to be verified by means of immunohistofluorescence analysis of brain tissue samples obtained from new patients (Table I). Candidate selection was performed based on MS data statistical analysis results and on the availability of commercial antibodies.
Depending on the validated antibody application, samples fixed into PFA (12 μm cryosections) or paraffin-embedded (3 μm sections) were used within one month after cutting. PFA samples were fixed in cold-acetone for 15 min before washing in 0.1% Tween-PBS (TPBS; Gibco, Gaithersburg, MD) for 5 min while a standard deparaffinization protocol was performed in paraffin-embedded samples, with a final wash in 0.1% Tween-TBS (TTBS).
Antigen retrieval using a citrate buffer (pH 6, 95 °C) for 20 min was performed in all paraffin-embedded samples and in some PFA-fixed samples according to antibody manufacturer instructions. Thereafter samples were blocked with 1% BSA, 5–10% goat serum (Millipore) in TPBS/TTBS. Slides were then incubated overnight at 4 °C with rabbit primary antibodies diluted in blocking buffer against adenosylhomocysteinase-2 (SAHH2 or AHCYL1, cat.#: ab178693, Abcam, Cambridge, UK), serine/arginine-rich splicing factor-1 (SRSF1 or SF2, cat.#: ab129108, Abcam), excitatory amino acid transporter-2 (EAA2 or GLT1, cat.#: NBP1–59632, Novus Biologicals, Littleton, CO), GTPase KRas (RASK or KRAS, cat.#: H00003845-M01, Novus; also cat.#: A1190, Neo Scientific, Woburn, MA), hepatocyte cell adhesion molecule (HECAM or HepaCAM, cat.#: sc-168078, Santa Cruz Biotechnology Inc., Dallas, TX), serrate RNA effector molecule homolog (SRRT or ARS2, cat.#: H00051593-B02P, Novus), protein-arginine deiminase type-2 (PADI2, cat.#: ab16478 and also ab50257, Abcam), cytochrome b-c1 complex subunit 7 (QCR7 or UQCRB, cat.#: ab190360, Abcam), NAD-dependent protein deacetylase sirtuin-1 (SIR2 or SIRT2, cat.#: H00022933-M01, Novus; also cat.#: A0273, Neo), neurotrimin (NTRI, cat.#: sc-390941, Santa Cruz), endophilin-A1 (SH3G2 or SH3GL2, cat.#: ab55702 and also ab169762, Abcam), and mitochondrial 4-aminobutyrate aminotransferase (GABT or ABAT, cat.#: ab81432, Abcam). Mouse anti-NeuN and TRITC conjugated UEA-I lectin (cat.#: L4889) were used as neuron and BBB markers, respectively. AlexaFluor® 488 anti-rabbit IgG (cat.#: A11008, Life Technologies, Carlsbad, CA) and AlexaFluor® 568 anti-mouse IgG were used as secondary antibodies diluted in blocking buffer. After washing, Sudan Black B staining was performed to reduce brain tissue autofluorescence (26) and sections were mounted on coverslips using Vectashield with 46-diamidino-2-phenyl indole (DAPI; Vector laboratories, Burlingame, CA). Negative controls were performed in each case without the primary antibody for selected protein candidates.
Tissue slides were analyzed using an FV-1000 laser confocal spectral microscope (Olympus, Tokyo, Japan) with the same intensities and parameters for all slides being qualitatively compared and for all samples for a given protein candidate. Images were processed with Fluoview v1.7a (Olympus).
Blood Biomarker Pilot Exploration
ELISA
Those proteins whose expression showed a similar cell localization pattern by immunofluorescence in human brain samples as in MS were explored as blood stroke biomarkers in a first pilot experiment, using commercially available ELISA kits. Circulating levels of SAHH2 (cat.#: E12635h, EIAab, Wuhan, PR China) and SRSF1 (cat.#: CSB-EL021142HU, Cusabio, College Park, MD) were tested following manufacturer's instructions by trained technicians blinded to clinical details. OD was measured in a SynergyTM Mx microplate reader (BioTek Instruments Inc., Winooski, VT).
Each sample was assayed twice and the mean value was used. Samples with a coefficient of variation (CV) between duplicates higher than 20% were excluded and samples with values under or over the detectable range of the assay were given the limit of detection value or the highest readable value, respectively. In each 96-well plate, a commercial sample pool was assayed in quatriplicates to be used as inter-assay control (plasma from Innovative Research, Novi, MI, cat.#: IPLA-N; serum, cat.#: H16914).
Statistical Analyses
Analyses Were Performed with SPSS 17.0 Software (SPSS Inc, USA) Unless Stated Otherwise
In the case of SRSF1, the inter-assay CV was higher than 20% and thus values were standardized prior to statistical analysis by calculating the Z-score value for each assay kit (in which different patient groups were equally distributed), by subtracting the mean and dividing by the standard deviation (S.D.) and adding two units to avoid negative results to each sample.
The primary endpoints to be analyzed were (1) differential diagnosis of stroke when compared with stroke-mimicking conditions and controls, and (2) early neurological outcome prediction in ischemic stroke patients, with neurological improvement/worsening defined as a decrease/increase in the NIHSS score by 4 or more points at 24 h or 48 h from admission (27).
The Kolmogorov-Smirnov test was used to assess normal distribution of the data (p > 0.05); as nonnormal distribution was found Kruskal-Wallis or Mann-Whitney U tests or Spearman's correlation were applied. For clinical variables, ordinal ones were analyzed as nonnormal distributed variables and the median and interquartile range (IQR) were shown, whereas continuous variables were analyzed by Student's t test and mean and S.D. values were given. Categorical variables were assessed by Pearson chi-squared test and are expressed as frequencies.
Cut-off points for biomarkers associated with an end point were obtained from their receiver operator characteristic (ROC) curve to discriminate early neurological improvement with the optimal accuracy (both sensitivity and specificity). To assess the independent association of biomarkers, a multivariate logistic regression model was built by the forward stepwise method with clinical variables associated with the end point at p value<0.1. Subsequently, dichotomized values of biomarkers were added to the clinical regression model by the enter method. Odds ratios adjusted by age and sex (ORadj) and 95% confidence interval are given. Finally, the discriminative potential of both predictive models was compared by DeLong's method using the areas under the ROC curve (AUC) of only clinical or clinical + biomarkers models (pROC R package). Moreover, the integrated discrimination improvement (IDI) index was calculated to assess the added value of biomarkers to the clinical predictive model (Hmisc R package).
In all cases, a p value <0.05 was considered significant at a 95% confidence level.
RESULTS
A summarized workflow chart of the whole study is shown in Fig. 1A.
Fig. 1.

Study schematic description. A, Workflow chart of the different stages of our study. B, Volcano plots of the neurons and BBB datasets after MS analysis. Highlighted in black those proteins with a p value <0.05 (-log10(p) >1.3) and a fold-change >2 (log2(FC) >1) when IC and CL areas were compared. IC: infarct core; CL: contralateral area; FC: fold-change; BBB: blood brain barrier structures; LTQ: linear trap quadrupole.
LMD-Proteomics
The specific changes that occur under ischemia in neurons and BBB structures were determined from the differential protein profile obtained between IC and CL areas of these microdissected cell types. A total of 43.3% of the quantified proteins were identified with at least 2 unique peptides: 365 proteins were identified in neurons and 539 proteins were identified in the BBB (supplemental Table S1). After statistical analysis of the MS data comparing both brain areas, the FDR for those proteins showing a p value <0.05 was 27% in the neurons and 69% in the BBB. To focus on the most biologically meaningful changes in the IC brain area, a p value <0.05 and a fold-change> 2 were applied to highlight the candidate proteins in each dataset: 55 proteins in neurons and 23 proteins in BBB (Fig. 1B).
Bioinformatics Analysis
The proteotypes of neurons and the BBB revealed some common but also diverse information about the biological processes and molecular functions taking place under brain ischemia in these two main structures. Clearly, the citric acid cycle (-log(B-H p value) = 9.87) and mitochondrial function (-log(B-H p value) = 2.67) were particularly altered in the microdissected neurons whereas any relevant canonical pathway showed up as exclusive to the BBB (Fig. 2A). Cell assembly, organization, and interaction together with cell death appeared as the foremost altered biological functions in both neurons and BBB proteotypes (Fig. 2B). In-depth analysis showed changes in cell assembly and interaction processes as being consistent for the neuronal dataset, where several IC-up-regulated proteins were revealed as regulators of plasticity processes (including up-regulation of neuritogenesis, elongation of axons and supression of synaptic depression) (Fig. 3A). Furthermore, cell death in the cerebral cortex was the top function predicted to be activated in both neurons and the BBB (z-scores of 2 for neurons and of 1.96 for BBB) (Fig. 3B). Interestingly, adenosine receptor A2a (ADORA2A) was predicted as activated upstream regulator of several IC-up-regulated proteins in neurons (z-scores of 2.05). These up-regulated proteins were again related to cell organization processes involving production of cell energy, cytoskeleton and transport through vesicles (Fig. 3C).
Fig. 2.

Representative pathways and functions of each cell proteotype after ischemic stroke. A, Comparative list of canonical pathways, and B, comparative list of biological functions, in neurons and/or BBB structures. Only those pathways and functions with a Benjamini-Hochberg corrected p value <0.05 (-log (p value) >1.3) at least in one of the cell types were represented. Dark bar denote neurons and light bar denote BBB structures.
Fig. 3.

Regulation of proteins after ischemia alters biological functions in neurons and BBB. A, Schema of the cell assembly, organization and interaction processes occurring in neurons of the infarct core (IC). B, Cell death in the cerebral cortex is activated in both neurons and BBB structures (in red, proteins found altered in both cell types). C, Upstream regulator predicted to be activated in neurons of the IC. Geometric red figures represent IC-up-regulated proteins taking part in these biological functions whereas green figures represent IC-downregulated proteins. Based on the state of the protein and their role in the process (arrow indicating activator, dash indicating inhibitor), the nature of several biological processes was predicted: orange indicates predicted activation andblue indicates predicted inhibition. Gray lines indicate direct relationship among proteins. ACTG1: actin, ADORA2A: adenosine receptor A2a, ALDOC: fructose-bisphosphate aldolase C, AP2A1: AP-2 complex subunit alpha-1, ATP1A3: sodium/potassium-transporting ATPase subunit alpha-3, ATP2B1: plasma membrane calcium-transporting ATPase 1, CAMKV: CaM kinase-like vesicle-associated protein, CFL1: cofilin-1, CRMP1: Dihydropyrimidinase-related protein 1, DPYSL2: Dihydropyrimidinase-related protein 2, EAA2: excitatory amino acid transporter 2, FBXO2: F-box only protein 2, GAPDH: glyceraldehyde-3-phosphate dehydrogenase, GNAO1: guanine nucleotide-binding protein G(o) subunit alpha, GSN: gelsolin, HSPB1: heat shock protein beta-1, NAPB: beta-soluble NSF attachment protein, PACSIN1: syndapin-1, RAB3A: Ras-related protein Rab-3A, RPS3: 40S ribosomal protein S3, SEPT11: septin-11, SH3GL2: endophilin-A1, SYN1: synapsin-1.
Moreover, cell organization, assembly, interaction and signaling processes were found again to be important in ischemic neurons as 3 top networks were created with mostly IC-up-regulated proteins. The top networks for neurons and BBB proteotypes are shown in supplemental Fig. S1.
Verification of Candidates
From the lists of proteins meaningfully altered by ischemia in neurons and BBB structures, focus was set on those proteins showing a cell-specific response to ischemia, i.e. being exclusively identified in one cell type, and those proteins performing equally under ischemia in both cell types studied (i.e. global ischemia response). Table II shows the list of 30 proteins fulfilling these criteria from where 12 proteins were chosen to be verified by immunohistofluorescence in new human brain samples. In our study, 6 out of 12 antibodies showed poor performance and regrettably these proteins could not be assessed in this phase of the study.
Table II. List of proteins altered in infarcted brain areas found by MS analysis exclusively in neurons, BBB structures or both. Bold proteins were selected as candidates for replication. FC: fold-change.
| UNIPROT ID | Protein name | Neurons |
BBB |
Main function | ||
|---|---|---|---|---|---|---|
| P value | FC | P value | FC | |||
| O43865 | SAHH2 | 0.006 | 10.33 | Amino-acid biosynthesis pathway. | ||
| P01116 | RASK | 0.010 | 9.43 | GTPase activity. | ||
| P62820 | RAB1A | 0.014 | 3.40 | GTPase activity. | ||
| Q02218 | ODO1 | 0.016 | 4.01 | Tricarboxylic acid cycle enzyme. | ||
| Q9BY11 | PACN1 | 0.020 | 4.49 | Reorganization of the cytoskeleton. | ||
| Q07955 | SRSF1 | 0.028 | 4.79 | Regulation of alternative splicing. | ||
| Q7Z4S6 | KI21A | 0.028 | 5.13 | Microtubule-binding motor protein. | ||
| P15880 | RS2 | 0.028 | 2.21 | Ribosomal protein. | ||
| P53597 | SUCA | 0.028 | 2.39 | Tricarboxylic acid cycle enzyme. | ||
| Q9NVA2 | SEP11 | 0.035 | 4.33 | Filament-forming cytoskeletal GTPase. | ||
| Q9H936 | GHC1 | 0.036 | 2.44 | Transport of Glutamate across the inner mitochondrial membrane. | ||
| P30086 | PEBP1 | 0.040 | 66.80 | Serine protease inhibitor. | ||
| P63261 | ACTG | 0.045 | 2.09 | Cell motility. | ||
| Q9BX26 | SYCP2 | 0.006 | 2.90 | Assembly of synaptonemal complexes. | ||
| Q96FC7 | PHIPL | 0.016 | 2.63 | Development of the central nervous system. | ||
| P17677 | NEUM | 0.023 | −3.78 | Axonal and dendritic filopodia induction. | ||
| Q14982 | OPCM | 0.032 | −3.11 | Binding opioids. | ||
| Q9BXP5 | SRRT | 0.034 | −3.32 | Mediator in RNA-mediated gene silencing by miRNAs. | ||
| Q15019 | SEPT2 | 0.035 | 2.06 | Filament-forming cytoskeletal GTPase. | ||
| P05129 | KPCG | 0.043 | −3.53 | Protein kinase. | ||
| Q14CZ8 | HECAM | 0.043 | −6.29 | Regulation of cell motility and cell-matrix interactions. | ||
| P14927 | QCR7 | 0.047 | −2.45 | Component of the mitochondrial respiratory chain. | ||
| Q9Y2J8 | PADI2 | 0.047 | 6.74 | Deimination of arginine residues of proteins. | ||
| Q8TAB3 | PCD19 | 0.049 | 9.04 | Cell adhesion protein. | ||
| Q9P121 | NTRI | 0.049 | −2.58 | Neural cell adhesion molecule. | ||
| Q8IXJ6 | SIR2 | 0.049 | 3.02 | Regulation of the cytoskeleton. | ||
| P43034 | LIS1 | 0.050 | 2.01 | Activation of actin polymerization in neurons. | ||
| Q99962 | SH3G2 | 0.017 | 3.61 | 0.026 | 2.59 | Synaptic vesicle endocytosis. |
| P43004 | EAA2 | 0.044 | −2.21 | 0.025 | −3.68 | Transport of Glutamate and Aspartate. |
| P80404 | GABT | 0.046 | 6.89 | 0.030 | 9.03 | Conversion of GABA to Glutamate and succinate. |
For the other candidates, RASK was detected in vessel structures, in contradiction to our MS findings, and thus it was not further evaluated. PADI2 was correctly found in the BBB structures of the IC but inconsistently across different patient samples. Furthermore, of those candidates found to be altered in both cell types studied, GABT was found raised in most IC samples but only in the neurons and EAA2 was more abundant in the neuronal bodies, with an intense signal surrounding the nuclei, than in the BBB but with an unclear expression pattern throughout IC and CL samples (data not shown).
As expected, SAHH2 and SRSF1 were both identified in neurons showing higher expression levels in the IC when compared with the CL area. Specifically, the SRSF1 signal was gathered in the neuronal body showing a shift from the nucleus to the cytoplasm in the IC, whereas SAHH2 was detected in the neuronal bodies and also in the axons (Figs. 4A and 4B).
Fig. 4.
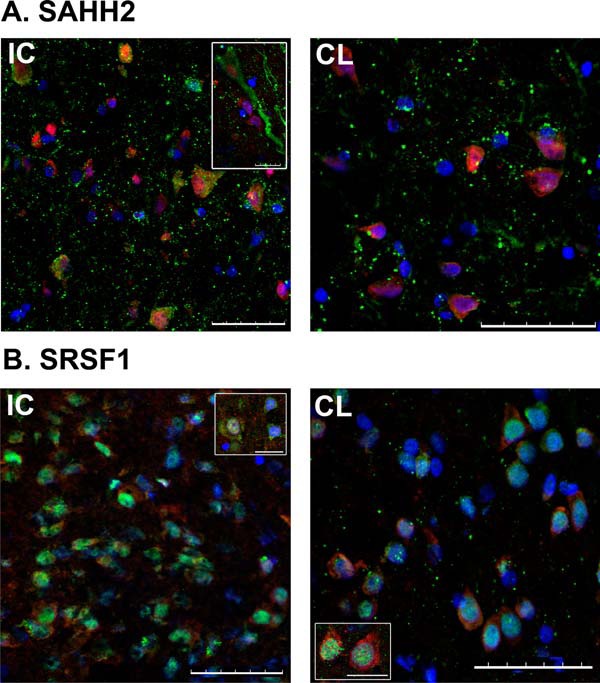
Immunohistofluorescence analyses of human brain samples. A, SAHH2 (1:400 antibody dilution) is increased in the neurons of the infarct core (IC) versus contralateral area (CL). B, SRSF1 (1:100 antibody dilution) was also greater in neurons of IC than of CL. SAHH2 and SRSF1 signal was detected with green channel (secondary antibodies at 1:500 dilution), whereas co-localization with neuronal nuclei immunodetection (NeuN, 1:100 antibody dilution) was done in red channel. Nuclear detection with DAPI was done in blue channel. Central images and image inserts showing characteristics details are representative for each protein immunofluorescence analysis. Scale bar = 50 μm. Bar in inserts = 10 μm.
Blood Biomarker Exploration
Finally these two completely verified candidates in the brain tissue were further explored as diagnostic and prognostic biomarkers for stroke in blood samples obtained within the first 6 h after symptom onset. Circulating levels of SAHH2 and SRSF1 were not influenced by age, sex or any other clinical factor (data not shown) but they did not show any role as diagnostic biomarkers when their quantified levels were compared between ischemic strokes, stroke-mimicking conditions and controls (supplemental Table S2).
Those ischemic stroke patients showing a neurological improvement at 24 h, who had higher blood pressure values, higher NIHSS scores at admission and were more frequently treated with rt-PA, had lower circulating levels of SAHH2 at admission than patients whose condition did not improve (968.9 versus 1498.9 pg/ml, p = 0.031). No differences were observed for SRSF1 (Table III). Once SAHH2 was dichotomized by a cut-off of 993.23 pg/ml (89% sensitivity, 58% specificity) and introduced in the multivariate clinical model, low admission circulating levels of this biomarker showed up as an independent predictor of neurological improvement at 24 h. Moreover, when SAHH2 was included together with clinical data into this predictive model, the discrimination between groups of patients increased, with an AUC up to 0.874 and, globally, the prediction of improvement was significantly increased by 20% when compared with the clinical model alone (p = 0.032) (Table IV).
Table III. Univariate analysis: Demographic and clinical characteristics associated with neurological improvement at 24h in ischemic stroke patients. NIHSS: National Institutes of Health stroke scale; mRS: modified Rankin scale; SBP: systolic blood pressure; DBP: diastolic blood pressure; SAHH2: adenosylhomocysteinase-2; Z-SRSF1: standardized values for serine/arginine-rich splicing factor-1. Statistically significant differences between studied groups are highlighted as bold p values and statistical trends are marked with*.
| Factors | Neurological improvement (n = 13) | No neurological improvement (n = 32) | P value |
|---|---|---|---|
| Age, years median (IQR) | 79 (77–82) | 81 (68.5–84) | 0.539 |
| Sex (Male) % (n) | 46.2 (6) | 46.9 (15) | 0.965 |
| Admission NIHSS score median (IQR) | 13 (10–17) | 8 (4–16) | 0.079* |
| Previous mRS score median (IQR) | 1 (1–1) | 1 (0.5–3) | 0.851 |
| Glycemia, mg/dL mean ± S.D. | 126.67 ± 39.94 | 138.55 ± 39.69 | 0.384 |
| SBP, mm Hg mean ± S.D. | 159.10 ± 20.02 | 140.32 ± 24.91 | 0.045 |
| DBP, mm Hg mean ± S.D. | 84.90 ± 13.30 | 74.00 ± 15.11 | 0.060* |
| Smokers % (n) | 0 (0) | 16.0 (4) | 0.303 |
| Arterial hypertension % (n) | 76.9 (10) | 78.1 (25) | 1.000 |
| Diabetes mellitus % (n) | 30.8 (4) | 25.0 (8) | 0.721 |
| Dyslipidemia % (n) | 30.8 (4) | 46.9 (15) | 0.207 |
| Atrial fibrillation % (n) | 10.0 (1) | 33.3 (9) | 0.229 |
| Cardiopathy % (n) | 53.8 (7) | 43.8 (14) | 0.538 |
| Previous stroke % (n) | 30.8 (4) | 15.6 (5) | 0.411 |
| rt-PA administration % (n) | 84.6 (11) | 43.8 (14) | 0.012 |
| Time-to-treatment, min mean ± S.D. | 166.33 ± 63.83 | 144.15 ± 61.81 | 0.424 |
| TOAST | 0.224 | ||
| - Atherothrombotic % (n) | 38.5 (5) | 15.6 (5) | |
| - Cardioembolic % (n) | 53.8 (7) | 53.1 (17) | |
| - Undetermined % (n) | 7.7 (1) | 25.0 (8) | |
| HT % (n) | 28.6 (2) | 16.7 (3) | 0.597 |
| In-hospital death % (n) | 7.7 (1) | 18.8 (6) | 0.654 |
| Z-SRSF1 median (IQR) | 1.59 (1.59–1.59) | 1.59 (1.59–2.14) | 0.353 |
| SAHH2 pg/ml median (IQR) | 968.89 (886.43–1561.18) | 1498.91 (1134.75–2305.35) | 0.031 |
| SAHH2 < 993.23 pg/ml % (n) | 58.3 (7) | 10.7 (3) | 0.003 |
Table IV. Predictive models comparative for neurological improvement at 24 h and 48 h in ischemic stroke patients. Logistic regression models were built including all variables with p < 0.01 in univariate analyses; only those clinical variables remaining in the model are shown. All models were adjusted by age and sex. CI: confidence interval. IDI: integrated discrimination improvement index; index given for both events (i.e. patients who improved) and non-events and for the sum of both (with 95% CI). AUC: area with 95% CI given for each model. Clinical model was always used as reference model. NIHSS: National Institutes of Health stroke scale; SBP: systolic blood pressure; SAHH2: adenosylhomocysteinase-2. Statistically significant results are highlighted as bold p values.
| Neurological improvement 24 h |
Neurological improvement 48 h |
||||
|---|---|---|---|---|---|
| Clinical | Clinical + SAHH2 | Clinical | Clinical + SAHH2 | ||
| Logistic regression [ORadj (95%CI), p value] | NIHSS score admission | 1.18 (0.98–1.43), 0.086 | 1.21 (0.96–1.52), 0.113 | 1.15 (1.03–1.29), 0.015 | 1.16 (1.02–1.33), 0.028 |
| SBP | 1.06 (1.00–1.11), 0.047 | 1.03 (0.97–1.10), 0.299 | − | − | |
| SAHH2 < 993.23 pg/ml | − | 21.57 (1.30–358.62), 0.032 | − | 9.27 (1.38–62.25), 0.022 | |
| IDI statistics | IDI events | − | 0.141 | − | 0.070 |
| IDI non-events | − | 0.060 | − | 0.076 | |
| IDI | − | 0.201 (0.017–0.385) | − | 0.146 (0.022–0.269) | |
| p value | Ref. | 0.032 | Ref. | 0.020 | |
| ROC curves | AUC | 0.800 (0.629–0.971) | 0.874 (0.719–1.00) | 0.702 (0.537–0.867) | 0.818 (0.680–0.957) |
| p value | Ref. | 0.372 | Ref. | 0.064 | |
Similar results for admission levels of SAHH2 were obtained for neurological improvement measured at 48 h after stroke onset (Table IV; supplemental Table S3 shows demographic and clinical data associated with this end point). At this time point, rt-PA treatment was the only variable being included in the clinical regression model. However, this model was not considered clinically meaningful (i.e. assessing the prognostic value of the biomarker at admission before deciding whether rt-PA treatment should be given) and thus a basic model including NIHSS score was built, as shown in Table IV. Nonetheless, dichotomized SAHH2 levels remained as an independent predictor even when rt-PA was entered into the model (data not shown).
Further assessment showed no association between SAHH2 baseline circulating levels and mortality (15.5% deaths in this cohort, average time from stroke onset to death of 6.43 ± 4.96 days).
DISCUSSION
Previous studies assessing the changes in the protein expression profile after human cerebral ischemia were based on MS analysis of the whole cerebral tissue (14, 15) or explored the expression of targeted molecules in specific isolated cell types (18, 19, 28). The study being presented here explored, for the first time, the proteome of neurons and BBB structures isolated by LMD from human brains after stroke following a hypothesis-free analysis based on label-free MS. Moreover, we applied a GPF approach dividing the m/z range in MS2 to maximize the protein identification rate when performing a data dependent acquisition in this type of samples with low protein amounts (24, 29, 30).
The coupling of LMD and proteomics for the analysis of specific cell populations has been previously considered in the context of multiple human brain disorders such as Alzheimer's (31–33), multiple sclerosis (34) and different types of tumors (35, 36). In the present study, this type of analysis was considered especially appropriate to assess proteotypic changes in ischemic stroke, a pathology in which each component of the neurovascular unit presents a different response to the ischemic insult (2). These different responses were evidenced in the datasets presented here with sets of proteins being altered in both isolated cell types as well as neuron-specific and BBB-specific proteins also being altered.
Pathway-based bioinformatics analysis helped to envision those processes and functions that are relevant to the pathophysiology of stroke and those that only affect one cell type. The alteration of the citric acid cycle and the mitochondrial function after ischemia exclusively in the neurons might be related to repair mechanisms, as supported by other highlighted biological processes such as synaptic plasticity. The up-regulation in the IC region of 50% of the enzymes involved in the citric acid cycle (known to be activated by increased Ca2+ levels (37)) and of some of the proteins belonging to the electron transport chain indicates an increase in the production of cell energy as adenosine triphosphate (ATP). This energy would be required, among other processes, for neuronal mitochondria remodeling by fission, which under an ischemic insult is activated by increased Ca2+ and free radicals (38). Mitochondrial fission is mainly orchestrated by dynamin-related protein 1 (DRP-1 or DNM1L; found up-regulated in our experiment), and this protein is involved in several biological functions: synaptic plasticity, autophagy (linked to neuroprotection) and apoptosis (the last step of preventing brain damage) (reviewed in 39 and 40). ADORA2A was predicted to be an upstream regulator found in the bioinformatics analysis. It is one of the two brain adenosine receptors and it increases intracellular cAMP levels, regulates blood flow and reduces inflammation and is known to be up-regulated under hypoxia conditions. It has been related to ischemic brain damage but also promotes synaptic plasticity (41). Thus, most of our findings in neurons pointed to brain plasticity processes being engaged in IC areas and this might be related to the time from stroke onset to death in the samples available for this study, with a range around 2 to 15 days after stroke in the experimental MS analysis.
BBB structures, in contrast to neurons, although undoubtedly affected by stroke, did not exhibit consistent exclusive pathways and functions altered after ischemia. Despite being surely influenced by the smaller sample size achieved for the MS analysis and consequently a powerless statistical analysis, these results might be also a direct consequence of a higher cell complexity in BBB structures, which are near with other cell types (i.e. astrocytes or pericytes) interfering in their pure isolation, or of a higher tolerance against the ischemic insult. It should be noted that only those cells preserving their morphology and structural integrity could be detected and isolated by LMD. There was, therefore, no proteomic information regarding neurons and BBB structures if they are extremely disrupted after ischemia.
The top candidates in our datasets were selected to be validated by immunohistofluorescence in independent tissue samples. Regrettably, some of the tested antibodies were found to be inadequate for immunohistochemical applications and precluded the validation of some interesting candidates. In other cases, the differential time from onset to death, the postmortem interval or the tissue preservation method between the samples used in MS or in the validation assays, or the heterogeneity of the brain areas hit by stroke, might be influencing inconsistent findings. In the case of BBB structures, some false positive candidates were unmasked in the validation step. Although not completely verified, our findings on EAA2 and GABT still seem relevant for ischemic stroke.
The brain protein EAA2 (also named SLC1A2 and GLT-1 in rodents) is responsible for maintaining the glutamate balance in the synaptic cleft (42). Although EAA2 is mainly an astrocytic transporter (42) it has also been detected in other brain cell types including neurons and endothelial cells (43–45). Even though the mechanism that regulates the expression of EAA2 during ischemia is not fully understood, the stimulation of EAA2 has been shown to prevent neuronal damage after ischemia. This is probably because of the high glutamate clearance capability exhibited in the neuroaxis (46, 47). In the present study, we detected a reduction in EAA2 expression in both, neurons and BBB isolated from the IC area, thus showing a general response to the ischemic insult. These results are in line with previous publications that examined EAA2 expression in experimental models of ischemia (48–50). However, it is noteworthy that these results may vary between species (51) and, currently, very little data exists on the expression of EAA2 in human brain in the context of ischemia. Moreover, EAA2 expression might also vary depending on the brain matter assessed, as Yatomi et al. showed an increase of EAA2 in white matter regions of human brains after an ischemic event (52).
GABT is a mitochondrial enzyme responsible for the catabolism of gamma-aminobutyric acid (GABA), an important inhibitory neurotransmitter in the central nervous system, into succinic semialdehyde. After an ischemic insult, there is a substantial acute increase in extracellular concentration of GABA in the brain. This minimizes the effect of extracellular glutamate, with the concomitant decrease of GABA synthesis probably because of an increase in glutamatergic activity (53). As an increase in GABAergic activity decreases glutamatergic activity, several therapeutic approaches have been designed that aim to increase GABA's function after acute ischemia. These approaches have included the inhibition of GABT via the GABA transaminase inhibitor vigabitrin, which has shown a neuroprotective effect (53). In concordance with our results, GABT was found to increase in gerbil brain hippocampus after brain ischemia (54). In the human brain, GABT has previously been reported to appear irregular and granular in many types of neurons and glial cells in Alzheimer's patients (55).
The protein expression changes of SRSF1 and SAHH2 in regions affected by ischemia were completely verified in our immunofluorescence assays. SRSF1 (also known as SF2/ASF) is a serine/arginine rich protein with an important involvement in post-transcriptional gene regulation (56). It participates in both constitutive and alternative splicing, RNA metabolism, RNA transport and translation (57). The action of SRSF1 is essential for the regulation of angiogenesis and vascular senescence as it is involved in the generation of several vascular endothelial growth factor (VEGF) isoforms (58) and tissue factor or endoglin (59). It has been also described that SRSF1 overexpression activates the mTOR1 signaling pathway, which plays a significant role in cellular growth and protein translation (59). Thus, our results, showing an enhanced expression of SRSF1 in the neurons of the IC region, might reflect the implication of SRSF1 in processes involved in tissue repair after ischemia. Interestingly, we also detected a clear translocation of SRSF1 from the neuronal nucleus to the cytoplasm after ischemia, which plausibly affects its function within the cell for all its pleiotropic possibilities. This compartment redistribution of SRSF1 is coordinated through phosphorylation by serine/arginine-rich protein kinases (SRPKs) (60–62) whose expression and location have also been found to be altered after brain ischemia (63).
The protein SAHH2 (also known as AHCYL1 or IRBIT), highly expressed in the brain (64), plays an important role in the coordinated inhibition of Ca2+ ion transporters through the inactivation of 1, 4, 5-triphosphate receptors (IP3R) and it is involved in neurite cone extension (65). To the best of our knowledge, SAHH2 has not been previously explored in the context of stroke. Our results show an increased expression of SAHH2 in neurons from the IC area probably because of ischemia-triggered Ca2+ mobilization.
Finally, we have explored the role of these 2 validated candidates as blood biomarkers to differentiate ischemic strokes from other neurological conditions and to assess stroke prognosis. Neither of them improves stroke discrimination, however, their biological functions associated with repair processes, suggest that they might exert a role in stroke prognosis estimation. Accurate and early stroke prognosis is essential to better evaluate the risks and benefits of stroke treatment and management and thus represents a unique opportunity for clinical interventions aimed at improving stroke outcome. Furthermore, some of the proteins identified here exclusively in the BBB structures, might be interesting candidates to be assessed as biomarkers to predict hemorrhagic transformation, one of the most feared complications of rt-PA treatment in stroke patients and associated with BBB breakdown (66). In this sense, as those BBB candidates could not be validated by immunofluorescence assay, such analysis was not explored here but further investigation is warranted.
In the assessed cohort, only SAHH2 appeared as a potentially valuable indicator of early stroke prognosis, with low circulating levels associated with neurological improvement. We found increased levels of SAHH2 in the IC brain regions of patients who finally died because of stroke and, in relation to this, higher SAHH2 levels in the bloodstream of patients with neurological deterioration. The association of SAHH2 with more Ca2+ mobilization and glutamate excitotoxicity might explain the overexpression of neuronal SAHH2 in patients with enlarged cerebral lesions, who are prone to suffer poorer outcomes (67). The release of cell content after neuronal death might be another plausible explanation, with more protein released when large damage occurs, although causality cannot be extrapolated here. Nonetheless, the discrimination of stroke outcome with SAHH2 showed a high sensitivity (89%) but with a moderate specificity (58%). The combination of SAHH2 in a panel with other prognosis biomarkers, such as cytokines (68, 69) or metalloproteinases (70), might complement the evaluation of clinical outcome after stroke.
Moreover, the potential of SRSF1 and SAHH2, as well as other identified proteins through MS and/or bioinformatics analyses, as therapeutic targets seems promising and future studies might assess them to drive neuronal recovery therapies after the ischemic insult.
Our study had some limitations that need to be taken into account and should be addressed in future and larger studies. Although the stringent candidate selection criteria coupled with a verification step by immunohistofluorescence supports our findings, the number of patients included in the study is relatively small but ischemic stroke patients' brain necropsies are rarely achieved as they are not needed for diagnosis neither family counseling purposes. This limited sample size influenced also in the reliability of our MS statistical analysis through the parametric paired test available in Progenesis software, although similar lists of significant proteins were achieved by nonparametric tests (supplemental Fig. S2). In addition, even though LMD allows the isolation of specific cell types, it is extremely difficult to isolate cells with complex morphology such as astrocytes using this technique. Therefore, we were not able to perform a proteomic characterization of these major brain cell types, which are highly relevant in brain ischemia. Finally, because of ischemia the appearance of subclinical edema or blood extravasation into the brain parenchyma can occur. Thus, we cannot discard the presence of proteins from the bloodstream, especially in IC regions.
Our work also has some strengths that should be highlighted. Although a different response to protein degradation processes cannot be dismissed between healthy and infarcted tissue, we have tried to control the influence of these processes in the best possible manner by using the nonaffected contralateral side of the same brain as control tissue, being both samples obtained under the same conditions. The brain changes because of ischemia disclosed here were observed in a nonacute phase but they seem robust as they were found in brain samples obtained at a wide range of times after symptom onset. Following the presented approach, we identified and evaluated new proteins (SRSF1 and SAHH2) in the context of brain ischemia.
In conclusion, we were able to describe changes in the protein expression profile from specific cerebral cell populations after stroke using a label-free MS quantification approach. These results contribute to increasing knowledge on the molecular mechanisms of ischemic stroke pathology. Moreover, we highlighted SAHH2 as an interesting candidate to be further assessed as a stroke prognostic biomarker.
DATA AVAILABILITY
The mass spectrometry proteomics data generated in this work has been deposited to the ProteomeXchange Consortium (http://www.proteomexchange.org/) via the PRIDE partner repository with the dataset identifier PXD003519 and 10.6019/PXD003519.
Supplementary Material
Acknowledgments
We thank Júlia Faura and Héctor Huerga for contributing in the setting-up of some methods used in this study while in research training at the Neurovascular Research Laboratory, Dr. Pilar Delgado for providing blood samples from the ISSYS cohort and Ferran Briansó, Alex Sánchez-Pla (Statistics and Bioinformatics Unit, VHIR) and Oriol Ventura for statistical advice during manuscript revision. We would also like to show our gratitude to the patients included in the study and their relatives, who allowed this increase in knowledge and insights into neurovascular pathology.
Footnotes
* Neurovascular Research Laboratory acknowledges funding for this project by a PI15/00354 grant from Fondo de Investigaciones Sanitarias and takes part in the Spanish stroke research network INVICTUS+ (RD16/0019/0021) of the Instituto de Salud Carlos III (co-financed by the European Regional Development Fund, FEDER). The VHIO Proteomics Laboratory is member of Proteored, PRB2-ISCIII.
 This article contains supplemental material.
Authors' contribution: T.G.-B. helped in designing the experiments and, together with V.L., performed the laser microdissection of the brain samples, did the analysis of the data and wrote the article. L.C. and L.R. performed the immunohistofluorescence replication and contributed to the bioinformatics analysis, undertaken by A.S., A.H., and V.L. took care of the mass spectrometry workflow. A.B. recruited and selected the cohort of stroke patients and A.P. performed the ELISAs with blood samples. E.M.-S. did the neuropathological examinations to collect brain samples and provided the paraffin-fixed samples. F.C. helped in the design of the study and supplied the Progenesis LC-MS® software. J.-C.S. and J.M. planned the whole project and supervised the experiments. All authors have critically reviewed the article content and approved it in its final version.
Other authors' email address (in order of authorship): teresa.garcib@gmail.com, llombs@hotmail.com, laura.colas.campas@gmail.com, Alexandre.Hainard@unige.ch, Virginie.Licker@unige.ch, anna.penalba@vhir.org, laura.ramirop@gmail.com, simatsalba@gmail.com, alebustamanterangel@gmail.com, eamartinez@vhebron.net, fcanals@vhio.net, Jean-Charles.Sanchez@unige.ch.
1 The abbreviations used are:
- BBB
- blood brain barrier
- ADORA2A
- adenosine receptor A2a
- BDNF
- brain-derived neurotrophic factor
- APP
- amyloid precursor protein
- ATP
- adenosine triphosphate
- AUC
- area under the ROC curve
- CL
- contralateral
- CV
- coefficient of variation
- DAPI
- 46-diamino-2-phenyl indole
- EAA2
- excitatory amino acid transporter 2
- FA
- formic acid
- GABT
- 4-aminobutyrate aminotransferase, mitochondrial
- GPF
- gas phase fractionation
- IAA
- iodoacetamide
- IC
- infarct core
- IDI
- integrated discrimination improvement
- IP3R
- 1,4,5-triphosphate receptors
- IPA
- Ingenuity Pathway Analysis
- IQR
- interquartile range
- ISSYS
- Investigating Silent Strokes in hYpertensiveS
- LMD
- laser microdissection
- LTQ
- linear trap quadrupole
- mRS
- modified Rankin Scale
- mTOR1
- mammalian target of Rapamycin 1
- NeuN
- neuronal nuclei
- NIHSS
- National Institutes of Health Stroke Scale
- ORadj
- adjusted odds ratio
- PADI2
- protein-arginine deiminase type-2
- PFA
- paraformaldehyde
- RASK
- GTPase KRas
- ROC
- receiver operator characteristic
- rt-PA
- recombinant tissue-plasminogen activator
- SAHH2
- adenosylhomocysteinase 2
- SD
- standard deviation
- SRPK
- serine/arginine-rich protein kinase
- SRSF1
- serine/arginine-rich splicing factor 1
- TCEP
- tris (2-carboxyethyl) phosphine
- TEAB
- triethylammonium bicarbonate
- TOAST
- Trial of Org 10172 in acute stroke treatment
- TPBS
- Tween-PBS
- TTBS
- Tween-TBS
- UEA-I
- Ulex europaeus agglutinin I.
REFERENCES
- 1. Benjamin E. J., Blaha M. J., Chiuve S. E., Cushman M., Das S. R., Deo R., de Ferranti S. D., Floyd J., Fornage M., Gillespie C., Isasi C. R., Jiménez M. C., Jordan L. C., Judd S. E., Lackland D., Lichtman J. H., Lisabeth L., Liu S., Longenecker C. T., Mackey R. H., Matsushita K., Mozaffarian D., Mussolino M. E., Nasir K., Neumar R. W., Palaniappan L., Pandey D. K., Thiagarajan R. R., Reeves M. J., Ritchey M., Rodriguez C. J., Roth G. A., Rosamond W. D., Sasson C., Towfighi A., Tsao C. W., Turner M. B., Virani S. S., Voeks J. H., Willey J. Z., Wilkins J. T., Wu J. H., Alger H. M., Wong S. S., Muntner P., and American Heart Association Statistics Committee and Stroke Statistics Subcommittee. (2017) Heart Disease and Stroke Statistics-2017 Update: A Report From the American Heart Association. Circulation 135, e146–e603 [DOI] [PMC free article] [PubMed] [Google Scholar]
- 2. Terasaki Y., Liu Y., Hayakawa K., Pham L. D., Lo E. H., Ji X., and Arai K. (2014) Mechanisms of neurovascular dysfunction in acute ischemic brain. Curr. Med. Chem. 21, 2035–2042 [DOI] [PMC free article] [PubMed] [Google Scholar]
- 3. Hacke W., Kaste M., Bluhmki E., Brozman M., Dávalos A., Guidetti D., Larrue V., Lees K. R., Medeghri Z., Machnig T., Schneider D., von Kummer R., Wahlgren N., Toni D., and Investigators ECASS. (2008) Thrombolysis with alteplase 3 to 4.5 hours after acute ischemic stroke. N. Engl. J. Med. 359, 1317–1329 [DOI] [PubMed] [Google Scholar]
- 4. Jovin T. G., Chamorro A., Cobo E., de Miquel M. A., Molina C. A., Rovira A., San Román L., Serena J., Abilleira S., Ribó M., Millán M., Urra X., Cardona P., López-Cancio E., Tomasello A., Castaño C., Blasco J., Aja L., Dorado L., Quesada H., Rubiera M., Hernandez-Pérez M., Goyal M., Demchuk A. M., von Kummer R., Gallofré M., Dávalos A., and Trial Investigators REVASCAT. (2015) Thrombectomy within 8 hours after symptom onset in ischemic stroke. N. Engl. J. Med. 372, 2296–2306 [DOI] [PubMed] [Google Scholar]
- 5. Chamorro Á., Dirnagl U., Urra X., and Planas A. M. (2016) Neuroprotection in acute stroke: targeting excitotoxicity, oxidative and nitrosative stress, and inflammation. Lancet Neurol. 15, 869–881 [DOI] [PubMed] [Google Scholar]
- 6. Rothstein L., and Jickling G. C. (2013) Ischemic stroke biomarkers in blood. Biomark. Med. 7, 37–47 [DOI] [PubMed] [Google Scholar]
- 7. Jickling G. C., and Sharp F. R. (2015) Biomarker panels in ischemic stroke. Stroke 46, 915–920 [DOI] [PMC free article] [PubMed] [Google Scholar]
- 8. Bustamante A., Sobrino T., Giralt D., García-Berrocoso T., Llombart V., Ugarriza I., Espadaler M., Rodríguez N., Sudlow C., Castellanos M., Smith C. J., Rodríguez-Yánez M., Waje-Andreassen U., Tanne D., Oto J., Barber M., Worthmann H., Wartenberg K. E., Becker K. J., Chakraborty B., Oh S.-H., Whiteley W. N., Castillo J., and Montaner J. (2014) Prognostic value of blood interleukin-6 in the prediction of functional outcome after stroke: a systematic review and meta-analysis. J. Neuroimmunol. 274, 215–224 [DOI] [PubMed] [Google Scholar]
- 9. Ramos-Fernandez M., Bellolio M. F., and Stead L. G. (2011) Matrix metalloproteinase-9 as a marker for acute ischemic stroke: a systematic review. J. Stroke Cerebrovasc. Dis. Off. J. Natl. Stroke Assoc. 20, 47–54 [DOI] [PubMed] [Google Scholar]
- 10. Ning M., Lopez M., Cao J., Buonanno F. S., and Lo E. H. (2012) Application of proteomics to cerebrovascular disease. Electrophoresis 33, 3582–3597 [DOI] [PMC free article] [PubMed] [Google Scholar]
- 11. García-Berrocoso T., Penalba A., Boada C., Giralt D., Cuadrado E., Colomé N., Dayon L., Canals F., Sanchez J.-C., Rosell A., and Montaner J. (2013) From brain to blood: New biomarkers for ischemic stroke prognosis. J. Proteomics 94, 138–148 [DOI] [PubMed] [Google Scholar]
- 12. Kotrcova E., Jarkovska K., Valekova I., Zizkova M., Motlik J., Gadher S. J., and Kovarova H. (2015) Challenges of Huntington's disease and quest for therapeutic biomarkers. Proteomics Clin. Appl. 9, 147–158 [DOI] [PubMed] [Google Scholar]
- 13. Liu X., Wen F., Yang J., Chen L., and Wei Y.-Q. (2010) A review of current applications of mass spectrometry for neuroproteomics in epilepsy. Mass Spectrom. Rev. 29, 197–246 [DOI] [PubMed] [Google Scholar]
- 14. Datta A., Akatsu H., Heese K., and Sze S. K. (2013) Quantitative clinical proteomic study of autopsied human infarcted brain specimens to elucidate the deregulated pathways in ischemic stroke pathology. J. Proteomics 91, 556–568 [DOI] [PubMed] [Google Scholar]
- 15. Cuadrado E., Rosell A., Colomé N., Hernández-Guillamon M., García-Berrocoso T., Ribo M., Alcazar A., Ortega-Aznar A., Salinas M., Canals F., and Montaner J. (2010) The proteome of human brain after ischemic stroke. J. Neuropathol. Exp. Neurol. 69, 1105–1115 [DOI] [PubMed] [Google Scholar]
- 16. Brea D., Agulla J., Staes A., Gevaert K., Campos F., Sobrino T., Blanco M., Dávalos A., Castillo J., and Ramos-Cabrer P. (2015) Study of protein expression in peri-infarct tissue after cerebral ischemia. Sci. Rep. 5, 12030. [DOI] [PMC free article] [PubMed] [Google Scholar]
- 17. Chen A., Liao W. P., Lu Q., Wong W. S. F., and Wong P. T.-H. (2007) Upregulation of dihydropyrimidinase-related protein 2, spectrin alpha II chain, heat shock cognate protein 70 pseudogene 1 and tropomodulin 2 after focal cerebral ischemia in rats–a proteomics approach. Neurochem. Int. 50, 1078–1086 [DOI] [PubMed] [Google Scholar]
- 18. Cuadrado E., Rosell A., Penalba A., Slevin M., Alvarez-Sabín J., Ortega-Aznar A., and Montaner J. (2009) Vascular MMP-9/TIMP-2 and neuronal MMP-10 up-regulation in human brain after stroke: a combined laser microdissection and protein array study. J. Proteome Res. 8, 3191–3197 [DOI] [PubMed] [Google Scholar]
- 19. García-Berrocoso T., Giralt D., Llombart V., Bustamante A., Penalba A., Flores A., Ribó M., Molina C. A., Rosell A., and Montaner J. (2014) Chemokines after human ischemic stroke: From neurovascular unit to blood using protein arrays. Transl. Proteomics 3, 1–9 [Google Scholar]
- 20. Adams H. P., Bendixen B. H., Kappelle L. J., Biller J., Love B. B., Gordon D. L., and Marsh E. E. (1993) Classification of subtype of acute ischemic stroke. Definitions for use in a multicenter clinical trial. TOAST. Trial of Org 10172 in Acute Stroke Treatment. Stroke 24, 35–41 [DOI] [PubMed] [Google Scholar]
- 21. Riba-Llena I., Jarca C. I., Mundet X., Tovar J. L., Orfila F., López-Rueda A., Nafría C., Fernández J. L., Castañé X., Domingo M., Alvarez-Sabín J., Fernández-Cortiñas I., Maisterra O., Montaner J., and Delgado P. (2013) Investigating silent strokes in hypertensives: a magnetic resonance imaging study (ISSYS): rationale and protocol design. BMC Neurol. 13, 130. [DOI] [PMC free article] [PubMed] [Google Scholar]
- 22. Abbott N. J., and Friedman A. (2012) Overview and introduction: the blood-brain barrier in health and disease. Epilepsia 53, 1–6 [DOI] [PMC free article] [PubMed] [Google Scholar]
- 23. Muoio V., Persson P. B., and Sendeski M. M. (2014) The neurovascular unit - concept review. Acta Physiol. Oxf. Engl. 210, 790–798 [DOI] [PubMed] [Google Scholar]
- 24. Scherl A., Shaffer S. A., Taylor G. K., Kulasekara H. D., Miller S. I., and Goodlett D. R. (2008) Genome-specific gas-phase fractionation strategy for improved shotgun proteomic profiling of proteotypic peptides. Anal. Chem. 80, 1182–1191 [DOI] [PubMed] [Google Scholar]
- 25. Vizcaíno J. A., Csordas A., Del-Toro N., Dianes J. A., Griss J., Lavidas I., Mayer G., Perez-Riverol Y., Reisinger F., Ternent T., Xu Q.-W., Wang R., and Hermjakob H. (2016) 2016 update of the PRIDE database and its related tools. Nucleic Acids Res. 44, 11033. [DOI] [PMC free article] [PubMed] [Google Scholar]
- 26. Schnell S. A., Staines W. A., and Wessendorf M. W. (1999) Reduction of lipofuscin-like autofluorescence in fluorescently labeled tissue. J. Histochem. Cytochem. Off. J. Histochem. Soc. 47, 719–730 [DOI] [PubMed] [Google Scholar]
- 27. Brott T. G., Haley E. C., Levy D. E., Barsan W., Broderick J., Sheppard G. L., Spilker J., Kongable G. L., Massey S., and Reed R. (1992) Urgent therapy for stroke. Part I. Pilot study of tissue plasminogen activator administered within 90 minutes. Stroke 23, 632–640 [DOI] [PubMed] [Google Scholar]
- 28. Slevin M., Krupinski J., Rovira N., Turu M., Luque A., Baldellou M., Sanfeliu C., de Vera N., and Badimon L. (2009) Identification of pro-angiogenic markers in blood vessels from stroked-affected brain tissue using laser-capture microdissection. BMC Genomics 10, 113. [DOI] [PMC free article] [PubMed] [Google Scholar]
- 29. Blonder J., Rodriguez-Galan M. C., Lucas D. A., Young H. A., Issaq H. J., Veenstra T. D., and Conrads T. P. (2004) Proteomic investigation of natural killer cell microsomes using gas-phase fractionation by mass spectrometry. Biochim. Biophys. Acta 1698, 87–95 [DOI] [PubMed] [Google Scholar]
- 30. Kennedy J., and Yi E. C. (2008) Use of gas-phase fractionation to increase protein identifications : application to the peroxisome. Methods Mol. Biol 432, 217–228 [DOI] [PubMed] [Google Scholar]
- 31. Leverenz J. B., Umar I., Wang Q., Montine T. J., McMillan P. J., Tsuang D. W., Jin J., Pan C., Shin J., Zhu D., and Zhang J. (2007) Proteomic identification of novel proteins in cortical lewy bodies. Brain Pathol. 17, 139–145 [DOI] [PMC free article] [PubMed] [Google Scholar]
- 32. Liao L., Cheng D., Wang J., Duong D. M., Losik T. G., Gearing M., Rees H. D., Lah J. J., Levey A. I., and Peng J. (2004) Proteomic characterization of postmortem amyloid plaques isolated by laser capture microdissection. J. Biol. Chem. 279, 37061–37068 [DOI] [PubMed] [Google Scholar]
- 33. Wang Q., Woltjer R. L., Cimino P. J., Pan C., Montine K. S., Zhang J., and Montine T. J. (2005) Proteomic analysis of neurofibrillary tangles in Alzheimer disease identifies GAPDH as a detergent-insoluble paired helical filament tau binding protein. FASEB J. 19, 869–871 [DOI] [PubMed] [Google Scholar]
- 34. Selmaj K., Pawłowska Z., Walczak A., Koziołkiewicz W., Raine C. S., and Cierniewski C. S. (2008) Corpora amylacea from multiple sclerosis brain tissue consists of aggregated neuronal cells. Acta Biochim. Pol. 55, 43–49 [PubMed] [Google Scholar]
- 35. Mustafa D. A. M., Dekker L. J., Stingl C., Kremer A., Stoop M., Sillevis Smitt P. A. E., Kros J. M., and Luider T. M. (2012) A proteome comparison between physiological angiogenesis and angiogenesis in glioblastoma. Mol. Cell. Proteomics MCP 11, M111.008466. [DOI] [PMC free article] [PubMed] [Google Scholar]
- 36. Fang X., Wang C., Balgley B. M., Zhao K., Wang W., He F., Weil R. J., and Lee C. S. (2012) Targeted tissue proteomic analysis of human astrocytomas. J. Proteome Res. 11, 3937–3946 [DOI] [PMC free article] [PubMed] [Google Scholar]
- 37. Traaseth N., Elfering S., Solien J., Haynes V., and Giulivi C. (2004) Role of calcium signaling in the activation of mitochondrial nitric oxide synthase and citric acid cycle. Biochim. Biophys. Acta 1658, 64–71 [DOI] [PubMed] [Google Scholar]
- 38. Ong S.-B., and Hausenloy D. J. (2010) Mitochondrial morphology and cardiovascular disease. Cardiovasc. Res. 88, 16–29 [DOI] [PMC free article] [PubMed] [Google Scholar]
- 39. Youle R. J., and van der Bliek A. M. (2012) Mitochondrial fission, fusion, and stress. Science 337, 1062–1065 [DOI] [PMC free article] [PubMed] [Google Scholar]
- 40. Flippo K. H., and Strack S. (2017) Mitochondrial dynamics in neuronal injury, development and plasticity. J. Cell Sci. 130, 671–681 [DOI] [PMC free article] [PubMed] [Google Scholar]
- 41. Gomes C. V., Kaster M. P., Tomé A. R., Agostinho P. M., and Cunha R. A. (2011) Adenosine receptors and brain diseases: neuroprotection and neurodegeneration. Biochim. Biophys. Acta 1808, 1380–1399 [DOI] [PubMed] [Google Scholar]
- 42. Chao X., Fei F., and Fei Z. (2010) The role of excitatory amino acid transporters in cerebral ischemia. Neurochem. Res. 35, 1224–1230 [DOI] [PubMed] [Google Scholar]
- 43. Rothstein J. D., Martin L., Levey A. I., Dykes-Hoberg M., Jin L., Wu D., Nash N., and Kuncl R. W. (1994) Localization of neuronal and glial glutamate transporters. Neuron 13, 713–725 [DOI] [PubMed] [Google Scholar]
- 44. Mennerick S., Dhond R. P., Benz A., Xu W., Rothstein J. D., Danbolt N. C., Isenberg K. E., and Zorumski C. F. (1998) Neuronal expression of the glutamate transporter GLT-1 in hippocampal microcultures. J. Neurosci. Off. J. Soc. Neurosci. 18, 4490–4499 [DOI] [PMC free article] [PubMed] [Google Scholar]
- 45. Schmitt A., Asan E., Lesch K.-P., and Kugler P. (2002) A splice variant of glutamate transporter GLT1/EAAT2 expressed in neurons: cloning and localization in rat nervous system. Neuroscience 109, 45–61 [DOI] [PubMed] [Google Scholar]
- 46. Rothstein J. D., Patel S., Regan M. R., Haenggeli C., Huang Y. H., Bergles D. E., Jin L., Dykes Hoberg M., Vidensky S., Chung D. S., Toan S. V., Bruijn L. I., Su Z.-Z., Gupta P., and Fisher P. B. (2005) Beta-lactam antibiotics offer neuroprotection by increasing glutamate transporter expression. Nature 433, 73–77 [DOI] [PubMed] [Google Scholar]
- 47. Romera C., Hurtado O., Botella S. H., Lizasoain I., Cárdenas A., Fernández-Tomé P., Leza J. C., Lorenzo P., and Moro M. A. (2004) In vitro ischemic tolerance involves upregulation of glutamate transport partly mediated by the TACE/ADAM17-tumor necrosis factor-alpha pathway. J. Neurosci. 24, 1350–1357 [DOI] [PMC free article] [PubMed] [Google Scholar]
- 48. Martin L. J., Brambrink A. M., Lehmann C., Portera-Cailliau C., Koehler R., Rothstein J., and Traystman R. J. (1997) Hypoxia-ischemia causes abnormalities in glutamate transporters and death of astroglia and neurons in newborn striatum. Ann. Neurol. 42, 335–348 [DOI] [PubMed] [Google Scholar]
- 49. Fukamachi S., Furuta A., Ikeda T., Ikenoue T., Kaneoka T., Rothstein J. D., and Iwaki T. (2001) Altered expressions of glutamate transporter subtypes in rat model of neonatal cerebral hypoxia-ischemia. Brain Res. Dev. Brain Res. 132, 131–139 [DOI] [PubMed] [Google Scholar]
- 50. Rao V. L., Bowen K. K., and Dempsey R. J. (2001) Transient focal cerebral ischemia down-regulates glutamate transporters GLT-1 and EAAC1 expression in rat brain. Neurochem. Res. 26, 497–502 [DOI] [PubMed] [Google Scholar]
- 51. Beschorner R., Simon P., Schauer N., Mittelbronn M., Schluesener H. J., Trautmann K., Dietz K., and Meyermann R. (2007) Reactive astrocytes and activated microglial cells express EAAT1, but not EAAT2, reflecting a neuroprotective potential following ischaemia. Histopathology 50, 897–910 [DOI] [PubMed] [Google Scholar]
- 52. Yatomi Y., Tanaka R., Shimura H., Miyamoto N., Yamashiro K., Takanashi M., Urabe T., and Hattori N. (2013) Chronic brain ischemia induces the expression of glial glutamate transporter EAAT2 in subcortical white matter. Neuroscience 244, 113–121 [DOI] [PubMed] [Google Scholar]
- 53. Green A. R., Hainsworth A. H., and Jackson D. M. (2000) GABA potentiation: a logical pharmacological approach for the treatment of acute ischaemic stroke. Neuropharmacology 39, 1483–1494 [DOI] [PubMed] [Google Scholar]
- 54. Kim H. J., Hwang I. K., and Won M. H. (2007) Vanillin, 4-hydroxybenzyl aldehyde and 4-hydroxybenzyl alcohol prevent hippocampal CA1 cell death following global ischemia. Brain Res. 1181, 130–141 [DOI] [PubMed] [Google Scholar]
- 55. Schwab C., Yu S., Wong W., McGeer E. G., and McGeer P. L. (2013) GAD65, GAD67, and GABAT immunostaining in human brain and apparent GAD65 loss in Alzheimer's disease. J. Alzheimers Dis. JAD 33, 1073–1088 [DOI] [PubMed] [Google Scholar]
- 56. Sun S., Zhang Z., Sinha R., Karni R., and Krainer A. R. (2010) SF2/ASF autoregulation involves multiple layers of post-transcriptional and translational control. Nat. Struct. Mol. Biol. 17, 306–312 [DOI] [PMC free article] [PubMed] [Google Scholar]
- 57. Long J. C., and Caceres J. F. (2009) The SR protein family of splicing factors: master regulators of gene expression. Biochem. J. 417, 15–27 [DOI] [PubMed] [Google Scholar]
- 58. Nowak D. G., Amin E. M., Rennel E. S., Hoareau-Aveilla C., Gammons M., Damodoran G., Hagiwara M., Harper S. J., Woolard J., Ladomery M. R., and Bates D. O. (2010) Regulation of vascular endothelial growth factor (VEGF) splicing from pro-angiogenic to anti-angiogenic isoforms: a novel therapeutic strategy for angiogenesis. J. Biol. Chem. 285, 5532–5540 [DOI] [PMC free article] [PubMed] [Google Scholar]
- 59. Finley J. (2014) Alteration of splice site selection in the LMNA gene and inhibition of progerin production via AMPK activation. Med. Hypotheses 83, 580–587 [DOI] [PubMed] [Google Scholar]
- 60. Koizumi J., Okamoto Y., Onogi H., Mayeda A., Krainer A. R., and Hagiwara M. (1999) The subcellular localization of SF2/ASF is regulated by direct interaction with SR protein kinases (SRPKs). J. Biol. Chem. 274, 11125–11131 [DOI] [PubMed] [Google Scholar]
- 61. Tripathi V., Song D. Y., Zong X., Shevtsov S. P., Hearn S., Fu X.-D., Dundr M., and Prasanth K. V. (2012) SRSF1 regulates the assembly of pre-mRNA processing factors in nuclear speckles. Mol. Biol. Cell 23, 3694–3706 [DOI] [PMC free article] [PubMed] [Google Scholar]
- 62. Gonçalves V., Henriques A. F. A., Henriques A., Pereira J. F. S., Pereira J., Neves Costa A., Moyer M. P., Moita L. F., Gama-Carvalho M., Matos P., and Jordan P. (2014) Phosphorylation of SRSF1 by SRPK1 regulates alternative splicing of tumor-related Rac1b in colorectal cells. RNA N. Y. N 20, 474–482 [DOI] [PMC free article] [PubMed] [Google Scholar]
- 63. Erdö F., Trapp T., Mies G., and Hossmann K.-A. (2004) Immunohistochemical analysis of protein expression after middle cerebral artery occlusion in mice. Acta Neuropathol. 107, 127–136 [DOI] [PubMed] [Google Scholar]
- 64. Ando H., Kawaai K., and Mikoshiba K. (2014) IRBIT: a regulator of ion channels and ion transporters. Biochim. Biophys. Acta 1843, 2195–2204 [DOI] [PubMed] [Google Scholar]
- 65. Mikoshiba K. (2006) Inositol 1,4,5-trisphosphate IP(3) receptors and their role in neuronal cell function. J. Neurochem. 97, 1627–1633 [DOI] [PubMed] [Google Scholar]
- 66. Balami J. S., Chen R.-L., Grunwald I. Q., and Buchan A. M. (2011) Neurological complications of acute ischaemic stroke. Lancet Neurol. 10, 357–371 [DOI] [PubMed] [Google Scholar]
- 67. Castillo J., Dávalos A., and Noya M. (1997) Progression of ischaemic stroke and excitotoxic aminoacids. Lancet 349, 79–83 [DOI] [PubMed] [Google Scholar]
- 68. Vila N., Castillo J., Dávalos A., and Chamorro A. (2000) Proinflammatory cytokines and early neurological worsening in ischemic stroke. Stroke 31, 2325–2329 [DOI] [PubMed] [Google Scholar]
- 69. García-Berrocoso T., Giralt D., Bustamante A., Llombart V., Rubiera M., Penalba A., Boada C., Espadaler M., Molina C., and Montaner J. (2014) Role of beta-defensin 2 and interleukin-4 receptor as stroke outcome biomarkers. J. Neurochem. 129, 463–472 [DOI] [PubMed] [Google Scholar]
- 70. Rosell A., Alvarez-Sabín J., Arenillas J. F., Rovira A., Delgado P., Fernández-Cadenas I., Penalba A., Molina C. A., and Montaner J. (2005) A matrix metalloproteinase protein array reveals a strong relation between MMP-9 and MMP-13 with diffusion-weighted image lesion increase in human stroke. Stroke 36, 1415–1420 [DOI] [PubMed] [Google Scholar]
Associated Data
This section collects any data citations, data availability statements, or supplementary materials included in this article.
Supplementary Materials
Data Availability Statement
The mass spectrometry proteomics data generated in this work has been deposited to the ProteomeXchange Consortium (http://www.proteomexchange.org/) via the PRIDE partner repository with the dataset identifier PXD003519 and 10.6019/PXD003519.