More than 25% of adults in the U.S. are obese,1 contributing to 300,000 deaths and costing the U.S. healthcare system $147 billion annually.2 A range of institutions, from federal governments to local nonprofit agencies, have implemented policy and built-environment changes in efforts to reduce obesity and increase physical activity. A challenge in evaluating the success of policy and built-environment change is the capacity to capture a priori physical activity behaviors and to eliminate researcher and respondent bias in assessing postchange environments. This research letter presents a novel transdisciplinary collaboration between public health and computer science, developed with the goal of automatically analyzing existing public data feeds in innovative ways to quantify built-environment intervention effectiveness.
The Archive of Many Outdoor Scenes (AMOS) has collected more than 225 million images of outdoor environments from more than 12,000 public webcams since 2006.3 AMOS uses publicly available webcams and a custom web crawler (similar to a web search engine or Google) to capture webcam images with a time stamp, capturing one photographic image per camera every half hour.4 Many of these environments have been affected by built-environment improvements or policy change (e.g., complete street policies, bike-share programs, and walking school bus programs). AMOS provides a unique opportunity to measure built-environment change and associated behavioral modification. Available webcams were matched spatially with policy and built-environment changes, identifying pilot areas in the U.S. that have instituted built-environment change since 2006.
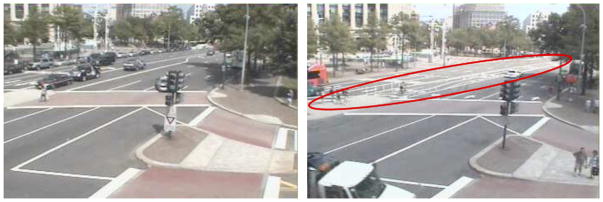
One example is the addition of protected bike lanes and a bike-share program in Washington DC, during 2009–2010. An AMOS webcam captured an example built-environment change (addition of cycle paths; Figure 1) at the intersection of Pennsylvania Avenue NW and 9th Street NW. Using the AMOS data set, all 120 webcam photographs were captured from between 7:00AM and 7:00PM during the first work week of June 2009; the 120 photographs taken during the same week in June 2010 also were captured. The use of this webcam data allowed for a pre–post cycle path travel-mode analysis.
Figure 1.
Images of cycle traffic before (left; 2009) and after (right; 2010) construction of a cycling path
Note: Photos show the intersection of Pennsylvania Avenue NW and 9th Street NW, Washington DC; photos courtesy of the web archive: Archive of Many Outdoor Scenes (AMOS).
The Amazon Mechanical Turk (MTurk) website was used to crowd-source the image annotation.5 MTurks are simple tasks that have not yet been automated by computers. MTurk workers were paid $0.01 in March 2012 to mark each pedestrian, cyclist, and vehicle in a photograph. Each image was counted five unique times (n=1200), a process completed in less than 8 hours. Counts per transportation mode were downloaded to SPSS, version 19, for analysis in April 2012.
The odds of observing each transportation mode in Year 2 compared to Year 1 was examined and a multivariate ANOVA was conducted to establish overall mode variance between the years. With five unique workers, the range and variance of counts differed per photo. A test for difference in variation between the 2 years was not significantly different for any one travel mode. Recent research has revealed MTurk workers to be reliable.6,7
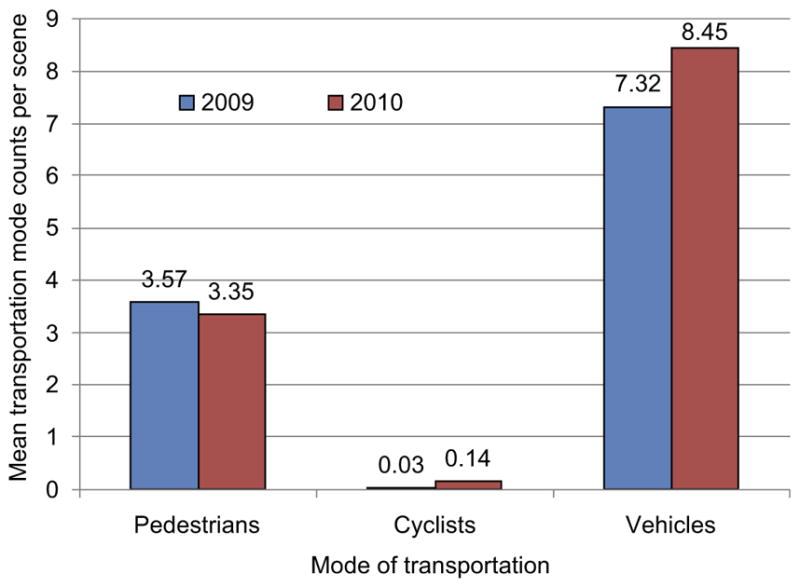
The odds of the webcam at Pennsylvania Avenue NW and 9th Street NW capturing a cyclist present in the scene in 2010 increased by 3.5 times compared to 2009 (OR=3.57, p<0.001). The number of cyclists per scene increased fourfold between 2009 (M=0.03, SD=0.20) and 2010 (M=0.14, SD=0.90), F(36.72, 1198), p=0.002, the same period in which the addition of a new cycle path was captured in the webcam scene. There was not an increase in pedestrians between years, but there was an increase in number of vehicles (F=16.81, 1198, p<0.001; Figure 2). Overall, the multivariate ANOVA test revealed a difference in transportation-mode share between the 2 years, F(3, 1196)=11.265, p<0.001. The findings suggest that publicly available web data feeds and crowd-sourcing have great potential for capturing behavioral change associated with built environments.
Figure 2.

Graph showing increase in cycling (p30.001) between 2009 and 2010
Note: Data reflect travel mode used at the intersection of Pennsylvania Avenue NW and 9th Street NW, Washington DC.
This initial evaluation indicates that this novel mode of research presents an unobtrusive method of surveillance of the effectiveness of a physical activity policy and built-environment intervention. The use of public webcam scenes and MTurks offers an inexpensive ($12.00) means for public health workers, urban designers, and governments to evaluate effectiveness of built-environment policy change and interventions. Future research plans include testing with additional bike-lane scenes in Washington DC, and expanding to include parks and safe routes to schools. Current efforts also are focused on the utilization of computer algorithms to automate the counting of transportation modes per scene.
Acknowledgments
The authors acknowledge the Washington University in St. Louis University Research Strategic Alliance for providing the funding for this cross-university research.
Footnotes
No financial disclosures were reported by the authors of this research letter.
References
- 1.CDC, Division of Nutrition, Physical Activity and Obesity. 2009 www.cdc.gov/obesity/data/facts.html.
- 2.Finkelstein E, Trogdon J, Cohen J, Dietz W. Annual medical spending attributable to obesity: payer-and service-specific estimates. Health Aff. 2009;28(5):822–31. doi: 10.1377/hlthaff.28.5.w822. [DOI] [PubMed] [Google Scholar]
- 3.Pless R, Jacobs N. The Archive of Many Outdoor Scenes. 2006 amosweb.cse.wustl.edu/
- 4.Jacobs N, Burgin W, Fridrich N, et al. The global network of outdoor webcams: properties and applications. ACM International Conference on Advances in Geographic Information Systems (SIGSPATIAL GIS); 2009; pp. 111–20. [Google Scholar]
- 5.Bohannon J. Social science for pennies. Science. 2011;334:307. doi: 10.1126/science.334.6054.307. [DOI] [PubMed] [Google Scholar]
- 6.Mason W, Suri S. Conducting behavioral research on Amazon’s Mechanical Turk. Behavior Res Methods. 2012;44(1):1–23. doi: 10.3758/s13428-011-0124-6. [DOI] [PubMed] [Google Scholar]
- 7.Buhrmester M, Kwang T, Gosling SD. Amazon’s Mechanical Turk. Perspect Psychol Sci. 2011;6(1):3–5. doi: 10.1177/1745691610393980. [DOI] [PubMed] [Google Scholar]


