

Abstract
Background
The “fetal-origins-of-adult-disease” hypothesis proposes that an unfavorable intrauterine environment, estimated from small birth size, may induce permanent changes in fetal organs, including the brain. These changes in combination with effects of (cardiovascular) exposures during adult life may condition the later risk of brain atrophy. We investigated the combined effect of small birth size and mid-life cardiovascular risk on late-life brain volumes.
Methods and Findings
Archived birth records of weight and height were abstracted for 1348 participants of the AGES-Reykjavik (2002-2006) population-based cohort, who participated jn the original cohort of the Reykjavik Study (RS; baseline 1967). Mid-life cardiovascular risk factors (CVRF) were collected in the RS. As a part of the late-life AGES-Reykjavik exam a brain MRI was acquired and from it, volumes of total brain (TB), gray matter, white matter, and white matter lesions were estimated. Adjusting for intracranial volume, demographics, and education showed small birth size (low Ponderal Index (PI)) and increased mid-life cardiovascular risk had an additive effect on having smaller late-life brain volumes. Compared with the reference group (high PI/absence of mid-life CVRF), participants with lower PI/presence of mid-life CVRF (BMI>25kg/m2, hypertension, diabetes, ‘ever smokers’) had smaller TB volume later in life; B (95%CI) were -10.9mL (-21.0; -0.9), -10.9mL (-20.4; -1.4), -20.9mL (-46.9; 5.2), and -10.8mL (-19.3; -2.2) respectively.
Conclusions
These results suggest that exposure to an unfavorable intrauterine environment contributes to the trajectory towards smaller brain volume, adding to the atrophy that may be associated with mid-life cardiovascular risk.
Introduction
Brain tissue loss, which is an important feature of the aging brain, is most likely not determined in any single time period throughout life, but results from the complex interplay between exposures throughout the life course [1]. The challenge is to identify the nature and timing of environmental contributions and seek time windows in which an exposure can have adverse or protective effects on development and subsequent disease outcome [2].
With respect to the brain, it has been well established that exposure to cardiovascular risk factors in mid-life increases risk of brain pathology and brain tissue loss later in life [3-5]. These findings suggest that the optimal time-window to prevent brain tissue loss by treating vascular risk factors is middle-age. Moving further back in life, the “fetal origins of adult disease” hypothesis proposes that an unfavorable intrauterine environment, suggested by small birth size, may induce permanent changes in fetal organs [6,7], that in combination with effects of environmental exposures during childhood and adult life may condition the later risk of disease, particularly cardiovascular diseases [8]. Based on data from the AGES-Reykjavik Study, we have recently reported that small birth size, as defined by a lower Ponderal Index (PI), was associated with smaller brain volumes and reduced cognitive function at old age [9], which is consistent with the fetal origins of disease. We further extend these findings by investigating whether small birth size modulates the association of CVRF and late-life brain atrophy, as an indicator of diffuse pathology in the brain.
Methods
AGES-Reykjavik Study and study sample
The Age, Gene/Environment Susceptibility – Reykjavik Study (AGES-Reykjavik), aimed to investigate the genetic and environmental factors contributing to clinical and subclinical disease at older age, is a continuation of the Reykjavik Study. The Reykjavik Study (1967-1996) was initiated by the Icelandic Heart Association and included men and women born in 1907–1935 and living in the Reykjavik area. By design, the cohort was sub-divided into 6 sub-cohorts, each of which was examined from one to six times. The mid-life data reported here, were obtained from the study exam closest to the time the participant was 50 years of age. From September 2002 to February 2006, new data were collected for the AGES-Reykjavik Study in 5,764 participants randomly selected from the survivors of the Reykjavik Study. The study design and initial assessments of the cohort have been described previously [10]. Data on body size at birth were extracted from the original mid-wife birth records for 4,828 individuals born in the greater Reykjavik area between 1914-1935 and who participated in the Reykjavik study [11,12].
The AGES-Reykjavik was approved by the Icelandic National Bioethics Committee (VSN 00-063) and by the Institutional Review Board of the U.S. National Institute on Aging, National Institutes of Health. An informed consent was signed by all participants.
Birth size
Data on birth weight, length, and information on preterm, singleton or multiple births were extracted from the original midwife's birth records obtained from the National Archives of Iceland, Reykjavik. Birth weight was recorded to the nearest 0.05 kg and length in centimeters from crown to heel. Pre-term births were not identified clearly in the birth records, but at the time of the births, the method used to define pre-term newborns was a birth length less than 48 cm [11,12]. Ponderal Index (PI), an indicator of fetal growth status, was calculated as birth weight (kg) divided by birth length to the third power (m3). Low PI, defined as the lowest tertile (<24.3kg/m3), indicates having soft tissue mass below normal for the stage of skeletal development, in other words it measures thinness at birth [13]. We previously found low PI, but not small birth weight and short birth length, was associated with smaller relative TB brain volume (Table 2)[9]. Therefore in these analyses we focus on PI as the indicator of birth size.
Table 2.
Mean difference (95% CI) in late-life brain volumes (mL) for categories of Ponderal Index at birth and mid-life and late-life cardiovascular risk factors in 1,348 subjects.
| Total brain tissue volume | Gray matter volume | White matter volume | Ln WMH volume | |
|---|---|---|---|---|
|
| ||||
| B (95% CI)‡ | B (95% CI)‡ | B (95% CI)‡ | B (95% CI)‡ | |
| Birth size measures | ||||
| Birth weight, low vs. high § | -1.6 (-9.2; 5.0) | -0.7 (-6.2; 4.7) | -0.9 (-4.4; 2.5) | 0.04 (-0.06; 0.15) |
| Birth length, low vs. high § | 2.4 (-4.4; 9.3) | 0.9 (-4.7; 6.6) | 1.4 (-2.2; 4.9) | 0.02 (-0.09; 0.13) |
| Ponderal Index, low vs. high § | -6.1 (-13.5; 0.1)† | -3.7 (-9.8; 2.4) | -0.7 (-4.5; 3.2) | -0.10 (-0.22; 0.02) |
| Mid-life vascular risk | ||||
| Overweight, yes vs. no | -4.3 (-10.3; 1.6) | 2.9 (-2.0; 7.8) | -7.1 (-10.2; -4.0)* | -0.02 (-0.11; 0.08) |
| Hypertension, yes vs. no | -5.9 (-11.9; -0.2)* | -3.3 (-8.4; 1.7) | -3.8 (-7.0; -0.7)* | 0.03 (-0.07; 0.13) |
| Dysglycemia, yes vs. no | -0.3 (-1.3; 0.8) | -0.3 (-1.2; 0.6) | 0.0 (-0.5; 0.6) | 0.00 (-0.01; 0.02) |
| Dyslipidemia, yes vs. no | -0.2 (-1.2; 0.9) | -0.0 (-0.9; 0.8) | -0.1 (-0.6; 0.5) | -0.00 (-0.02; 0.01) |
| Smoking, yes vs. no | -7.9 (-14.0; -1.9)* | -8.2 (-13.2; -3.3)* | -2.8 (-5.9; 0.4) | 0.13 (0.04; 0.23)* |
P<0.05,
P=0.06.
Adjusted for age, sex, education, late-life ICV.
low birth weight: <3.5kg, low birth length: <51cm, low Ponderal Index: <24.3 kg/m3
Mid-life vascular risk
As part of the Reykjavik study, participants were asked to fill out a standardized questionnaire including information on medical history, medication use, and lifestyle factors and a fasting blood sample was drawn [10]. At mid-life weight and height was measured and body mass index (BMI) (kg/m2) was calculated. WHO criteria for overweight and obesity were combined and defined as a BMI >25kg/m2[14]. Blood pressure (BP) was measured in a sitting position and hypertension was defined as antihypertensive treatment, and/or systolic BP >140mmHg, and/or diastolic BP >90mmHg. Diabetes was defined as having a self-report history of physician-diagnosed diabetes, using glucose-modifying medication or fasting glucose of ≥126mg/dL. Since the prevalence of diabetes at mid-life was very low (1.0%), mid-life dysglycemia was defined as having diabetes or as having impaired fasting glucose levels as defined by the ADA(100-125mg/dL) [15]. Smoking was classified into never vs. ever (former/current). Dyslipidemia was defined as a total cholesterol level ≥240mg/dL.
Late-life brain volumes
Magnetic resonance (MR) images were acquired on a study-dedicated 1.5-T Sign Twinspeed EXCITE system (General Electric Medical Systems, Waukesha, WI) and were made during the late-life examination as part of the AGES-Reykjavik Study. The structural image protocol included a T1-weighted 3D spoiled gradient echo sequence (time to echo [TE] 8 ms; repetition time [TR] 21 ms; flip angle [FA] 30; field of view [FOV], 240 mm; matrix, 256×256; slice thickness, 1.5 mm), a proton density/T2-weighted fast spin-echo sequence (TE1, 22 ms; TE2, 90 ms; TR, 3220 ms; echo train length, 8; FA, 90° FOV, 220 mm; matrix, 256×256; slice thickness, 3 mm), a fluid attenuated inversion recovery (FLAIR) sequence (TE, 100 ms; TR, 8000 ms; inversion time, 2000 ms; FA, 90°; FOV, 220 mm; matrix, 256×256), and a T2*-weighted gradient-echo type echo-planar sequence (TE, 50 ms; TR, 3050 ms; FA, 90°; FOV, 220 mm; matrix, 256×256; slice thickness, 3 mm).
Brain tissue volumes (mL), including gray matter (GM), white matter (WM), cerebral spinal fluid (CSF), and white matter hyperintensities (WMH), were generated separately, using the multispectral MR images and a high-throughput automatic image analysis pipeline, which is based on the Montreal Neurological Institute (MNI) pipeline and optimized for use in the AGES-Reykjavik Study (AGES-RS/MNI pipeline) (Figure 1) [16,17]. The key processing stages were as follows: stereotaxic registration was achieved after signal nonuniformity correction by an affine transformation of the T1-weighted images to the ICBM152 template. Intersequence registration was performed by registering images from the individual (T2/proton density, fluid-attenuated inversion recovery) sequences to the T1-weighted images in order to accurately align all image volumes acquired during an acquisition session. Linear signal intensity normalization was then applied to correct for signal intensity variations across images in the different sequences. Total brain (TB) parenchymal volume was computed as the sum of GM, WM, and WMH volumes. Total intracranial volume (ICV) was computed as the sum of TB and CSF volumes. Finally, as described previously [17] tissue classification was achieved with an artificial neural network classifier in the four dimensional intensity space defined by the four sequences (FLAIR, T1-, PD-, and T2-weighted). The absolute volumes of the 4 tissue types (GM, WM, CSF, and WMH) were subsequently calculated and converted to native space volumes using the scale factor obtained from the stereotaxic registration transformation [17]. The reproducibility of the entire process generating the tissue volumes, including the image acquisition and the automatic pipeline, was assessed based on repeated scans of subjects (n = 32) in the study cohort. Each subject was scanned four times in two visits (twice in each visit) with an average of 2 weeks' time between visits. Based on all four scans, intra-class correlation (r) and coefficient of variation (CoV) was estimated for the mean volume of each tissue type separately, TB volume and ICV using a repeated measures model with a compound symmetry covariance structure. The results were as following: ICV, percent CoV = 1.2% and r = 0.99; TB, CoV = 0.7% and r = 0.99; GM, CoV = 1.1% and r = 0.98; WM, CoV = 1.8% and r = 0.99; CSF, CoV = 4.0% and r = 0.98 and WMH, CoV = 4.3% and r = 0.99.
Figure 1.
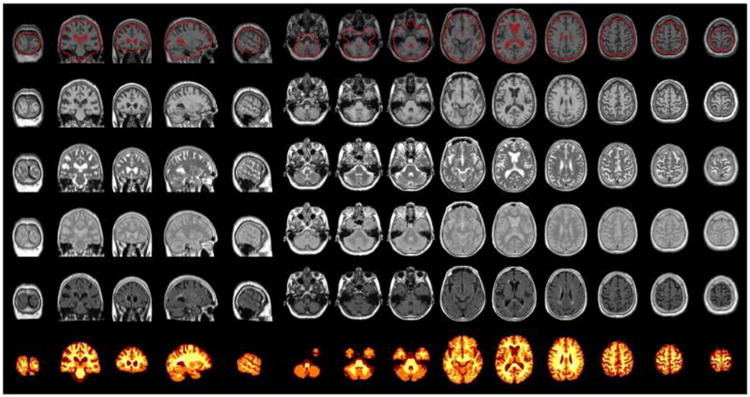
Example of a verification image from the pipeline. Top row: The quality of the stereotaxic registration of the T1-weighted 3D SPGR images to the ICBM152 template. Rows 2–5: T1-, T2-, PD-weighted and FLAIR images after all pre-processing and registration stages. Bottom row: Tissue classification image.
Other variables
At late-life, individuals were asked about their occupation and their lifetime education. Education was categorized into primary school, secondary school, college, and university. Occupation was categorized into ‘homemaker/ miscellaneous’, ‘manual’, ‘service workers’, and ‘professional’ [18].
Analytical sample
Of the 4,828 original Reykjavik cohort participants with available birth records, 1,682 (35%) participated in the AGES-Reykjavik study, including 1,348 individuals with brain volume data. Compared to data published for the whole Reykjavik population with birth record data (N=4,828), the individuals in the analytical sample had similar birth size and mid-life body size [12]. Compared to the total AGES-Reykjavik sample with brain MRI (N=4,614), the individuals in the analytical sample were younger (75 vs. 76yrs), higher educated (% low: 18 vs. 24%), and had somewhat larger ICV (1511 vs. 1501mL) and TB volume (1087 vs. 1079mL).
Data-analysis
Subject characteristics at birth, mid-life, and late-life were calculated for the total population (N=1,348) and according to tertiles of PI. Linear regression analysis and analysis of covariance (ANCOVA) adjusted for age, sex, education, and late-life ICV were used to examined the separate effects of categories of birth size measures (lowest tertile vs. higher 2 tertiles) and categories of mid-life cardiovascular risk factors (overweight yes vs. no, hypertension yes vs. no, dysglycemia yes vs. no, dyslipidemia yes vs. no, or smoking yes vs. no) on brain volume measures (TB, GM, WM, and WMH). To investigate the joint effect of birth size and vascular risk on late-life brain volumes by creating dummy variables for the joint exposure to both small birth size and each mid-life cardiovascular risk factor, with large birth size and absence of mid-life cardiovascular risk factor as the reference category. To test whether the interactions between birth size and the vascular risk factors were more than additive [i.e., together they were associated with an even lower brain volume then the sum of the two factors separately], the independent variables and their cross-product term were incorporated in the same model. These analyses were adjusted for age, sex, education, and late-life ICV.
Results
In the study sample of 1,348, mean (range) age was 75 years (66-90) and 58% were women. Compared to individuals with higher Ponderal Index (PI) at birth, by definition those with lower PI had lower birth weight and longer birth length (Table 1). Furthermore, those with lower PI were somewhat younger at the mid-life and late-life examinations (Table 1). No large differences were found for mid-life cardiovascular risk factors across categories of PI.
Table 1. Characteristics of the total population (N=1,348) and for tertiles of Ponderal Index.
| Ponderal Index (tertiles)* | Total | ||||
|---|---|---|---|---|---|
|
| |||||
| 1st (N=449) | 2nd (N=398) | 3rd (N=501) | N=1,348 | ||
| General & birth characteristics | |||||
| Sex (% female) | 56% | 59% | 58% | 58% | |
| Education (%) | Primary | 19% | 20% | 18% | 19% |
| Secondary | 53% | 53% | 49% | 52% | |
| College-University | 28% | 27% | 33% | 29% | |
| Occupation (%) | Homemaker/miscellaneous | 41% | 42% | 44% | 43% |
| Manual | 12% | 15% | 15% | 14% | |
| Services | 26% | 24% | 23% | 24% | |
| Professional | 21% | 19% | 18% | 19% | |
| Birth weight (kg) | 3.5 (0.5) | 3.7 (0.4) | 4.0 (0.5) | 3.7 (0.5) | |
| Birth length (cm) | 53.5 (2.8) | 52.3 (2.1) | 51.7 (2.2) | 52.5 (2.5) | |
| Mid-life characteristics | |||||
| Age (yrs) | 49 (6) | 50 (6) | 51 (6) | 50 (6) | |
| Height (cm) | 171 (9) | 171 (9) | 171 (9) | 171 (9) | |
| Weight (kg) | 73 (13) | 74 (13) | 74 (13) | 74 (13) | |
| Overweight (BMI>25kg/m2), % | 30% | 38% | 38% | 35% | |
| Hypertension, % | 34% | 33% | 37% | 35% | |
| Dysglycemia, % | 3.6% | 3.0% | 2.0% | 2.9% | |
| Dyslipidemia, % | 44% | 47% | 48% | 46% | |
| Smoking, % current/former | 65% | 66% | 60% | 64% | |
| Late-life characteristics | |||||
| Age (yrs) | 74 (5) | 75 (5) | 77 (5) | 75 (5) | |
| Intracranial volume (mL) | 1510 (142) | 1500 (143) | 1520 (152) | 1511 (146) | |
Tertiles of Ponderal Index: (1st) 15.1 – 24.3 kg/m3, (2nd) 24.3 – 26.7 kg/m3, (3rd) 26.7 – 43.7 kg/m3
At late-life, mean (SD) intracranial volume was 1,510mL (146) and mean (SD) TB, GM, and WM were 1,085mL (102), 678mL (64), and 387mL (48), respectively. Median (interquartile range) WMH volume was 14mL (7-25). Overweight and hypertension at mid-life were significantly associated with smaller late-life brain volumes, particularly smaller WM volume (Table 2). Mid-life smoking was associated with smaller TB and GM volumes and larger WMH volume. Dysglycemia and dyslipidemia at mid-life were not associated with brain volumes.
Small birth size (low PI)and increased mid-life cardiovascular risk had an additive effect on having smaller late-life brain volumes (Table 3, Figure 2). Compared with the reference group (high PI and absence of mid-life cardiovascular risk factor), individuals with lower PI and mid-life overweight/obesity or mid-life hypertension had significantly smaller TB and WM volume (Table 3). Also, compared with the reference group, individuals with low PI and mid-life dysglycemia had significantly smaller GM volume and larger WMH volumes, and smaller non-significant associations were found for TB and WM volumes (Table 3). Finally, the combined effect of low PI and mid-life smoking was significantly associated with smaller TB and GM volumes and larger WMH volume (Table 3). When testing the interaction (‘more than additive’), we found that the combined effect of low PI at birth and mid-life cardiovascular risk on brain volumes was not more than additive(P-values for all interaction were>0.10).
Table 3.
Mean differences (95% CI) in late-life brain volumes (mL) for combined categories of Ponderal Index (PI) at birth and mid-life cardiovascular risk factors in 1,348 subjects.
| N | Total brain tissue volume | Gray matter volume | White matter volume | Ln WMH volume | |
|---|---|---|---|---|---|
|
| |||||
| B (95% CI)† | B (95% CI) † | B (95% CI) † | B (95% CI) † | ||
| Birth Ponderal Index & mid-life overweight | |||||
| High PI & not overweight | 559 | Reference | Reference | Reference | Reference |
| Low PI & not overweight | 313 | 0.2 (-7.2; 7.6) | 0.0 (-6.1; 6.2) | 0.3 (-3.5; 4.2) | -0.03 (-0.14; 0.09) |
| High PI & overweight | 342 | -1.5 (-8.7; 5.6) | 4.6 (-1.3; 10.5) | -6.2 (-10.0; -2.6)* | -0.00 (-0.12; 0.11) |
| Low PI & overweight | 134 | -10.9 (-21.0; -0.9)* | -1.6 (-9.9; 6.7) | -8.3 (-13.5; -3.1)* | -0.10 (-0.26; 0.06) |
| Birth Ponderal Index & mid-life hypertension | |||||
| High PI & no hypertension | 582 | Reference | Reference | Reference | Reference |
| Low PI & no hypertension | 317 | 0.3 (-7.2; 7.7) | -1.0 (-7.2; 5.2) | 1.8 (-2.1; 5.7) | -0.08 (-0.19; 0.04) |
| High PI & hypertension | 297 | -3.4 (-10.8; 3.9) | -2.3 (-8.4; 3.7) | -2.4 (-6.2; 1.5) | 0.01 (-0.11; 0.13) |
| Low PI & hypertension | 152 | -10.9 (-20.4; -1.4)* | -6.4 (-14.3; 0.4) | -5.6 (-10.5; -0.6)* | 0.02 (-0.14; 0.17) |
| Birth Ponderal Index & mid-life dysglycemia | |||||
| High PI & no dysglycemia | 878 | Reference | Reference | Reference | Reference |
| Low PI & no dysglycemia | 432 | -1.8 (-8.0; 4.4) | -1.4 (-6.5; 3.8) | 0.5 (-2.8; 3.7) | -0.07 (-0.17; 0.03) |
| High PI & dysglycemia | 22 | -0.9 (-23.2; 21.5) | -0.6 (-19.0; 17.8) | 1.5 (-10.1; 13.2) | -0.21 (-0.56; 0.15) |
| Low PI & dysglycemia | 16 | -20.9 (-46.9; 5.2) | -20.9 (-42.4; -0.6)* | -10.7 (-24.2; 2.9) | 0.45 (0.03; 0.86)* |
| Birth Ponderal Index & mid-life dyslipidemia | |||||
| High PI & no dyslipidemia | 472 | Reference | Reference | Reference | Reference |
| Low PI & no dyslipidemia | 251 | -3.9 (-12.1; 4.4) | -3.0 (-9.8; 3.8) | 0.5 (-3.8; 4.8) | -0.04 (-0.18; 0.08) |
| High PI & dyslipidemia | 427 | -0.6 (-7.6; 6.4) | -1.0 (-6.7; 4.8) | 0.5 (-3.1; 4.1) | -0.00 (-0.12; 0.10) |
| Low PI & dyslipidemia | 198 | -1.4 (-10.2; 7.3) | -2.0 (-9.2; 5.2) | -0.1 (-4.6; 4.5) | -0.05 (-0.19; 0.09) |
| Birth Ponderal Index & mid-life ever smoked | |||||
| High PI & never smoked | 334 | Reference | Reference | Reference | Reference |
| Low PI & never smoked | 158 | 3.1 (-6.9; 13.2) | 3.4 (-4.9; 11.6) | -1.3 (-6.5; 4.0) | 0.06 (-0.10; 0.22) |
| High PI & ever smoked | 565 | -5.1 (-12.4; 2.2) | -5.5 (-11.5; 0.6) | -3.5 (-7.3; 0.4) | 0.08 (-0.06; 0.22) |
| Low PI & ever smoked | 291 | -10.8 (-19.3; -2.2)* | -10.7 (-17.8; -3.6)* | -2.7 (-7.2; 1.8) | 0.19 (0.07; 0.31)* |
P<0.05.
Adjusted for age, sex, education, late-life ICV.
Cut-off low Ponderal Index (PI): <24.3 kg/m3.
Figure 2.

Mean (SE) total brain volumes (mL) for combined categories of Ponderal index (low vs. high) with mid-lifecardiovascular risk factors (present vs. absent) (A) or late-life cardiovascular risk factors (present vs. absent) (B) in 1,348 subjects. Volumes were adjusted for age, sex, education, and late-life ICV.
Discussion
In this population-based cohort of older subjects, we observed that small birth size and increased mid-life cardiovascular risk had an additive effect on having smaller late-life brain volumes. The combined additive effect of small birth size and increased mid-life vascular risk resulted in approximately 10-20mL smaller TB volume later in life. With respect to the regional brain volumes, small birth size in combination with mid-life overweight or hypertension was associated with smaller WM volumes, whereas small birth size in combination with mid-life dysglycemia or smoking was associated with smaller GM and larger WMH volumes.
These novel findings on brain aging are consistent with the “fetal origins of adult disease” hypothesis, more specifically suggesting that exposure to an unfavorable intrauterine environment through some mechanism increases the likelihood that brain may atrophy at a faster rate [1,8,9]. Based on the literature, this effect may operate through cardiovascular risk factors [6], but our analyses suggest this is not case and low PI and cardiovascular risk factors act independently resulting in an additive effect of the two on brain volume. Our results are particularly of note because the mean birth weight in the North Atlantic is among the highest in the world [11,12], suggesting that subtle normal variations in intra-uterine environment may set of a trajectory towards smaller brain volumes.
A major strength of this study is the availability of data across the life span, including birth size data. In particular we had original birth records and did not have to rely on subject memory of birth size. Further, we had measured mid-life cardio-vascular data, obtained during a period when these factors were less likely to have been influenced by brain tissue loss itself (ie. reverse causality). Other strengths of this study are the population-based setting, range of risk factors, the large sample size, and the use of volumetric assessment of total and regional brain volumes.
Limitations of these analyses should be noted. Survivor or non-participation in AGES—Reykjavik bias may have affected our results. Although the birth size of our sample was similar to the birth size of the complete Reykjavik sample, we know that our sample had a more favourable cardiovascular risk profile than the complete Reykjavik Study sample. The extent to which this might have biased our findings depends on a complex set of relationships such as cause of death and association to birth size and cardio-vascular risk factors. Further, by using clinical cut-points for presence or absence of cardio-vascular risk factors, we may have lost power to detect some associations previously reported, such as between hypertension and WML. This may be why we failed to detect an interaction between PI and cardiovascular risk that suggested the sum of the two factors led to a more of a reduced brain volume, then either factor alone. Also, although we apriori selected mid-life risk factors shown to be associated with late-life brain disease, we did not correct for multiple comparisons and our findings should be interpreted with caution. As with all such findings, replication in other cohorts is needed. Another limitation of this study is that brain volumes were measured at one point in time and we do not know whether the accumulating effect of small birth size and adult-life cardiovascular risk on brain tissue volumes reflects a trajectory started at birth, or contributes to accelerated loss of tissue volume in late-life. Finally, in this study we did not include other potentially important perinatal factors, such as socioeconomic status or economic circumstances before and after the great depression (1929-1931) or World War II (1939-1944), which could have influenced the course of brain tissue loss.
Our findings that low PI, and not low birth weight, is associated with smaller brain volumes might suggest that impaired fetal growth associated with brain aging, took place during a specific time of the pregnancy. Clinical observations have shown that growth inhibition in early pregnancy produces a proportional undersized fetus in which both length and weight would be reduced, PI would be normal [6,19]. Growth inhibition in late pregnancy has less effect on fetal length but could result in disproportionate thinness at birth (low PI) [6]. Late pregnancy is when organs and tissues undergo critical periods of development. Normal brain development in this critical period of late pregnancy involves development of several brain structures including GM and WM [20], which is in line with our findings that depending on the vascular risk factor both GM and WM volumes were affected. Few studies investigated the association of adult life vascular risk with both GM and WM volumes. No clear or consistent pattern has emerged from these studies; with one study in middle-aged individuals mainly showing smaller GM volumes with increased vascular risk [21] and another in older individuals reporting smaller WM volume with increased vascular risk [22]. A possible explanation for these inconsistent findings is the age of the population: GM volume loss appears to be a constant, linear function of age throughout adult life, whereas WM volume loss is delayed until mid-life [23].
Several plausible biological mechanisms are proposed to explain the additive effect of birth-size and mid-life vascular risk on late-life brain structure. It has been hypothesized that small birth size and increased vascular risk are independent features of a genetic predisposition to late-life disease [24]. Since small birth size has been associated with genetic factors and increased vascular risk, this could lead to the inheritance of a predisposition to small birth size and adverse vascular risk factors across a number of generations. Epigenetic changes may play an important role in propagating these trajectories. Recent investigations give insight into how epigenetic changes in the fetal environment may have lasting effects on developmental and aging processes [7,25]. An alternative explanation for our findings could be the ‘thrifty phenotype hypothesis’. According to the thrifty phenotype hypothesis, reduced fetal growth increases the susceptibility for a number of chronic conditions later in life through adaptations made by the fetus in an environment limited in its supply of nutrients [8]. Individuals with a thrifty phenotype (a smaller body size, a lowered metabolic rate) who actually develop in an affluent environment have shown to be more prone to metabolic disorders and cardiovascular disease later in life [6], thereby increasing the risk of accelerated brain aging. A natural human experiment caused by famine during the Dutch Hunger Winter in 1944, showed that undernutrition particularly during late gestation was associated with adult disease and accelerated brain aging [26,27].
In summary, small birth size is associated with smaller relative brain volumes in late-life especially in individuals with high cardiovascular risk during mid-life. These results emphasize the importance of optimal brain development in early life and prevention and treatment of cardiovascular risk factors in mid-life to prevent brain tissue loss. In addition, these results emphasize the importance of a life-course approach when studying features of brain aging and related diseases.
References
- 1.Whalley LJ, Dick FD, McNeill G. A life-course approach to the aetiology of late-onset dementias. Lancet Neurol. 2006;5:87–96. doi: 10.1016/S1474-4422(05)70286-6. [DOI] [PubMed] [Google Scholar]
- 2.Ben-Shlomo Y, Kuh D. A life course approach to chronic disease epidemiology: conceptual models, empirical challenges and interdisciplinary perspectives. Int J Epidemiol. 2002;31:285–293. [PubMed] [Google Scholar]
- 3.Debette S, Seshadri S, Beiser A, Au R, Himali JJ, et al. Midlife vascular risk factor exposure accelerates structural brain aging and cognitive decline. Neurology. 2011;77:461–468. doi: 10.1212/WNL.0b013e318227b227. [DOI] [PMC free article] [PubMed] [Google Scholar]
- 4.Launer LJ, Masaki K, Petrovitch H, Foley D, Havlik RJ. The association between midlife blood pressure levels and late-life cognitive function. The Honolulu-Asia Aging Study. JAMA. 1995;274:1846–1851. [PubMed] [Google Scholar]
- 5.Kivipelto M, Helkala EL, Laakso MP, Hanninen T, Hallikainen M, et al. Midlife vascular risk factors and Alzheimer's disease in later life: longitudinal, population based study. BMJ. 2001;322:1447–1451. doi: 10.1136/bmj.322.7300.1447. [DOI] [PMC free article] [PubMed] [Google Scholar]
- 6.Barker DJ, Gluckman PD, Godfrey KM, Harding JE, Owens JA, et al. Fetal nutrition and cardiovascular disease in adult life. Lancet. 1993;341:938–941. doi: 10.1016/0140-6736(93)91224-a. [DOI] [PubMed] [Google Scholar]
- 7.Gluckman PD, Hanson MA. Living with the past: evolution, development, and patterns of disease. Science. 2004;305:1733–1736. doi: 10.1126/science.1095292. [DOI] [PubMed] [Google Scholar]
- 8.Gluckman PD, Hanson MA, Cooper C, Thornburg KL. Effect of in utero and early-life conditions on adult health and disease. N Engl J Med. 2008;359:61–73. doi: 10.1056/NEJMra0708473. [DOI] [PMC free article] [PubMed] [Google Scholar]
- 9.Muller M, Sigurdsson S, Kjartansson O, Jonsson PV, Garcia M, et al. Birth size and brain function 75 years later. Pediatrics. 2014;134:761–770. doi: 10.1542/peds.2014-1108. [DOI] [PMC free article] [PubMed] [Google Scholar]
- 10.Harris TB, Launer LJ, Eiriksdottir G, Kjartansson O, Jonsson PV, et al. Age, gene/environment susceptibility-reykjavik study: multidisciplinary applied phenomics. Am J Epidemiol. 2007;165:1076–1087. doi: 10.1093/aje/kwk115. [DOI] [PMC free article] [PubMed] [Google Scholar]
- 11.Birgisdottir BE, Gunnarsdottir I, Thorsdottir I, Gudnason V, Benediktsson R. Size at birth and glucose intolerance in a relatively genetically homogeneous, high-birth weight population. Am J Clin Nutr. 2002;76:399–403. doi: 10.1093/ajcn/76.2.399. [DOI] [PubMed] [Google Scholar]
- 12.Gunnarsdottir I, Birgisdottir BE, Benediktsson R, Gudnason V, Thorsdottir I. Relationship between size at birth and hypertension in a genetically homogeneous population of high birth weight. J Hypertens. 2002;20:623–628. doi: 10.1097/00004872-200204000-00018. [DOI] [PubMed] [Google Scholar]
- 13.Cole TJ, Henson GL, Tremble JM, Colley NV. Birthweight for length: ponderal index, body mass index or Benn index? Ann Hum Biol. 1997;24:289–298. doi: 10.1080/03014469700005032. [DOI] [PubMed] [Google Scholar]
- 14.Organization WH. Obesity and overweight. 2015 Fact sheet No 311: http://www.who.int/mediacentre/factsheets/fs311/en/
- 15.Genuth S, Alberti KG, Bennett P, Buse J, Defronzo R, et al. Follow-up report on the diagnosis of diabetes mellitus. Diabetes care. 2003;26:3160–3167. doi: 10.2337/diacare.26.11.3160. [DOI] [PubMed] [Google Scholar]
- 16.Zijdenbos AP, Forghani R, Evans AC. Automatic “pipeline” analysis of 3-D MRI data for clinical trials: application to multiple sclerosis. IEEE Trans Med Imaging. 2002;21:1280–1291. doi: 10.1109/TMI.2002.806283. [DOI] [PubMed] [Google Scholar]
- 17.Sigurdsson S, Aspelund T, Forsberg L, Fredriksson J, Kjartansson O, et al. Brain tissue volumes in the general population of the elderly The AGES-Reykjavik Study. Neuroimage. 2012;59:3862–3870. doi: 10.1016/j.neuroimage.2011.11.024. [DOI] [PMC free article] [PubMed] [Google Scholar]
- 18.Groffen DA, Koster A, Bosma H, van den Akker M, Aspelund T, et al. Socioeconomic factors from midlife predict mobility limitation and depressed mood three decades later; findings from the AGES-Reykjavik Study. BMC Public Health. 2013;13:101. doi: 10.1186/1471-2458-13-101. [DOI] [PMC free article] [PubMed] [Google Scholar]
- 19.Hindmarsh PC, Geary MP, Rodeck CH, Kingdom JC, Cole TJ. Intrauterine growth and its relationship to size and shape at birth. Pediatr Res. 2002;52:263–268. doi: 10.1203/00006450-200208000-00020. [DOI] [PubMed] [Google Scholar]
- 20.Rees S, Inder T. Fetal and neonatal origins of altered brain development. Early Hum Dev. 2005;81:753–761. doi: 10.1016/j.earlhumdev.2005.07.004. [DOI] [PubMed] [Google Scholar]
- 21.Geerlings MI, Appelman AP, Vincken KL, Algra A, Witkamp TD, et al. Brain volumes and cerebrovascular lesions on MRI in patients with atherosclerotic disease. The SMART-MR study. Atherosclerosis. 2010;210:130–136. doi: 10.1016/j.atherosclerosis.2009.10.039. [DOI] [PubMed] [Google Scholar]
- 22.Ikram MA, Vrooman HA, Vernooij MW, van der LF, Hofman A, et al. Brain tissue volumes in the general elderly population. The Rotterdam Scan Study. Neurobiol Aging. 2008;29:882–890. doi: 10.1016/j.neurobiolaging.2006.12.012. [DOI] [PubMed] [Google Scholar]
- 23.Ge Y, Grossman RI, Babb JS, Rabin ML, Mannon LJ, et al. Age-related total gray matter and white matter changes in normal adult brain. Part I: volumetric MR imaging analysis. AJNR Am J Neuroradiol. 2002;23:1327–1333. [PMC free article] [PubMed] [Google Scholar]
- 24.Drake AJ, Walker BR. The intergenerational effects of fetal programming: non-genomic mechanisms for the inheritance of low birth weight and cardiovascular risk. J Endocrinol. 2004;180:1–16. doi: 10.1677/joe.0.1800001. [DOI] [PubMed] [Google Scholar]
- 25.Petanjek Z, Kostovic I. Epigenetic regulation of fetal brain development and neurocognitive outcome. Proc Natl Acad Sci U S A. 2012;109:11062–11063. doi: 10.1073/pnas.1208085109. [DOI] [PMC free article] [PubMed] [Google Scholar]
- 26.de Rooij SR, Wouters H, Yonker JE, Painter RC, Roseboom TJ. Prenatal undernutrition and cognitive function in late adulthood. Proc Natl Acad Sci U S A. 2010;107:16881–16886. doi: 10.1073/pnas.1009459107. [DOI] [PMC free article] [PubMed] [Google Scholar]
- 27.Roseboom TJ, Painter RC, van Abeelen AF, Veenendaal MV, de Rooij SR. Hungry in the womb: what are the consequences? Lessons from the Dutch famine. Maturitas. 2011;70:141–145. doi: 10.1016/j.maturitas.2011.06.017. [DOI] [PubMed] [Google Scholar]