

Abstract
The β2 adrenergic receptor (β2AR) has provided a paradigm to elucidate how G protein-coupled receptors (GPCRs) control intracellular signaling, including the discovery that β-arrestins, which bind to ligand-activated GPCRs, are central for GPCR function. We used genome editing, conditional gene deletion, and siRNAs to determine the roles of β-arrestin (β-arr) 1 and 2 in β2AR internalization, trafficking, and signaling to ERK. We found that only β-arr2 was essential for β2AR internalization. Surprisingly, β-arr1 and β-arr2 and receptor internalization were dispensable for ERK activation. Instead, β2AR signaled through Gαs and Gβγ subunits through a pathway that involved the tyrosine kinase SRC, the adaptor protein SHC, the guanine nucleotide exchange factor SOS, the small GTPase RAS, and the kinases RAF and MEK, which led to ERK activation. These findings provide a molecular framework for β2AR signaling through β-arrestin-independent pathways in key physiological functions and pathological conditions.
Keywords: G protein coupled receptors, Ras, G proteins, β-arrestin, signaling, ERK1/2, receptor internalization
Introduction
G protein-coupled receptors (GPCRs) represent the largest family of cell surface proteins involved in signal transmission. These receptors play key roles in physiological processes, and their dysfunction contributes to some of the most prevalent human diseases (1). As such, GPCRs are the target, directly or indirectly, of more than 25% of drugs on the market (1, 2). The study of β2-adrenergic receptors (β2AR) has provided a paradigm to elucidate the most fundamental mechanisms by which GPCRs control intracellular signaling in key physiological functions and pathological conditions (1, 3-7).
Upon ligand binding, β2AR undergoes a rapid conformational change leading to its association with the Gα subunit of the heterotrimeric G protein Gs (Gαs), and the consequent release of GDP bound to Gαs and its exchange for GTP (3, 6, 7). While GTP-Gαs initiates signal transmission resulting in cAMP accumulation, G protein Receptor Kinases (GRKs) phosphorylate the C-terminus of β2AR (5). This leads to recruitment of β-arrestins, which associate with β2ARs and cause receptor desensitization by uncoupling receptors from G proteins and promoting their internalization through clathrin coated pits (4, 5, 8, 9), resulting in G protein signal termination at the plasma membrane. In addition to desensitization of G protein signaling, β-arrestins have also been proposed to initiate their own signals activating mitogen activated kinases (MAPKs) ERK1/2 (collectively referred herein as ERK) (8, 9). However, the respective roles of β-arrestin (β-arr) 1 and 2 (also known as arrestin-2 and arrestin-3, respectively) in receptor internalization and ERK activation have not been fully elucidated (10), and the relative contribution of β-arrestins and Gαs to overall ERK activation by β2AR has been debated (9, 11, 12). This has hindered a thorough mechanistic understanding of how β2AR activates ERK, and hence limited the full potential of interfering with GPCR signaling to ERK for therapeutic intervention in multiple diseases.
Results
β-arr2, but not β-arr1, is essential for β2AR internalization
To begin investigating the relative contributions of β-arr1 and β-arr2 to receptor internalization and signaling, and the potential for redundancy, we established flow cytometry assays to determine cell surface amounts of FLAG-β2AR upon activation by its agonist, isoproterenol (Iso). Internalization of stably expressed FLAG-β2AR in HEK293 cells occurred rapidly, reaching a maximum within 15-30 min (Fig. 1A-C). A phosphorylation-deficient mutant FLAG-β2AR 3S, in which the C-terminal GRK phosphorylation sites were mutated to impair β-arrestin-induced desensitization and internalization (13), showed minimal isoproterenol stimulated receptor internalization, thus serving as a control (Fig. 1A-C). Similarly, stimulation of cells at 4°C completely abolished receptor internalization (Fig. 1B and C). As an additional control, constitutive uptake of fluorescently labeled transferrin was monitored in HEK293 FLAG-β2AR and FLAG-β2AR 3S cell lines, which showed no significant differences (Fig. S1A). To evaluate β-arrestin function in β2AR internalization we performed siRNA knockdown in HEK293 FLAG-β2AR cells (Fig. 1D). Knockdown of β-arr1 alone had little effect on receptor internalization compared with siRNA control (siCont) (Fig. 1E). However, knockdown of β-arr2 alone largely impaired β2AR internalization, similar to knockdown of both β-arr1 and β-arr2, suggesting an important role for β-arr2 but not β-arr1 in β2AR internalization (Fig. 1E). Transferrin-uptake was similar under all conditions (Fig. 1F).
Figure 1.
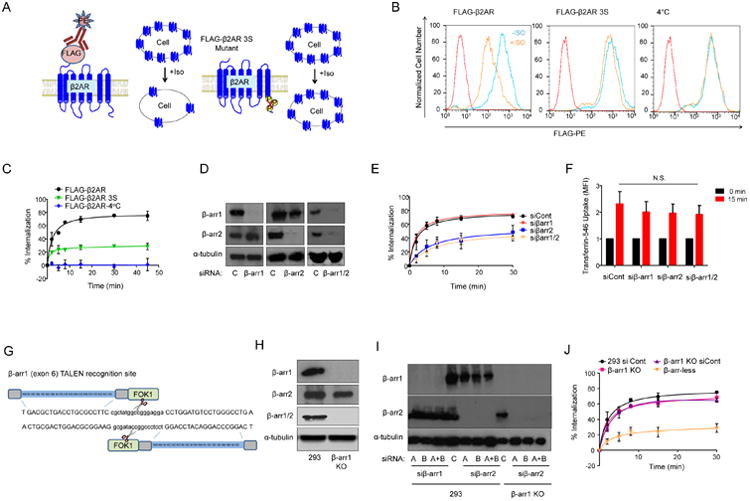
Internalization of β2AR in 293, β-arr1 KO and β-arr-less cells. A) Schematic of FLAG-β2AR and FLAG-β2AR 3S internalization assays. B) Surface FLAG-β2AR or FLAG-β2AR 3S abundance in 293 cells before or after 15 min Iso (10 μM) stimulation compared with isotype-stained reference control, and control stimulation at 4°C. C) Internalization of FLAG-β2AR or FLAG-β2AR 3S after Iso stimulation; mean of three independent experiments +/- standard deviation (SD). D) Western blot of β-arr1 and β-arr2, and a-tubulin (loading control), in 293 cells transfected with β-arrestin or control siRNAs. Representative of four independent experiments. E) Internalization of FLAG-β2AR after Iso stimulation in 293 cells transfected with β-arrestin or control siRNAs; mean of three independent experiments +/- SD. F) Flow cytometry quantification of MFI of 15 min transferrin-546 uptake in 293 FLAG-β2AR cells transfected with control siRNA (siCont) or indicated siRNAs; mean of three independent experiments +/- SD. G) Schematic of the β-arr1 TALEN construct design targeting exon 6. (H and I) Western blot for β-arrestins in (H) 293 and β-arr1 KO cells and in (I) 293 and β-arr1 KO cells transfected with two different siRNAs (A, B) targeting β-arr1 or β-arr2, or siRNA pools (A+B). J) Internalization of FLAG-β2AR after Iso stimulation in indicated cells, mean of three independent experiments +/- SD.
Advances in genome editing strategies with the development of TALEN and CRISPR techniques have now made it feasible to investigate the effects of precise gene deletion (14, 15) as opposed to relying entirely on transient siRNA knockdown approaches. We used TALEN genome editing targeting β-arr1 to generate a β-arr1 knockout (KO) HEK293 cells (Fig. 1G, H and S1B). An antibody that detects both β-arr1 and β-arr2 did not yield a signal in the β-arr1 KO line, which agreed with previous reports that β-arr1 is generally more highly abundant (16, 17). Nevertheless, use of a β-arr2 specific antibody indicated the presence of β-arr2 in both the parental HEK293 and β-arr1 KO lines (Fig. 1H). Two independent siRNAs targeting each β-arrestin effectively knocked down the respective proteins, and the siRNAs were pooled for further experiments comparing the effects of β-arr1 or β-arr2. The β-arr1 KO cells transfected with the pool of siRNAs targeting β-arr2 were henceforth designated β-arr-less cells (Fig. 1I). Similar to the siRNA knockdown approach, the HEK293 β-arr1 KO cells expressing FLAG-β2AR had similar β2AR internalization patterns as the HEK293 FLAG-β2AR control cells (Fig. 1J). However, the loss of β-arr2 in the β-arr-less cells greatly impaired β2AR internalization (Fig. 1J) without affecting transferrin uptake (Fig. S1C).
β-arr2 is required for β2AR trafficking to clathrin-coated pits and internalization into endocytic vesicles
We next took advantage of the use of the SNAP-tag system to specifically label cell surface expressed β2AR to visualize the internalization process by live cell confocal imaging and immunofluorescence of fixed cells (Fig. 2A). Aligned with our observations by flow cytometry internalization analysis using FLAG-β2AR cells, HEK293 and β-arr1 KO cells readily internalized SNAP-labeled-β2AR into early endosomes upon stimulation with isoproterenol (Fig. 2B and Supplemental Movies 1 and 2). However, SNAP-β2AR predominantly remained on the cell surface in β-arr-less cells (Fig. 2B and Supplemental Movie 3). Immunofluorescence analysis with the early endosome marker EEA1 revealed that SNAP-β2AR colocalized with EEA1 in early endosomes in isoproterenol-stimulated control cells and β-arr1 KO cells, but not in β-arr-less cells, as quantified by Pearson's coefficient analysis (Fig. 2B-C).
Figure 2.
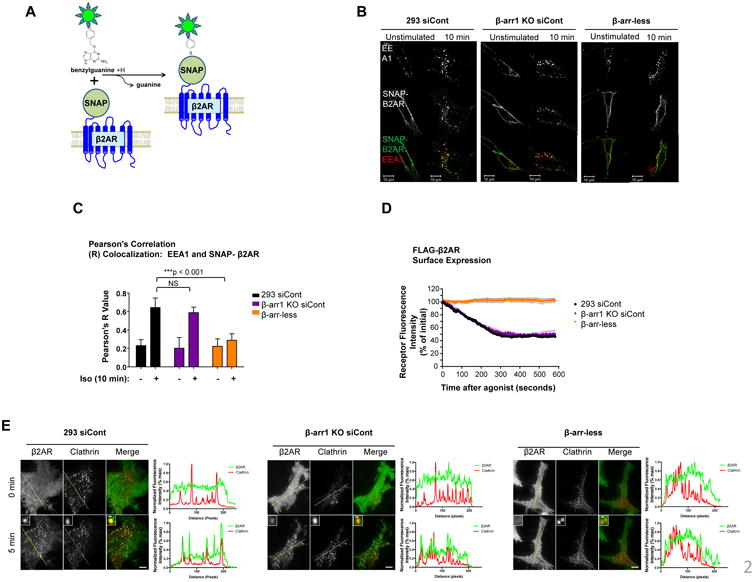
β2AR internalization into endocytic vesicles through clathrin-coated pits. A) Schematic of SNAP-tagged β2AR used for immunofluorescence (IF) imaging. B) IF of SNAP-β2AR and EEA1 endocytic vesicles and (C) respective Pearson's Correlation (R) values. Mean of twelve individual cells imaged from two independent experiments +/- standard error of the mean (SEM) in the indicated cells upon 10 min Iso stimulation. Statistical significance was determined by t-test. Scale bar, 10 μm. D) Surface FLAG-β2AR abundance in the indicated cells after Iso stimulation, determined by TIRF microscopy using fluorescently labeled β-arr2 siRNA. Representative of three independent experiments. E) TIRF imaging of FLAG-β2AR (green) and clathrin-coated pits (red) in indicated cells before and after 5 min Iso stimulation. Graphs depict the overlap in fluorescence intensity between FLAG-β2AR and CCPs across designated lines through the cells, as an indication of colocalization. Scale bar, 5 μm, inset scale bar 500 nm. Representative of three independent experiments.
We verified by Total Internal Reflection Fluorescence (TIRF) microscopy that FLAG-β2AR endocytosis was abolished in β-arr-less cells receiving labeled siRNA directed against β-arr2 (Fig. 2D), whereas β-arr1 KO cells maintained similar amounts of internalization compared with control HEK293 cells, in agreement with the flow cytometry and immunofluorescence data. We then examined β2AR accumulation in clathrin-coated pits, the key step in the process of ligand-induced endocytosis of β2AR that is promoted by β-arrestins. β2AR clustered rapidly in clathrin-coated pits following isoproterenol application in HEK293 and β-arr1 KO cells whereas receptor clustering in clathrin-coated pits was abolished in β-arr-less cells receiving labeled siRNA to β-arr2 (Fig. 2E, Fig. S2A and Supplemental Movies 4-7). Additionally, knockdown of clathrin heavy chain disrupted FLAG-β2AR internalization, verifying that β2AR internalization was indeed clathrin-dependent in these cells (Fig. S2B). Thus, our data obtained through multiple complementary approaches indicate that β2AR internalization occurs predominantly through clustering of receptors into clathrin-coated pits that is specifically β-arr2-dependent.
β-arrestins are dispensable for ERK activation
In addition to receptor internalization, β-arrestins are proposed to desensitize β2AR signaling while concomitantly initiating β-arrestin-dependent signaling to ERK (9, 11, 18). Strikingly, the β-arr-less cells did not show decreased ERK phosphorylation but instead showed increased ERK activation in response to β2AR stimulation when compared with control 293 cells, using both in-cell western (Fig. 3A) and traditional western blot (Fig. 3B) approaches. Although these results were unexpected, ERK activation was similarly increased rather than decreased in cells expressing the FLAG-β2AR 3S mutant that had impaired internalization and β-arrestin recruitment (Fig. 1A-C and Fig. 3C-E). These data collectively suggest that initiation of ERK signaling from β2AR does not require receptor internalization or β-arrestins.
Figure 3.
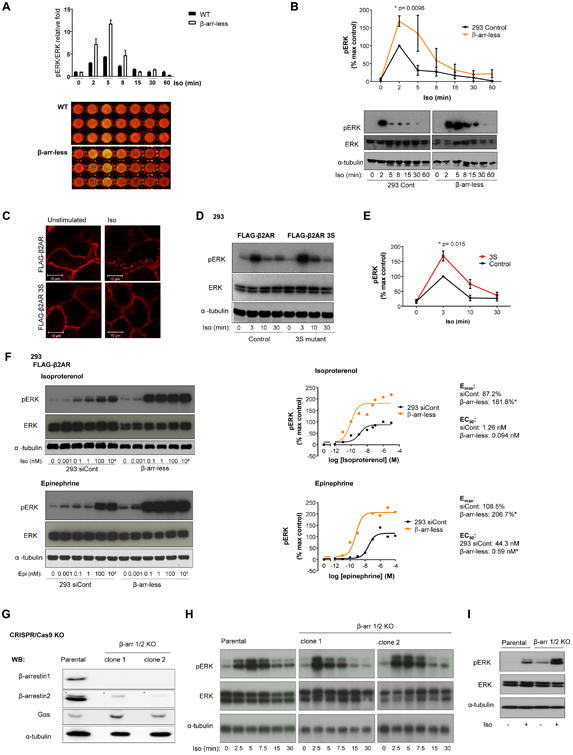
ERK activation in 293 and β-arr-less cells. A) In-cell western blot with quantification of ERK phosphorylation (pERK) induced by Iso stimulation, performed in triplicate +/- SEM; representative of two independent experiments shown. B) Western blot and quantification of Iso-induced pERK normalized to total ERK from three independent western blots +/- SEM. Statistical significance was determined by t-test. Westerns are from same blot and exposure, representative of 3 independent experiments. C) IF of FLAG-β2AR and FLAG-β2AR 3S in 293 cells upon 5 min Iso stimulation. Scale bar, 10 μm. Representative image from two independent experiments. D) Western blot of pERK and indicated controls upon Iso stimulation of 293 FLAG-β2AR or FLAG-β2AR3S cells. E) Quantification of pERK normalized to ERK from three independent western blots +/- SEM in the indicated cells after Iso stimulation. Statistical significance was determined by t-test. F) pERK western blots of the indicated cells after 3 min Iso and Epinephrine (Epi) stimulations (representative of three independent experiments) and the corresponding representative ELISA data quantifying amounts of pERK (representative of three independent experiments). Relative Emax and EC50 values are indicated. Non-linear regression (least squares fit) analysis was used to fit curves and determine the EC50 and Emax values. Statistical significance (*) signifies non-overlapping 95% confidence intervals. G) Western blot showing β-arr1 and β-arr2 expression in parental 293 cells and two separate CRISPR/Cas9 β-arr1/2 knockout (KO) clones, and H) pERK amounts upon Iso stimulation of these cells. Representative of three independent experiments. I) Western blot for ERK phosphorylation (pERK), total ERK, and α-tubulin in unstimulated and 5 minute Iso (10 μM) stimulated parental 293 and β-arr 1/2 KO cell lines with endogenous levels of β2AR. Results represent three independent experiments.
The enhanced signaling from β2AR to ERK in β-arr-less cells was confirmed by the increased sensitivity to the synthetic (isoproterenol, Iso) and natural (epinephrine, Epi) β2AR agonists by western blot and phospho-ERK ELISA analysis of dose-response curves. This approach revealed higher maximal responses (Emax) and lower EC50 values in β-arr-less cells compared with control cells (Fig. 3F). We also investigated the effects of β-arrestin depletion on cAMP signaling. Both β-arr2 knockdown and β-arr1 KO cells had increased cAMP production in response to isoproterenol that was greater in the β-arr-less cells (Fig. S3). These data support the idea that β-arrestins restrain β2AR-initiated ERK activation and cAMP accumulation. Moreover, we also used the CRISPR/Cas9 system to genetically delete both β-arr1 and β-arr2 simultaneously (Fig. 3G and Fig. S4). Similar to the β-arr-less cells, two separate β-arr1/2 double KO clonal cells showed stronger early phosphorylation of ERK compared with the parental control cells (Fig. 3H). This complementary genome editing approach provided further support to the notion that β-arrestins are dispensable for ERK activation by β2AR. Amounts of endogenous and transfected β2AR were similar between parental HEK293 and β-arr1/2 KO cell lines, as measured by specific binding of [3H] dihydroalprenolol ([3H] DHAP), suggesting differences in receptor amounts did not account for the differences in signaling observed (Fig. S5). Furthermore, we verified that the β-arr1/2 double KO lines had abolished β2AR and arginine vasopressin receptor 2 (V2R) internalization upon stimulation with their respective ligands, isoproterenol and arginine vasopressin (AVP) (Fig. S5). These observations were consistent with an important role for β-arr2 in receptor-mediated internalization, as described in Figures 1 and 2. We also observed an increase in isoproterenol-mediated ERK activation in β-arr1/2 double KO lines relative to the parental HEK293 cells with endogenous receptor amounts (Figure 3I), suggesting that receptor overexpression was not affecting the results. In addition, we compared the effects of the loss of β-arr1/2 on ERK activation by another GPCR, V2R. Similar to results observed with β2AR, β-arr1/2 was dispensable for V2R-mediated ERK activation (Fig. S6).
ERK activation by β2AR is Gαs-dependent
As β2AR is predominantly coupled to Gαs, in search for the underlying mechanism(s) linking β2AR to ERK we tested whether Gαs coupling was required for isoproterenol-mediated ERK phosphorylation. Using mouse embryonic fibroblasts (MEFs) derived from Gnas f/f mice, we generated a stable FLAG-β2AR-expressing cell line (Fig. S7A). Cells treated with control adenovirus exhibited a robust activation of ERK, while excision of Gαs using a Cre-GFP adenovirus abrogated isoproterenol-induced ERK phosphorylation (Fig. 4A). Thus, conditional Gαs gene deletion eliminated ERK activation in MEFs. As a complementary approach, we used Gs-deleted HEK293 cells lacking both of the expressed Gαs gene members (GNAS and GNAL), generated using the CRISPR/Cas9 system (Fig. 4B and Fig. S7B). Compared with the parental cells, the GNAS KO HEK293 cells had nearly complete impairment of ERK activation by Isoproterenol, while control EGF-mediated activation of ERK was preserved (Fig. 4C). Disruption of Gαs signaling in these cells was confirmed by cAMP and CRE luciferase assays and by its restoration by Gαs re-expression (Fig. 4D-E). Similarly, transfection of Gαs into GNAS KO HEK293 cells effectively restored robust ERK signaling (Fig. 4F), supporting that Gs coupling is critical for initiating β2AR-mediated ERK activation.
Figure 4.
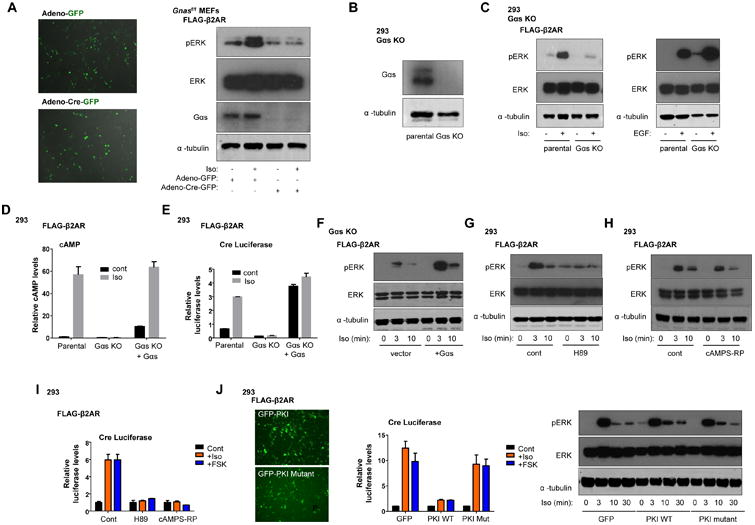
Gαs but not PKA is critical for β2AR-mediated ERK phosphorylation. A) IF showing GFP expression of FLAG-β2AR Gnas f/f MEFs transduced with control adenoviral (adeno)-GFP or adeno-Cre-GFP, and western blot of pERK upon 3 min Iso stimulation of these cells (representative of three independent experiments). B) Western blot for Gαs in 293 CRISPR/Cas9-edited Gαs KO cells. C) Western blot of pERK upon 3 min Iso or EGF (10 ng/mL) stimulation in the indicated cells. Representative of three independent experiments. (D and E) Relative amounts (mean +/- SEM of three independent experiments) of (D) cAMP and (E) CRE luciferase activity in the indicated cells upon Iso stimulation. F) Western blot of pERK after Iso stimulation in Gαs KO FLAG-β2AR cells transfected with vector control or Gαs. Representative of three independent experiments. (G and H) Western blot of pERK in 293 FLAG-β2AR cells stimulated with Iso after pretreatment with DMSO (control), (G) H89 (10 μM), or (H) cAMPS-RP (100 μM). Representative of three independent experiments for G and H. I) Relative CRE luciferase activity in Iso and FSK (5 mg/ml) stimulated 293 FLAG-β2AR cells pretreated with H89, cAMPS-RP or DMSO control; mean +/- SEM of three experiments. J) IF of GFP expression, relative CRE luciferase activity (mean +/- SEM, three experiments), and western blot of pERK in 293 FLAG-β2AR cells transfected with GFP-PKI or GFP-PKI-mutant (PKI-Mut) plasmids upon stimulation with Iso (representative of three independent experiments).
PKA is dispensable for ERK activation by β2AR
Since PKA is a major signaling target of Gαs and cAMP production, we next tested the role of PKA in β2AR-mediated ERK activation. Previous studies have demonstrated that the PKA inhibitor H89 reduces ligand-induced ERK phosphorylation (11). We similarly observed impaired ERK activation by isoproterenol with H89 pre-treatment (Fig. 4G). However, H89 is not a very specific inhibitor and can target multiple additional kinases (19, 20). Thus, we tested more selective inhibitors of PKA including the cell permeable competitive antagonist, cAMPS-RP. In contrast to H89, cAMPS-RP had little effect on isoproterenol-induced ERK activation (Fig. 4H), although it effectively blocked isoproterenol and forskolin (FSK) induced CRE-dependent transcription (Fig. 4I). As a complementary genetic approach, we expressed GFP-tagged versions of PKI, a specific peptide inhibitor of PKA, or control PKI mutant peptide (PKI-Mut), in which the PKA inhibitory domain is disrupted (21). The PKI peptide, but not the control PKI-Mut peptide or GFP plasmid alone, disrupted CRE luciferase induction by isoproterenol stimulation (Fig. 4J). Yet, as with the cAMPS-RP inhibitor, inhibition of PKA with PKI did not impair isoproterenol-induced ERK phosphorylation (Fig. 4J). Since PKA is not the only target of cAMP production downstream of Gαs activation, we also tested the potential role of EPAC, a RAP1 guanine nucleotide exchange factor, in transmitting signals leading to ERK activation. However, CE3F4, a small molecule that blocks EPAC-induced RAP1A activation, also failed to reduce the Isoproterenol-induced ERK activation (Fig. S7C), although it successfully disrupted RAP1A activation (Fig. S7D).
ERK activation by β2AR is mediated by SRC, SHC, SOS, and RAS
Similar to the absence of direct evidence that PKA is required for β2AR-mediated ERK activation, pharmacological agents inhibiting EGFR (AG1478), PI3K (LY294002), and Gαi (pertussis toxin) also failed to prevent ERK activation in response to isoproterenol in HEK293 FLAG-β2AR cells (Fig. S8A-C). Thus, we next decided to delineate signaling upstream of ERK activation following the classic RAS/RAF/MEK/ERK signaling cascade, although based on our data, it was unlikely that RAF activation could be achieved by a β-arrestin-dependent activation bypassing RAS, as previously proposed (22, 23). The MEK1/2 inhibitor U0126 completely abrogated Isoproterenol and EGF (the latter was used as a control) induced ERK phosphorylation, indicating MEK1/2 was strictly required (Fig. 5A). Working upstream, two inhibitors of B-RAF, SB-590885 and GDC-0879 similarly abrogated isoproterenol and EGF induced ERK phosphorylation (Fig. 5B). In turn, to evaluate the role of RAS in the activation of ERK, we employed dominant negative KRAS and HRAS plasmids. Transfection of either dominant negative RAS plasmids reduced the isoproterenol-induced ERK activation, although KRAS had the more potent inhibitory effect (Fig. 5C). Although expression of dominant negative KRAS substantially disrupted β2AR-mediated ERK phosphorylation, it did not prevent the induction of CRE luciferase by isoproterenol or FSK, supporting a role for RAS in ERK activation independently of cAMP/PKA-induced Cre transcription (Fig. 5D). Pull-down assays for active Ras indicated that active GTP-bound RAS was increased upon isoproterenol stimulation (Fig. 5E). In a more genetically oriented approach, we generated stable FLAG-β2AR expressing mouse embryonic fibroblasts (MEFs) in which Hras and Nras genes were deleted and the Kras gene floxed (24) (Fig. S8D). Stimulation of these “Rasless MEFs”, in which treatment with Cre-GFP adenovirus efficiently excised the Kras gene, substantially reduced ERK phosphorylation in comparison to adeno-GFP control (Fig. 5F), collectively supporting a key role for RAS in ERK activation by β2AR.
Figure 5.
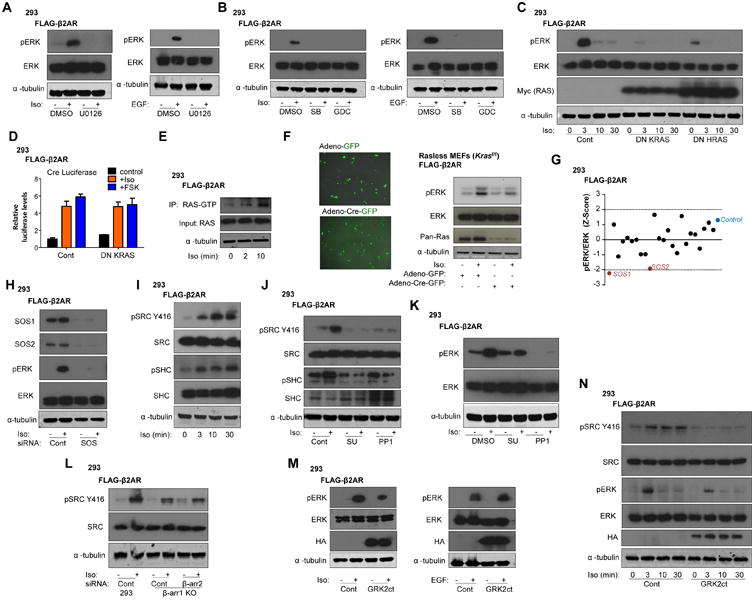
β2AR-mediates ERK activation through Gβγ signaling and activation of a signaling cascade that involves SRC, SHC, SOS, RAS, RAF, and MEK. (A and B) Western blot of pERK after Iso or EGF stimulation (3 min) in 293 FLAG-β2AR cells pretreated with DMSO or (A) U0126 (10 μM), (B) SB-590885 (SB, 10 μM) or GDC-0879 (GDC, 10 μM). Representative of three independent experiments for A and B. C) Western blot of pERK after Iso stimulation in 293 FLAG-β2AR cells transfected with DN K-RAS, DN H-RAS or control. Representative of four independent experiments. D) Relative CRE luciferase activity in Iso and FSK-stimulated 293 FLAG-β2AR cells transfected with DN K-RAS or control plasmid; mean +/- SEM of three experiments. E) Western blot showing active RAS-GTP pull down (IP) and input for RAS and α-tubulin after Iso stimulation. Representative of three independent experiments. F) IF showing GFP expression (scale bar, X) and pERK western blot of Iso-stimulated FLAG-β2AR-Rasless MEFs transduced with adeno-GFP or adeno-Cre-GFP virus (representative of three independent experiments). G) Effects of siRNA library screen of various RAS-GEFs on Iso-stimulated pERK amounts. Representative of three independent experiments. H) Western blot of pERK in 293 FLAG-β2AR cells transfected with siRNA to SOS1 and SOS2 (SOS) or control in response to Iso. Representative of three independent experiments. (I and J) Western blot of pSrc and pSHC in (I) response to Iso stimulation, and (J) with SRC inhibitors PP1 (10 μM), SU6656 (10 μM), or DMSO. Representative of three independent experiments for I and J. K) Western blot of pERK in 293 FLAG-β2AR cells pretreated with SRC inhibitors upon Iso stimulation. Representative of three independent experiments. L) Western blot of pSRC in the indicated cells upon Iso stimulation. Representative of three independent experiments. M) Western blot of pERK after Iso or EGF stimulation in 293 FLAG-β2AR cells transfected with control or HA-tagged GRK2ct plasmids. Representative of three independent experiments. N) Western blot of Iso-stimulated pSRC and pERK in 293 FLAG-β2AR cells transfected with control or HA-tagged GRK2ct. Representative of three independent experiments.
To explore the role of candidate RAS-GEFs involved in activating the RAS/RAF/MEK/ERK signaling cascade, we performed a RAS-GEF siRNA library screen including siRNAs for each of the 8 members of the RAS guanine nucleotide exchange factor (GEF) superfamily (25) and the in-cell western blot fluorescence assay described above. Among all GEF tested, SOS1 and SOS2 had the most significant Z-score therefore representing the best candidates for mediating isoproterenol-induced ERK phosphorylation in β2AR expressing HEK293 cells (Fig. 5G). We confirmed a critical role for SOS1 and SOS2 in β2AR-mediated ERK activation by western blot analysis of cells transfected with a pool of siRNAs targeting SOS1 and SOS2 (Fig. 5H). Because SHC and upstream SRC family kinases can activate SOS-RAS signaling, we investigated whether β2AR stimulation mediates phosphorylation of SRC and SHC. Isoproterenol stimulation indeed caused an increase in tyrosine phosphorylation of SHC and SRC (Y416) (Fig. 5I). Additionally, the small molecule SRC inhibitors SU-6656 and PP1 impaired the Isoproterenol-induced phosphorylation of SRC and SHC (Fig. 5J) and significantly reduced ERK activation (Fig. 5K). Depletion of β-arrestins (β-arr-less cells) did not affect isoproterenol-induced phosphorylation of SRC (Fig. 5L). Therefore, SRC appears to play an important role in β2AR-mediated ERK activation, but independent of β-arrestins. Finally, we examined whether Gβγ signaling upon Gas activation may be important for ERK activation. An HA-tagged C-terminal GRK2 construct (HA-GRK2ct), which selectively blocks βγ signaling (26) (also known as βARKct), substantially reduced the β2AR-mediated ERK phosphorylation without affecting EGF-mediated ERK activation (Fig. 5M). Additionally, inhibition of βγ signaling through GRK2ct also significantly disrupted the phosphorylation of SRC and SHC (Fig. 5N and Fig. S8E). Thus, Gβγ signaling appears to play a key role in the initiation of a signaling cascade involving SRC, SHC, SOS, RAS, RAF, MEK, and ERK that links β2AR to ERK (Fig. 6).
Figure 6.

Schematic depicting β2AR-mediated ERK activation. β2AR-mediated ERK activation occurs through Gβγ induction of a signaling cascade that involves SRC, SHC, SOS, RAS, RAF, and MEK. β-arr2 mediates endocytosis of β2AR through clathrin-coated pits (CCPs) and Gα activates adenylate cyclase (ADCY) to generate cAMP, thereby activating PKA. Although PKA is dispensable for the activation of the SRC/SHC/SOS/RAS/RAF/MEK/ERK pathway by β2AR, it will require further investigation to determine if PKA redundantly feeds into this pathway.
Discussion
The scaffolding and proposed activation of ERK by β-arrestins has received considerable attention due to the critical role of ERK in cell growth, survival and proliferation responses. Additionally, ERK activation is frequently monitored in high throughput drug screens for “biased” GPCR agonists and antagonists, in which G protein signaling may be inhibited while β-arrestin function is maintained and vice versa. Although β-arrestins have been proposed to interact with and induce their own G protein-independent activation of ERK (9, 27), our results showed that loss of β-arrestins enhanced the potency and efficacy of isoproterenol- and epinephrine- induced ERK phosphorylation. Therefore, it is possible that the effects of β-arrestins on desensitization of G protein signaling, including G-protein-dependent ERK activation, override their potential direct contributions to ERK activation; hence, an enhanced response is observed in not only cAMP signaling but also ERK phosphorylation in β-arrestin-depleted and KO cells.
Overall, the combination of genome editing approaches with siRNA-mediated knockdowns, conditional gene deletion in engineered fibroblasts, and genome editing cell knock outs for critical signaling nodes provided genetic evidence supporting that β-arrestins play distinct roles in β2AR internalization and desensitization, including a preferential role for β-arr2 in β2AR internalization(4, 5, 8, 28), while revealing that β-arrestins are dispensable for ERK activation and function. Specifically, our findings are consistent with a model whereby β2AR stimulation promotes the activation of Gαs, promoting the accumulation of cAMP through Gαs and ERK activation primarily through Gβγ subunits (Fig. 6). In the absence of Gβγ signaling, the limited residual ERK activation may suggest the existence of additional minor contributing mechanisms that may require further elucidation, such as a cAMP-dependent activation that is not strictly necessary for β2AR activation of ERK (Fig. 6). In turn, Gβγ may stimulate the kinase activity of SRC directly, as previously demonstrated in in vitro reconstitution systems using purified components (29, 30), and the sequential activation of RAS and the ERK kinase cascade through SOS1/2 upon SHC phosphorylation by SRC (Fig. 6). Overall, our results support that initiation of ERK activation by β2AR involves a signaling route that is independent of β-arrestins, with β-arrestins inhibiting rather than activating ERK in this pathway.
These findings may have general implications for signaling to ERK through Gs-coupled GPCRs. Specifically, β2AR is a prototypical GPCR that associates transiently with β-arrestins, often referred to as class A GPCR as compared to class B GPCRs, which include AT1A angiotensin receptors and V2R vasopressin receptors, and which associate tightly with β-arrestins and are co-internalized (31). The use of β-arrestin-KO cells suggests that, at least for V2R, β-arrestins are not strictly required for ERK signaling by this class B GPCR. A recent study on the free fatty acid receptor 4 (FFA4), which couples with Gq, demonstrates that FFA4-induced ERK phosphorylation is dependent on Gq but not β-arrestins (32). Thus, dispensable role of β-arrestin in GPCR-induced ERK activation is likely to be generalizable, and is supported by several additional studies (33, 34). On the other hand, the role of receptor internalization for prolonged ERK activation by class B GPCRs has been traditionally interpreted as β-arrestin-initiated ERK signaling (9). However, class B GPCRs form a ternary complex, with β-arrestins binding to the C-terminal phosphorylated tail of the GPCR and Gαs remaining bound to the receptor, likely locked in a signaling-competent conformation (35). This observation may help explain the fact that many GPCRs can promote long lasting accumulation of cAMP from an intracellular compartment, including early endosomes (36), through Gαs that is co-internalized with the GPCRs and β-arrestins (37). Thus, our current study raises the interesting possibility that ERK signaling by class B GPCRs may also involve Gαs rather than a β-arrestin initiated process once internalized. In this scenario, Gβγ-subunits released from Gαs in the proximity of β-arrestin-bound GPCR-Gαs complexes may promote the persistent activation of SRC, RAS, and ERK from an intracellular compartment. Indeed, the activation of RAS, particularly KRAS in an intracellular membrane compartment has been reported, which may have distinct signaling output in terms of amplitude and duration, and biological activity (38). In this context, prior observations that β-arrestins bind ERK and its upstream components could be re-interpreted as a reflection of the scaffolding function of β-arrestins, which may control the localized activation of ERK, rather than promoting ERK activation. Yet, we note that β-arr2 knockdown reduces ERK activation by the β1AR (39), opposite to its effect on ERK activation by β2AR. Thus it is possible that functional diversity between receptors is achieved through receptor-specific differences in the degree to which ERK activation is limited by β-arrestins' distinct signal-attenuating and scaffolding functions. Cell-type specific differences in signaling specificity may also come into play, and so future studies using new genome editing approaches may help clarify these issues in specific cell populations.
The use of genome editing strategies and targeted gene deletion in MEFs provide enormous power for improving knowledge of GPCR and β-arrestin function by the genetic dissection of receptor-specific differences in signaling, desensitization and trafficking. Overall, we were able to link the β-arrestins to desensitization of β2AR-mediated signaling and identify a selective function for β-arr2 in CCP-mediated endocytosis of β2AR. Analysis of ERK activation also revealed the necessity of implementing caution when using ERK as a screen for β-arrestin biased agonists and for considering β-arrestins in overall ERK signaling and function; we observed a critical role for Gs signaling and a desensitizing role of β-arrestins in the overall ERK activation. Thus, the use of genome-edited cellular systems to screen for biased drug responsiveness may provide better insights into the mechanisms by which they exert their pharmacological effects. Overall, we have defined a molecular framework by which β2AR initiates ERK activation by a β-arrestin-independent pathway. Ultimately, our findings provide a mechanism by which multiple GPCRs may control ERK-regulated gene transcription programs, and the consequent orchestration of cell-specific biological responses that are dependent on ERK.
Materials and Methods
Reagents
Isoproterenol (Iso), forskolin (FSK), epidermal growth factor (EGF), epinephrine (Epi), thrombin, U0126, PP1, SU6656 and H89 were purchased from Sigma. 8-(4-Chlorophenylthio)adenosine- 3′, 5′- cyclic monophosphate (8-CPT-cAMP) and 8-(4-Chlorophenylthio)-2′-O-methyl-cAMP (8-pCPT-2′-O-Me-cAMP) were from Biolog Life Science Institute (Axxora). CE3F4, cAMPS-RP, SB-590885 and GDC-0879 were obtained from Tocris. Pertussis toxin (PTX) was obtained from List Biological Laboratories, Inc. AG1478 and LY294002 were obtained from Calbiochem. siRNAs targeting β-arrestin 1, β-arrestin2, clathrin heavy chain (CHC-17) and All Stars Negative Control were purchased from Qiagen. Sandwich ELISA kit for phopsho-ERK1/2 and antibodies against phospho-ERK1/2 (phospho p42/p44 MAPK (T202/Y204) XP), ERK1/2 (p42/44 MAPK), β-arrestin 1, β-arrestin 2, β-arrestin 1/2, phospho-Akt (S473) (D9E) XP, Akt, phospho-SRC (Y416), SRC (32G6), phospho-SHC (Y239/240), and α-tubulin (DM1A) were from Cell Signaling Technology. Gαs, SOS1 and SOS2 antibodies were obtained from Santa Cruz. SHC antibody was from Millipore/Upstate Biotechnology. Pan-RAS (Ab-3) antibody was from Calbiochem. Antibodies against HA and Myc (9E10) tags were obtained from Covance. FLAG-PE antibody (PJ315) was from Prozyme. EEA1 and clathrin heavy chain antibodies were purchased from BD Biosciences. Secondary HRP-conjugated antibodies were purchased from GE Healthcare and Alexa Fluor 680 and 800 conjugated secondary antibodies for Li-cor imaging were from Invitrogen. SNAP surface Alexa Fluor-488 and 546 labels were purchased from New England Biolabs. Puromycin, transferrin-Alexa Fluor-546, Alexa Fluor-546 and Alexa Fluor-488 were purchased from Invitrogen. Pre-packaged adenoviruses, Adeno-GFP and Adeno-GFP iCre, were obtained from Vector Biolabs.
Plasmids and Constructs
FLAG-β2AR was expressed in pcDNA3.1 vector for transient transfections or subcloned into our in-house pLESIP lentiviral expression vector for stable transductions. FLAG-β2AR 3S (Ser 355 Gly, Ser 356 Gly, Ser 364 Gly) mutant was prepared as previously described (37). The SNAP-β2AR plasmid used for imaging studies was purchased from New England Biolabs. Gα transducin and myc-tagged dominant negative RAS mutants (KRAS S17N and HRAS S17N) were purchased from Missouri S&T cDNA Resource Center. PKI and PKI mutant plasmids were prepared as previously described (21). Clathrin light chain-dsRed used for TIRF microscopy was previously described (40). pCDNA3.1+ HA-AVP2R DNA was purchased from cDNA Resource Center (Bloomsburg University, Bloomsburg, PA). The HA-tagged GRK2ct was prepared in our in house pCEFL vector by performing PCR on GRK2 amino acid residues 495-689, with the addition of an N-terminal HA tag. Construct sequence was verified by DNA sequence analysis (NIDCR shared resource facility). Human GNAS ORF (short isoform) was PCR-amplified from reverse-transcribed human total mRNA (FirstChoice® Human Total RNA Survey Panel, Ambion) and cloned into a pCAGGS expression vector (a kind gift from Jun-ichi Miyazaki, Osaka University, Japan). The inserted fragment was sequenced by a Sanger sequencing method (Fasmac, Japan).
Cell Culture
HEK293, Rasless MEFs and Gnas f/f MEFs were cultured in DMEM (Sigma) supplemented with 10% FBS (Sigma) and pen/strep (Sigma). Rasless MEF cells were derived from Nras and Hras knockout mice harboring a floxed allele of Kras as previously described (24). Gnas f/f MEFs were kindly provided by Jean Regard and generated as previously described (41). Gαs knockout HEK293 cells were prepared using CRISPR/Cas9 as previously reported (42).
Generation of the β-arrestin 1 TALEN Knockout HEK293 Cell Line
The Cornell TALEN targeter software was used to identify β-arrestin 1 TALEN sites and check for potential off-target sites (https://tale-nt.cac.cornell.edu/). The β-arrestin 1 TALEN was designed to target the following sequence corresponding to a region of exon 6, in which capital letters correspond to TALEN binding sites and the lower case letters correspond to the spacer region sequence: TCCCTCCAAACCTTCCATGTtctgtgacactgcagccg GGGCCCGAAGACACGGGGAA
TALENs were assembled using the EZ-TAL assembly kit (System Biosciences) and the repeat-variable diresidue (RVD) sequences of the assembled β-arrestin 1 TALENs were as follows: TAL1 RVD: HD HD HD NG HD HD NI NI NI HD HD NG NG HD HD NI NG NH NG TAL2 RVD: NG HD HD HD HD NH NG NH NG HD NG NG HD NH NH NH HD HD HD
A surveyor nuclease assay was performed to confirm targeting of the TALEN at the appropriate β-arrestin 1 locus. Briefly, genomic DNA was isolated using QIAmp DNA isolation kit (Qiagen) and amplified with Accuprime super mix (Life Technologies) using oligos surrounding the TALEN cut site (Forward primer: GTTCAAGAAGGCCAGTCCAAATGGAAAGC, Reverse primer: CTGATGGGTTCTCCATGGTAATAGATCTCC). A surveyor nuclease assay was then performed on PCR-amplified DNA from control-transfected or TALEN-transfected HEK293 cells using the Surveyor Mutation Detection kit (Transgenomic, Inc).
To generate the β-arrestin 1 TALEN knockout (β-arrestin 1 KO) cell line, HEK293 cells were transfected using Turbofect transfection reagent (Fermentas) and clonally selected by limited dilution. Single cell clones were expanded and then screened by surveyor nuclease assay and western blot for loss of β-arrestin 1.
Generation of the β-arr1/β-arr2 CRISPR Double Knockout HEK293 Cell Line
The β-arr1/ 2 CRISPR Knockout HEK293 cell line was generated by simultaneously targeting the ARRB1 and the ARRB2 genes using a CRISPR/Cas9 system as described previously (14, 43) with minor modifications. Designed sgRNA-targeting sequences in the ARRB1 gene were 5′-TTCCCCGTGTCTTCGGGCCCCGG-3′ (ARRB1 target #1; the SpCas9 PAM sequence (NGG) is in bold letters and Apa I recognition site is underlined; note that the sgRNA-targeting sequences are complement to the direction of the ARRB1 transcription) and 5′-CGCCTTCCGCTATGGCCGGGAGG-3′ (ARRB1 target #2; Hap II is underlined). The ARRB1-sgRNA targeting sequences were inserted into the Bbs I site of the pSpCas9(BB)-2A-GFP (PX458) vector (a gift from Feng Zhang, Broad Institute; Addgene plasmid # 42230) using two sets of synthesized oligonucleotides (5′-CACCGTTCCCCGTGTCTTCGGGCCC-3′ and 5′-AAACGGGCCCGAAGACACGGGGAAC-3′; and 5′-CACCGCGCCTTCCGCTATGGCCGGG-3′ and 5′-AAACCCCGGCCATAGCGGAAGGCGC-3′, respectively; custom-synthesized by FASMAC, Japan; note that a guanine nucleotide (G) was introduced at the -21 position of the sgRNA (underlined), which enhances transcription of the sgRNA). Similarly, sgRNA-targeting sequences in the ARRB2 gene were 5′-CCAAAAGCTGTACTACCATGGGG-3′ (ARRB2 target #1; the PAM sequence is in bold letters and the Nco I recognition site is underlined) and 5′-TGACCGGTCCCTGCACCTCGAGG-3′ (ARRB2 target #2; Xho I recognition site is underlined) were inserted using a pair of oligonucleotides (5′-CACCGCCAAAAGCTGTACTACCATG-3′ and 5′-AAACCATGGTAGTACAGCTTTTGGC-3′; ; 5′-CACCGTGACCGGTCCCTGCACCTCG-3′ and 5′-AAACCGAGGTGCAGGGACCGGTCAC-3′, respectively). Correctly inserted sgRNA-encoding sequences were verified by sequencing using a Sanger method (FASMAC, Japan).
HEK293A cells (ThermoFisher Scientific) were seeded into a 12-well plate (50,000 cells per well in 1 mL media) and incubated for 24 h before transfection. A mixture of the ARRB1-targeting vector (0.25 μg) and the ARRB2-targeting vector (0.25 μg) was transfected into the cells using 1.25 μL of Lipofectamine® 2000 (Life Technologies). After three-day incubation, the cells were harvested with trypsin/EDTA and GFP-positive cells were isolated using a SH800 cell sorter (Sony, Japan). The GFP-positive cells were diluted with DMEM supplemented with 10% FBS and penicillin/streptomycin and seeded in 96-well plates to isolate single clone using a limiting dilution method. The seeded 96-well plates were incubated for approximately two weeks with routine addition of fresh media and observation under microscope for their colony appearances. While passaging clonal cells into a 6-well plate, aliquot of cell suspensions was analyzed for mutations in the targeted sites using PCR and restriction enzyme digestion. For mutational analysis of the ARRB1 target #1, PCR was performed using primers (5′-TTAGATGGGGCATGGCTTGG-3′ and 5′-GAGTGGTCCTGTGTGTCCAG-3′) and the PCR amplicon was digested with Apa I (Takara Bio, Japan). Similarly, following primers and restriction enzymes were used: for the ARRB1 target #2, primers (5′-GGCATCCTTCCGGTACTCAC-3′ and 5′-GTCAGGGGCTTCTTGTCCTC-3′) and Hap II; for the ARRB2 target #1, primers (5′-ACGGTGCAGTTTAGACCCTG-3′ and 5′-TGACGGTCTTGGTGGAGTTG-3′) and Nco I; for the ARRB2 target #2, primers (5′-TCCTGCCCCTACTCTGATCC-3′ and 5′-CCCCAGGGTCTAAACTGCAC-3′) and Xho I. A PCR program started with an initial denaturation cycle of 95°C for 2 min, followed by 35 cycles of 95°C for 15 sec, 64°C for 30 sec and 72°C for 30 sec. The resulting PCR product (5 μL) was digested with a corresponding restriction enzyme (0.5 μL) in a reaction buffer (total volume of 10 μL) and incubated at 37°C for 1 h. Digested DNA fragments were analyzed with a MultiNA microchip electrophoresis system (Shimadzu, Japan). Candidate clones that harbored restriction enzyme-resistant PCR fragments were further assessed for their genomic DNA alterations by TA cloning. Lack of functional β-arrestins was also confirmed by assessing protein expression and ligand-stimulated GPCR internalization as described below. For the TA cloning, PCR-amplified genomic DNA fragments using an ExTaq polymerase (Takara Bio, Japan) were gel-purified (Promega) and cloned into a pMD20 T-vector (Takara Bio, Japan). Ligated products were introduced into SCS1 competent cells (Stratagene) and transformed cells were selected on an ampicillin-containing LB plate. At least twelve colonies were picked and inserted fragments were PCR-amplified using the ExTaq polymerase and primers (5′-CAGGAAACAGCTATGAC-3′ (M13 Primer RV) and 5′-GTTTTCCCAGTCACGAC-3′ (M13 Primer M4)) designed to anneal the pME20 T-vectors. PCR products of the transformed pMD20 T-vector were sequenced using the Sanger method (FASMAC, Japan) and the M13 Primer RV.
Transfection, RNAi and Viral Transduction
Transient transfections of plasm id DNAs were performed using lipofectamine 2000 (Invitrogen) reagent for 48 h. Transfections of siRNAs were performed using lipofectamine RNAi Max (Invitrogen) using 50 nM siRNAs for 72 h to achieve RNAi-mediated knockdown. Cells transfected with both siRNA and plasm id DNA were first transfected with siRNA for 24 h, followed by a media change prior to transfection with plasmid DNA for another 48 h.
FLAG-β2AR and FLAG-β2AR 3S lentiviruses were prepared by transfecting HEK293T/17 cells (ATCC CRL-11268) with pLESIP FLAG-β2AR, psPAX2 and VSV-G in a 3:2:1 ratio using Turbofect transfection reagent (Fermentas) and collecting 48 h and 72 h viral supernatants. HEK293, β-arrestin 1 KO cells, Rasless MEFs and Gnas f/f MEFs were transduced by infection with 0.45 μm PVDF-filtered FLAG-β2AR lentivirus with 6 μg/ml of polybrene and then selected with 1 μg/ml puromycin (Invitrogen) to generate stable lines. Expression of FLAG-β2AR was verified by flow cytometry using a FLAG-PE conjugated antibody (Prozyme) and analyzed on a FACSCalibur (BD Biosciences). Adenoviral transductions of Rasless MEFs and Gnas f/f MEFs with adeno-GFP control or adeno-GFP iCre to delete Kras or Gnas (Gas), respectively, involved infection of cells with 2.8×10⁷ pfu/ml of virus plus 6 μg/ml of polybrene for 72 h. Infection was confirmed by fluorescence microscopy for GFP expression and western blot analysis for loss of Ras or Gas in the Cre-infected MEFs.
Internalization Assays
Internalization assays were performed by FLAG-PE surface staining of stably transduced FLAG-β2AR HEK293 and β-arrestin 1 KO cells before and after specified time points of stimulation with 10 μM Isoproterenol. As indicated, cells were transfected with appropriate siRNAs for 72 h prior to internalization assay. Following stimulation, cells were incubated on ice and quickly rinsed with ice-cold PBS. Cells were lifted with 1 mM-EDTA in PBS, centrifuged at 3000 rpm for 5 min at 4°C and stained in a 100 μl volume of 0.5% BSA-PBS with 1.25 μl of FLAG-PE (Prozyme) antibody covered on ice. Cells were washed 3 times with 1 mL of cold 0.5% BSA-PBS and then analyzed on a FACSCalibur (BD Biosciences). Transferrin internalization assays were performed by incubating cells in serum-free DMEM with or without conjugated transferrin-Alexa Fluor 546 (Invitrogen) for 15 min followed by washes with DMEM and PBS and resuspension in 0.5% BSA-PBS for flow cytometry. Flow data analysis and median fluorescence intensity (MFI) values were calculated by FlowJo analysis software on live-gated cells. Percent internalization was calculated based on MFI values as follows: % internalization (1 - MFI time point/MFI unstimulated) × 100.
Cre Luciferase Assay
Cre luciferase assays were performed by seeding HEK293 stably transduced with FLAG-B2AR cells in a poly-lysine coated 24-well plate and culturing in DMEM supplemented with 10% FBS for 24 h. Cells were then co-transfected with 100 ng plasm id DNA or control, 50 ng Cre-firefly luciferase reporter DNA, and 20 ng pRL-renilla luciferase using lipofectamine 2000 (Life Technologies) transfection reagent. The day after transfection, cells were serum starved, treated with appropriate inhibitors when relevant and then stimulated for 6 h with isoproterenol (10 μM) prior to harvesting the cells. For all Cre-luciferase assays, cells were lysed and luciferase activity was determined using Dual-Glo Luciferase Assay Kit (Promega). Chemiluminescence was measured using a BioTek Synergy Neo plate reader and the Cre activation was calculated as the ratio of firefly to renilla luciferase levels. The assays were performed three times in duplicates.
Confocal Microscopy
Confocal immunofluorescence (IF) and live cell images were collected on a Zeiss LSM-700 laser scanning microscope with a 40× oil immersion lens in a multitrack mode using a dual excitation (488 nm for Alexa Fluor 488 and 555 nm for mRFP) and emission (BP 505-530 for Alexa Fluor 488, LP 560 nm for mRFP) filter sets. For experiments examining SNAP-β2AR trafficking, HEK293 and β-arrestin 1 KO cells transfected with SNAP-β2AR and siRNAs as specified were seeded in poly-lysine-coated 35-mm glass-bottomed culture dishes for live cell (MatTek Corporation) or 1-mM coated glass cover slips (Fisher) in a 6-well plate for fixed IF imaging. Cells were labeled with appropriate SNAP surface Alexa Fluor dyes for 30 min at 37°C and then washed 3 × with complete media prior to imaging. Cells for IF were stimulated for indicated times with Iso and then washed with PBS and fixed with 2% formaldehyde – PBS solution for 12 min. Fixed cells were blocked in 10% FBS/PBS and then permeabilized with 0.05% saponin (Sigma) solution and incubated with EEA1 (BD Biosciences) antibody for 1 h at room temperature. Cover slips were washed 3 × 5 min with 10% FBS/PBS and then stained with anti-mouse Alexa Fluor-546 antibody for 1 h at room temperature. Cover slips were washed again and then mounted onto glass slides (Fisher) with Fluorosave (Calbiochem) mounting solution.
Live Cell TIRF Microscopy Imaging
TIRF microscopy was performed at 37°C using a Nikon Ti-E inverted microscope equipped for through-the-objective TIRF microscopy and outfitted with a temperature-, humidity-, and CO2-controlled chamber (Okolab). Images were obtained with an Apo TIRF 100×, 1.49 numerical aperture objective (Nikon) with solid-state lasers of 488, 561, and 647 nm (Keysight Technologies) as light sources. An iXon DU+ DU-897 Andor camera controlled by NIS-Elements 4.1 software was used to acquire image sequences every 2 seconds for 10 minutes. HEK293 cells were transfected with the appropriate Alexa Fluor 647 labeled siRNAs for 24 h, followed by a media change prior to transfection with FLAG-B2AR and clathrin light chain-dsRed for 48 hours. Cells were plated on poly-L-lysine (Sigma) coated 35-mm glass-bottomed culture dishes (MatTek Corporation). Before imaging, cells were labeled 1:1000 with M1 FLAG antibody conjugated to Alexa Fluor 488 Dye for 10 minutes at 37°C, washed, and imaged live in DMEM without phenol red (UCSF Cell Culture Facility) supplemented with 30 mM HEPES, pH 7.4 (UCSF Cell Culture Facility). Cells were stimulated with bath application of 10 μM Isoproterenol at frame 10 of 301 image sequences.
TIRF Microscopy Image Analysis
Acquired image sequences were saved as stacks of 16 bit TIFF files. All quantitative image analysis was performed on unprocessed images using ImageJ software (http://rsb.info.nih.gov/ij, National Institutes of Health, Bethesda, MD). To quantify change in receptor fluorescence over time, fluorescence values of individual cells were measured in five randomly selected regions of interest (ROIs) in the cell over the entire stack. An area of the coverslip lacking cells was used to estimate background fluorescence. Fluorescence values of the five ROIs were background subtracted, averaged, normalized to initial fluorescence values before agonist addition, and then normalized to photobleaching control images. Minimal bleed-through and photobleaching was verified using single-labeled and untreated samples, respectively. To quantify receptor concentration into clathrin-coated pits, a line selection was drawn through several clathrin light chain-dsRed foci, representing clathrin-coated pits, at the indicated time points. The plot profile function was used to measure pixel values along this line in the clathrin light chain-dsRed and FLAG-β2AR channels. Pixel values were then normalized and represented as a percent of maximum fluorescence for each channel.
Western Blot and pERK ELISA
For cell stimulations for western blot, HEK293 and β-arrestin 1 KO cells transfected with siRNAs and Rasless MEFs and Gnas f/f cells treated for 72 h with Adeno-iCre or Adeno-GFP control were left untreated or treated with 10 μM Isoproterenol (Iso) for indicated time points. Additional 3 min stimulations with Forskolin (FSK) (5 mg/ml) or EGF (10 ng/mL) were also performed when indicated. For the experiments done with pharmacological inhibitors, confluent cells were first treated with the vehicle control (DMSO), LY294002 (25 μM) for 1 h, AG1478 (10 μM) for 1 h, U0126 (10 μM) for 90 min, PP1 (10 μM) for 1 h, SU6656 (10 μM) for 1 h, H89 (10 μM) for 1 h, CE3F4 (10 μM) for 1 h, cAMPS-RP (100 μM) for 30 min, SB-590885 (10 μM) for 4 h, GDC-0879 (10 μM) for 4 h or PTX (50 ng/mL) for 16 h before Iso stimulation. For V2R stimulations, 100 nM of AVP was used at the indicated time points. Cells were lysed in RIPA buffer (Sigma) containing a mixture of protease and phosphatase inhibitors (Thermo Scientific) and clarified by centrifugation. Lysates were resolved on SDS-PAGE gels, transferred onto PVDF membranes (Millipore) and probed with appropriate antibodies. Westerns to detect active RAS-GTP were performed using glutathione–Sepharose beads (GE Healthcare) immobilized with the RAS-interactive binding domain of c-Raf-1 fused to glutathione-S-transferase (GST) as previously described (44). For pERK1/2 ELISA (Sandwich ELISA kit #7177, Cell Signaling Technology), cells were cultured in a 12-well plate, stimulated with indicated concentrations of ligands and lysed in 150 μl of provided lysis buffer supplemented with protease and phosphatase inhibitors (Thermo Scientific). ELISA was performed according to manufacturer's instructions and absorbance readings were measured on a BioTek Synergy Neo plate reader.
In-Cell Western Blot and siRNA RAS-GEF Library Screen
Cells for in-cell western blot were cultured to near confluence in a 96 well plate and then stimulated for indicated periods of time with 10 μM Isoproterenol (Iso), then media was discarded and cells were fixed with 4% formaldehyde in PBS for 20 min at room temperature (RT). Cells were then permeabilized with 0.5% Triton X-100 with 200 mM glycine in PBS for 10 min at RT. After washing with PBS, cells were blocked with 3%BSA-PBS for 1 h at RT. The wells were then incubated in primary antibodies diluted in 3% BSA-PBS (rabbit phospho-ERK1/2 at 1:100 and mouse total ERK1/2 at 1:200) overnight at 4°C with gentle rocking. The wells were washed 3 times with 0.1% Tween-20 in PBS for 10 min at RT with gentle shaking. They were then incubated with secondary antibodies diluted in 3% BSA-PBS (Li-cor anti-mouse 680 at 1:1000 and anti-Rabbit-800 at 1:1000) for 1 h at RT with gentle rocking and covered with foil to protect from light. The wells were again washed 3 times with 0.1% Tween-20 in PBS for 10 min at RT with gentle shaking and then imaged on the Odyssey imager. The siRNA Ras-GEF library screen was performed using an in-cell western screen with knockdown of a library of Ras-GEFs (Life Technologies Corporation, D1337830 (Custom gene group)) in HEK293 cells expressing FLAG- β2AR in the presence and absence of Iso stimulation (10 μM).
cAMP Assays
cAMP accumulation from endogenous β2ARs after Iso stimulation (10 μM) was measured using plasmid pGLO-20F (Promega), which encodes a circularly permutated luciferase cAMP reporter. HEK293 cells were transfected with appropriate siRNAs for 24 h, followed by a media change prior to transfection with pGLO-20F plasm id DNA using Lipofectamine 3000 (Invitrogen) transfection reagent for 24 h. Cells were then assayed as previously described (37). For each siRNA treatment, reference wells were treated with 5 μM forskolin (FSK) and all experimental cAMP measurements were normalized to the maximum luminescence value measured in the presence of FSK to control for cell number and DNA transfection efficiencies after siRNA treatment. Another cAMP assay was performed using the HTRF cAMP assay kit from CisBio (cAMP dynamic 2 Kit #62AM4PEB) to monitor cAMP levels stimulated by Iso (10 μM) in HEK293 control cells, Gαs KO cells, and Gαs KO cells reconstituted via Gαs transfection. Fluorescence measurements were made using a Victor2 plate reader.
Membrane Preparation
HEK293 parental and β-arr 1/2 KO cell lines were transfected with FLAG-β2AR DNA and membranes were harvested 48 hours later at confluence. Membranes were harvested in warm harvesting buffer (0.68 mM EDTA, 150 mM NaCl, 20 mM HEPES, pH 7.4) and washed with PBS. Cell suspension was centrifuged for 3 minutes at 2000 rpm and supernatant removed. Cells were homogenized in cold membrane preparation buffer (10 mM HEPES, 10 mM NaCl, 0.5 mM MgCl2, 0.5 mM EGTA, pH 7.4) and centrifuged at 15,000 rpm for 20 minutes at 4°C. Process was repeated twice and supernatant removed. Cells were resuspended in cold binding assay buffer (10 mM HEPES, 10 mM NaCl, 0.5 mM MgCl2, 1mM ascorbic acid, pH 7.4) and sonicated. Protein concentrations were measured by DC protein assay (Bio-Rad).
Radioligand Binding Assay
In a polypropylene 96 well plate, binding assay buffer or propranolol (50 μM final for nonspecific binding), [3H] dihydroalprenolol (2 nM final), and membranes (5 μg per well) were plated in order and incubated for 2 hours at room temperature to reach equilibrium. GF/C filterplates were prepared with 0.3% polyethylenimine (PEI) to minimize nonspecific binding. Samples were transferred to the filterplates, washed with cold assay buffer, and dried overnight. Each well was counted in Microscint 0™ (Perkin Elmer) for 1 minute in triplicate.
Statistical Analyses
Statistical analyses of data were performed using GraphPad Prism 7 software (GraphPad Software, CA). The data were analyzed by ANOVA test or t-test. The mean differences of three independent experiments were considered significant when p values were < 0.05. Non-linear regression (least squares fit) analysis was used to fit curves and determine the EC50 and Emax values.
Supplementary Material
Fig. S1. Transferrin uptake experiments and gDNA sequencing of the β-arr1 KO cell line. A) Quantification of median fluorescence intensity (MFI) of 15 min transferrin-546 uptake by flow cytometry in 293 FLAG-β2AR and 293 FLAG-β2AR 3S cells); mean of three independent experiments +/- SD.B) Sequence chromatogram of genomic DNA (gDNA) surrounding the β-arr1 TALEN cut site in the β-arr1 KO clone (top) and HEK293 WT control (bottom). C) Flow cytometry quantification of MFI of 15 min transferrin-546 uptake in 293 FLAG-β2AR, β-arr1 KO, and β-arr1-less cells); mean of three independent experiments +/-SD. Statistical significance was determined based on an ANOVA test, ns indicates not significant.
Fig. S2. Clathrin is important for isoproterenol-mediated β2AR internalization. A) TIRF microscopy image of FLAG-β2AR (green) and clathrin coated pits (red) in 293 FLAG-β2AR cells transfected with siRNA against β-arr2, before and after 5 min Iso stimulation. Graphs on the right hand side depict the overlap in fluorescence intensity across the cell, as shown by the designated lines, between FLAG-β2AR (green) and clathrin coated pits (red) as an indication of colocalization. Representative of three independent experiments. Scale bar, X. B) Western blot showing knockdown of clathrin heavy chain (siCHC) and α-tubulin loading control (left, representative of three independent experiments) and a flow-cytometry based internalization assay comparing FLAG-β2AR internalization upon knockdown of CHC with β-arr1-less, β-arr1 KO and 293 siCont cells (right); mean of three independent experiments +/- SD.
Fig. S3. Depletion of both β-arr1 and β-arr2 increase β2AR-mediated cAMP production. Measurement of cAMP luminescence over time after Iso stimulation (10 μM) in 293 and β-arr1 KO FLAG-β2AR cells transfected with siRNA control (siCont) or siβ-arr2. β-arr-less cells are β-arr1 KO cells transfected with siRNA to β-arr2. Representative of three independent experiments.
Fig. S4. Sequence of β-arrestin1/2-double mutant cells. (A, B) Genomic sequences of the two mutant clones (A, CL1; B, CL2) near sgRNA-targeted sites. sgRNA target sequences are boxed and PAM sequences (NGG) are underlined. Arrows indicate a putative double-stranded break site. Restriction enzyme sites (Apa I (ARRB1 target #1), Nco I (ARRB2 target #2), Hap II (ARRB1 target #2) and Xho I (ARRB2 target #2)) are highlighted in red. Sequences in capital and lower letters indicate exons and introns, respectively. Note that all mutant alleles in CL1 and CL2 were found to carry frame-shift mutations. (C, D) Alignment of deduced amino acids of the β-arrestin1/2-double mutant cells. Three critical loops of β-arrestin are boxed in red. Note that all truncated proteins encoded by the mutant alleles lack the Lariat loop.
Fig. S5. Expression of β2AR (endogenous and transfected) in parental 293 and β-arr 1/2 KO cells and β2AR and V2R internalization in these cells. A) Expression of β2AR, endogenous and transfected, in parental 293 and β-arr 1/2 KO cell lines. Specific binding of [3H] dihydroalprenolol ([3H] DHAP) at equilibrium in mock transfected parental 293 and β-arr 1/2 KO cells compared with 1 μg FLAG-β2AR transfected cells. Results shown are a representative triplicate experiment from three independent experiments. Mean and SEM values are plotted. (B and C) Parental HEK293 cells or β-arr1/2-DKO cells (CL1 or CL2) were transfected with a plasmid encoding N-terminally FLAG epitope-tagged β2AR (B) or N-terminally FLAG epitope-tagged V2R (C). The cells were treated with or without ligand (Iso, isoproterenol; AVP, arginine vasopressin) for 1 h and GPCR on cell surface was labeled with a primary antibody against the FLAG epitope tag, followed by a secondary antibody conjugated with Alexa 488. Approximately 20,000 cells were analyzed by a flow cytometer. Mean fluorescent intensity (MFI) was used to represent cell surface GPCRs and normalized by that in vehicle-treated condition. Data are mean ± SEM of four to five independent experiments, each performed in biological triplicates. ***, p < 0.001 based on t-test. ns, not significant.
Fig. S6. β-arrestin is not required for ERK phosphorylation in arginine vasopressin receptor 2 (AVP2R) expressing cells. Time course of vasopressin (100 nM) stimulation in parental 293 and β-arr 1/2 KO cell lines transfected with 4 μg HA-AVPR2. Western blot for ERK phosphorylation (pERK), total ERK, and α-tubulin. Results represent three independent experiments.
Fig. S7. Stable expression of FLAG-β2AR on Gnas f/f MEFs and Gαs KO cells and effect of EPAC inhibition on isoproterenol-mediated ERK phosphorylation and RAP1A activation. A) Flow cytometry analysis of stably-expressed FLAG-β2AR relative to isotype control in Gnas f/f MEFs. Representative of three independent experiments. B) Flow cytometry analysis of FLAG-β2AR in Gαs KO and parental cells relative to isotype control. Representative of three independent experiments. C) Western blot showing the amounts of pERK in 293 FLAG-β2AR cells pretreated with DMSO control or CE3F4 (10 μM), unstimulated or stimulated for 3 min or 10 min with Iso (10 μM). Representative of three independent experiments. D) Western blot showing active RAP1A pull down (IP) and control input levels of RAP1A and α-tubulin at 3 min and 10 min Iso stimulations (10 μM) following pretreatment with DMSO control (Cont) or the EPAC inhibitor CE3F4 (10 μM). Stimulations with the EPAC analog 8-pCPT-2′-O-Me-cAMP (2Me) at 100 μM and thrombin (Th) at 0.1 Units/ml were used as positive controls for pull down of active RAP1A. Representative of two independent experiments.
Fig. S8. EGFR, PI3K, and Gαi signaling are dispensable for activation of ERK by β2AR, but Gβγ signaling is important. A) Western blot showing the amounts of pERK and total ERK and α-tubulin as loading controls in 293 FLAG-β2AR cells pretreated with DMSO control or the EGFR inhibitor AG1478 (10 μM), unstimulated (-) or stimulated (+) for 3 min with Iso (10 μM, left) or EGF (10 ng/mL, right). Representative of three independent experiments. B) Western blot showing the amounts of pERK and pAkt (S473) relative to total protein controls and α-tubulin in 293 FLAG-β2AR cells pretreated with DMSO control or the PI3K inhibitor LY294002 (25 μM), unstimulated (-) or stimulated (+) for 3 min with Iso (10 μM). Representative of three independent experiments. C) Western blot showing the amounts of pERK and total ERK and α-tubulin as loading controls in 293 FLAG-β2AR control cells or cells pretreated with pertussis toxin (PTX) to block Gi signaling (50 ng/mL), unstimulated (-) or stimulated (+) for 3 min with Iso (10 μM, left) or EGF (10 ng/mL, right). Representative of three independent experiments. D) Flow cytometry profile of stably-expressed FLAG-β2AR relative to isotype control in Rasless MEFs. Representative of X three independent experiments.. E) Western blot showing the amounts of pSHC, and total SHC and α-tubulin as loading controls, in 293 FLAG-β2AR cells transfected with control plasmid or GRK2ct plasmid, unstimulated (-) or stimulated (+) for 3 min with Iso (10 μM). Representative of three independent experiments.
Movie S1. Live cell confocal imaging of β2AR internalization in HEK293 cells. Live cell confocal microscopy imaging of SNAP-β2AR-488 on 293 cells over a 20 time course of Iso (10 μM) stimulation.
Movie S2. Live cell confocal imaging of β2AR internalization in β-arr1 KO cells. Live cell confocal microscopy imaging of SNAP-β2AR-488 on β-arr1 KO cells over a 20 time course of Iso (10 μM) stimulation.
Movie S3. Live cell confocal imaging of β2AR internalization in β-arr-less cells. Live cell confocal microscopy imaging of SNAP-β2AR-488 on β-arr-less over a 20 time course of Iso (10 μM) stimulation.
Movie S4. Live cell TIRF imaging of β2AR internalization into clathrin coated pits in HEK293 cells. Live cell TIRF imaging of FLAG-β2AR-488 (green) and clathrin light chain (CLC)-dsRed (red) on 293 cells over a 870 s time course of Iso (10 μM) stimulation.
Movie S5. Live cell TIRF imaging of β2AR internalization into clathrin coated pits in β-arr1 KO cells. Live cell TIRF imaging of FLAG-β2AR-488 (green) and clathrin light chain (CLC)-dsRed (red) on β-arr1 KO cells over a 870 s time course of Iso (10 μM) stimulation.
Movie S6. Live cell TIRF imaging of β2AR internalization into clathrin coated pits in β-arr-less cells. Live cell TIRF imaging of FLAG-β2AR-488 (green) and clathrin light chain (CLC)-dsRed (red) on β-arr-less cells over a 870 s time course of Iso (10 μM) stimulation.
Acknowledgments
We thank Drs. Mariano Barbacid and Eugenio Santos, and Dr. Jean Regard for providing the RasLess (Hras and Nras knock out and floxed Kras) and Gnas floxed mouse embryo fibroblasts used in these studies, respectively.
Funding: This study was partially supported by NIDCR intramural program at NIH (JSG and MO). AI received funding from Japan Science and Technology Agency (JST), Precursory Research for Embryonic Science and Technology (PRESTO) and JA received funding from Japan Agency for Medical Research and Development, Core Research for Evolutional Science and Technology (AMED-CREST). JSG received funding from UCSD Moores Cancer Center and Department of Pharmacology. MvZ received funding from the National Institute on Drug Abuse (DA 012864, DA06511). KE is a recipient of a NSF Graduate Research Fellowship. DJS was supported in part by the UCSD Graduate Training Program in Cellular and Molecular Pharmacology through an institutional training grant from the National Institute of General Medical Sciences, T32 GM007752.
Footnotes
Author contributions: MO, KE, SA, XZ, XF, KK, DJS and AI performed experiments. MO, KE, and AI analyzed the data. MO, KE, AI, JA, MvZ and JSG designed the experiments. MO and JSG wrote the paper and all authors reviewed and edited the paper.
Competing interests: The authors declare that they have no competing interests.
References and Notes
- 1.Pierce KL, Premont RT, Lefkowitz RJ. Seven-transmembrane receptors. Nature reviews Molecular cell biology. 2002;3:639–650. doi: 10.1038/nrm908. [DOI] [PubMed] [Google Scholar]
- 2.Rask-Andersen M, Almen MS, Schioth HB. Trends in the exploitation of novel drug targets. Nature reviews Drug discovery. 2011;10:579–590. doi: 10.1038/nrd3478. [DOI] [PubMed] [Google Scholar]
- 3.Rasmussen SG, et al. Structure of a nanobody-stabilized active state of the beta(2) adrenoceptor. Nature. 2011;469:175–180. doi: 10.1038/nature09648. [DOI] [PMC free article] [PubMed] [Google Scholar]
- 4.Gurevich VV, Gurevich EV. The structural basis of arrestin-mediated regulation of G-protein-coupled receptors. Pharmacology & therapeutics. 2006;110:465–502. doi: 10.1016/j.pharmthera.2005.09.008. [DOI] [PMC free article] [PubMed] [Google Scholar]
- 5.Carman CV, Benovic JL. G-protein-coupled receptors: turn-ons and turn-offs. Current opinion in neurobiology. 1998;8:335–344. doi: 10.1016/s0959-4388(98)80058-5. [DOI] [PubMed] [Google Scholar]
- 6.Manglik A, et al. Structural Insights into the Dynamic Process of beta2-Adrenergic Receptor Signaling. Cell. 2015;161:1101–1111. doi: 10.1016/j.cell.2015.04.043. [DOI] [PMC free article] [PubMed] [Google Scholar]
- 7.Nygaard R, et al. The dynamic process of beta(2)-adrenergic receptor activation. Cell. 2013;152:532–542. doi: 10.1016/j.cell.2013.01.008. [DOI] [PMC free article] [PubMed] [Google Scholar]
- 8.Shenoy SK, Lefkowitz RJ. Seven-transmembrane receptor signaling through beta-arrestin. Science′s STKE : signal transduction knowledge environment. 2005;2005:cm10. doi: 10.1126/stke.2005/308/cm10. [DOI] [PubMed] [Google Scholar]
- 9.Shenoy SK, Lefkowitz RJ. beta-Arrestin-mediated receptor trafficking and signal transduction. Trends in pharmacological sciences. 2011;32:521–533. doi: 10.1016/j.tips.2011.05.002. [DOI] [PMC free article] [PubMed] [Google Scholar]
- 10.Ahn S, Nelson CD, Garrison TR, Miller WE, Lefkowitz RJ. Desensitization, internalization, and signaling functions of beta-arrestins demonstrated by RNA interference. Proceedings of the National Academy of Sciences of the United States of America. 2003;100:1740–1744. doi: 10.1073/pnas.262789099. [DOI] [PMC free article] [PubMed] [Google Scholar]
- 11.Shenoy SK, et al. beta-arrestin-dependent, G protein-independent ERK1/2 activation by the beta2 adrenergic receptor. The Journal of biological chemistry. 2006;281:1261–1273. doi: 10.1074/jbc.M506576200. [DOI] [PubMed] [Google Scholar]
- 12.Wisler JW, et al. A unique mechanism of beta-blocker action: carvedilol stimulates beta-arrestin signaling. Proceedings of the National Academy of Sciences of the United States of America. 2007;104:16657–16662. doi: 10.1073/pnas.0707936104. [DOI] [PMC free article] [PubMed] [Google Scholar]
- 13.Hausdorff WP, et al. A small region of the beta-adrenergic receptor is selectively involved in its rapid regulation. Proceedings of the National Academy of Sciences of the United States of America. 1991;88:2979–2983. doi: 10.1073/pnas.88.8.2979. [DOI] [PMC free article] [PubMed] [Google Scholar]
- 14.Ran FA, et al. Genome engineering using the CRISPR-Cas9 system. Nature protocols. 2013;8:2281–2308. doi: 10.1038/nprot.2013.143. [DOI] [PMC free article] [PubMed] [Google Scholar]
- 15.Cermak T, et al. Efficient design and assembly of custom TALEN and other TAL effector-based constructs for DNA targeting. Nucleic acids research. 2011;39:e82. doi: 10.1093/nar/gkr218. [DOI] [PMC free article] [PubMed] [Google Scholar]
- 16.Conner DA, et al. beta-Arrestin1 knockout mice appear normal but demonstrate altered cardiac responses to beta-adrenergic stimulation. Circulation research. 1997;81:1021–1026. doi: 10.1161/01.res.81.6.1021. [DOI] [PubMed] [Google Scholar]
- 17.Gurevich EV, Benovic JL, Gurevich VV. Arrestin2 expression selectively increases during neural differentiation. Journal of neurochemistry. 2004;91:1404–1416. doi: 10.1111/j.1471-4159.2004.02830.x. [DOI] [PubMed] [Google Scholar]
- 18.Lohse MJ, Benovic JL, Codina J, Caron MG, Lefkowitz RJ. beta-Arrestin: a protein that regulates beta-adrenergic receptor function. Science. 1990;248:1547–1550. doi: 10.1126/science.2163110. [DOI] [PubMed] [Google Scholar]
- 19.Lochner A, Moolman JA. The many faces of H89: a review. Cardiovascular drug reviews. 2006;24:261–274. doi: 10.1111/j.1527-3466.2006.00261.x. [DOI] [PubMed] [Google Scholar]
- 20.Bain J, et al. The selectivity of protein kinase inhibitors: a further update. The Biochemical journal. 2007;408:297–315. doi: 10.1042/BJ20070797. [DOI] [PMC free article] [PubMed] [Google Scholar]
- 21.Iglesias-Bartolome R, et al. Inactivation of a Galpha(s)-PKA tumour suppressor pathway in skin stem cells initiates basal-cell carcinogenesis. Nature cell biology. 2015;17:793–803. doi: 10.1038/ncb3164. [DOI] [PMC free article] [PubMed] [Google Scholar]
- 22.DeFea KA, et al. beta-arrestin-dependent endocytosis of proteinase-activated receptor 2 is required for intracellular targeting of activated ERK1/2. The Journal of cell biology. 2000;148:1267–1281. doi: 10.1083/jcb.148.6.1267. [DOI] [PMC free article] [PubMed] [Google Scholar]
- 23.Luttrell LM, et al. Activation and targeting of extracellular signal-regulated kinases by beta-arrestin scaffolds. Proceedings of the National Academy of Sciences of the United States of America. 2001;98:2449–2454. doi: 10.1073/pnas.041604898. [DOI] [PMC free article] [PubMed] [Google Scholar]
- 24.Drosten M, et al. Genetic analysis of Ras signalling pathways in cell proliferation, migration and survival. The EMBO journal. 2010;29:1091–1104. doi: 10.1038/emboj.2010.7. [DOI] [PMC free article] [PubMed] [Google Scholar]
- 25.Fernandez-Medarde A, Santos E. The RasGrf family of mammalian guanine nucleotide exchange factors. Biochimica et biophysica acta. 2011;1815:170–188. doi: 10.1016/j.bbcan.2010.11.001. [DOI] [PubMed] [Google Scholar]
- 26.Koch WJ, Inglese J, Stone WC, Lefkowitz RJ. The binding site for the beta gamma subunits of heterotrimeric G proteins on the beta-adrenergic receptor kinase. The Journal of biological chemistry. 1993;268:8256–8260. [PubMed] [Google Scholar]
- 27.Luttrell LM, Lefkowitz RJ. The role of beta-arrestins in the termination and transduction of G-protein-coupled receptor signals. J Cell Sci. 2002;115:455–465. doi: 10.1242/jcs.115.3.455. [DOI] [PubMed] [Google Scholar]
- 28.Kohout TA, Lin FS, Perry SJ, Conner DA, Lefkowitz RJ. beta-Arrestin 1 and 2 differentially regulate heptahelical receptor signaling and trafficking. Proceedings of the National Academy of Sciences of the United States of America. 2001;98:1601–1606. doi: 10.1073/pnas.041608198. [DOI] [PMC free article] [PubMed] [Google Scholar]
- 29.Ma YC, Huang J, Ali S, Lowry W, Huang XY. Src tyrosine kinase is a novel direct effector of G proteins. Cell. 2000;102:635–646. doi: 10.1016/s0092-8674(00)00086-6. [DOI] [PubMed] [Google Scholar]
- 30.Schmitt JM, Stork PJ. Galpha and Gbeta gamma require distinct Src-dependent pathways to activate Rap1 and Ras. The Journal of biological chemistry. 2002;277:43024–43032. doi: 10.1074/jbc.M204006200. [DOI] [PubMed] [Google Scholar]
- 31.Pierce KL, Lefkowitz RJ. Classical and new roles of beta-arrestins in the regulation of G-protein-coupled receptors. Nature reviews Neuroscience. 2001;2:727–733. doi: 10.1038/35094577. [DOI] [PubMed] [Google Scholar]
- 32.Alvarez-Curto E, et al. Targeted Elimination of G Proteins and Arrestins Defines Their Specific Contributions to Both Intensity and Duration of G Protein-coupled Receptor Signaling. The Journal of biological chemistry. 2016;291:27147–27159. doi: 10.1074/jbc.M116.754887. [DOI] [PMC free article] [PubMed] [Google Scholar]
- 33.Wang Q, et al. Spinophilin blocks arrestin actions in vitro and in vivo at G protein-coupled receptors. Science. 2004;304:1940–1944. doi: 10.1126/science.1098274. [DOI] [PubMed] [Google Scholar]
- 34.Luo J, Busillo JM, Benovic JL. M3 muscarinic acetylcholine receptor-mediated signaling is regulated by distinct mechanisms. Molecular pharmacology. 2008;74:338–347. doi: 10.1124/mol.107.044750. [DOI] [PMC free article] [PubMed] [Google Scholar]
- 35.Thomsen AR, et al. GPCR-G Protein-beta-Arrestin Super-Complex Mediates Sustained G Protein Signaling. Cell. 2016;166:907–919. doi: 10.1016/j.cell.2016.07.004. [DOI] [PMC free article] [PubMed] [Google Scholar]
- 36.Vilardaga JP, Jean-Alphonse FG, Gardella TJ. Endosomal generation of cAMP in GPCR signaling. Nature chemical biology. 2014;10:700–706. doi: 10.1038/nchembio.1611. [DOI] [PMC free article] [PubMed] [Google Scholar]
- 37.Irannejad R, et al. Conformational biosensors reveal GPCR signalling from endosomes. Nature. 2013;495:534–538. doi: 10.1038/nature12000. [DOI] [PMC free article] [PubMed] [Google Scholar]
- 38.Hancock JF. Ras proteins: different signals from different locations. Nature reviews Molecular cell biology. 2003;4:373–384. doi: 10.1038/nrm1105. [DOI] [PubMed] [Google Scholar]
- 39.Eichel K, Jullie D, von Zastrow M. beta-Arrestin drives MAP kinase signalling from clathrin-coated structures after GPCR dissociation. Nature cell biology. 2016;18:303–310. doi: 10.1038/ncb3307. [DOI] [PMC free article] [PubMed] [Google Scholar]
- 40.Merrifield CJ, Feldman ME, Wan L, Almers W. Imaging actin and dynamin recruitment during invagination of single clathrin-coated pits. Nature cell biology. 2002;4:691–698. doi: 10.1038/ncb837. [DOI] [PubMed] [Google Scholar]
- 41.Regard JB, et al. Wnt/beta-catenin signaling is differentially regulated by Galpha proteins and contributes to fibrous dysplasia. Proceedings of the National Academy of Sciences of the United States of America. 2011;108:20101–20106. doi: 10.1073/pnas.1114656108. [DOI] [PMC free article] [PubMed] [Google Scholar]
- 42.Stallaert W, et al. Purinergic receptor transactivation by the beta2-adrenergic receptor increases intracellular Ca2+ in non-excitable cells. Molecular pharmacology. 2017 doi: 10.1124/mol.116.106419. [DOI] [PubMed] [Google Scholar]
- 43.Schrage R, et al. The experimental power of FR900359 to study Gq-regulated biological processes. Nature communications. 2015;6:10156. doi: 10.1038/ncomms10156. [DOI] [PMC free article] [PubMed] [Google Scholar]
- 44.Chen JJ, Mikelis CM, Zhang Y, Gutkind JS, Zhang B. TRAIL induces apoptosis in oral squamous carcinoma cells--a crosstalk with oncogenic Ras regulated cell surface expression of death receptor 5. Oncotarget. 2013;4:206–217. doi: 10.18632/oncotarget.813. [DOI] [PMC free article] [PubMed] [Google Scholar]
Associated Data
This section collects any data citations, data availability statements, or supplementary materials included in this article.
Supplementary Materials
Fig. S1. Transferrin uptake experiments and gDNA sequencing of the β-arr1 KO cell line. A) Quantification of median fluorescence intensity (MFI) of 15 min transferrin-546 uptake by flow cytometry in 293 FLAG-β2AR and 293 FLAG-β2AR 3S cells); mean of three independent experiments +/- SD.B) Sequence chromatogram of genomic DNA (gDNA) surrounding the β-arr1 TALEN cut site in the β-arr1 KO clone (top) and HEK293 WT control (bottom). C) Flow cytometry quantification of MFI of 15 min transferrin-546 uptake in 293 FLAG-β2AR, β-arr1 KO, and β-arr1-less cells); mean of three independent experiments +/-SD. Statistical significance was determined based on an ANOVA test, ns indicates not significant.
Fig. S2. Clathrin is important for isoproterenol-mediated β2AR internalization. A) TIRF microscopy image of FLAG-β2AR (green) and clathrin coated pits (red) in 293 FLAG-β2AR cells transfected with siRNA against β-arr2, before and after 5 min Iso stimulation. Graphs on the right hand side depict the overlap in fluorescence intensity across the cell, as shown by the designated lines, between FLAG-β2AR (green) and clathrin coated pits (red) as an indication of colocalization. Representative of three independent experiments. Scale bar, X. B) Western blot showing knockdown of clathrin heavy chain (siCHC) and α-tubulin loading control (left, representative of three independent experiments) and a flow-cytometry based internalization assay comparing FLAG-β2AR internalization upon knockdown of CHC with β-arr1-less, β-arr1 KO and 293 siCont cells (right); mean of three independent experiments +/- SD.
Fig. S3. Depletion of both β-arr1 and β-arr2 increase β2AR-mediated cAMP production. Measurement of cAMP luminescence over time after Iso stimulation (10 μM) in 293 and β-arr1 KO FLAG-β2AR cells transfected with siRNA control (siCont) or siβ-arr2. β-arr-less cells are β-arr1 KO cells transfected with siRNA to β-arr2. Representative of three independent experiments.
Fig. S4. Sequence of β-arrestin1/2-double mutant cells. (A, B) Genomic sequences of the two mutant clones (A, CL1; B, CL2) near sgRNA-targeted sites. sgRNA target sequences are boxed and PAM sequences (NGG) are underlined. Arrows indicate a putative double-stranded break site. Restriction enzyme sites (Apa I (ARRB1 target #1), Nco I (ARRB2 target #2), Hap II (ARRB1 target #2) and Xho I (ARRB2 target #2)) are highlighted in red. Sequences in capital and lower letters indicate exons and introns, respectively. Note that all mutant alleles in CL1 and CL2 were found to carry frame-shift mutations. (C, D) Alignment of deduced amino acids of the β-arrestin1/2-double mutant cells. Three critical loops of β-arrestin are boxed in red. Note that all truncated proteins encoded by the mutant alleles lack the Lariat loop.
Fig. S5. Expression of β2AR (endogenous and transfected) in parental 293 and β-arr 1/2 KO cells and β2AR and V2R internalization in these cells. A) Expression of β2AR, endogenous and transfected, in parental 293 and β-arr 1/2 KO cell lines. Specific binding of [3H] dihydroalprenolol ([3H] DHAP) at equilibrium in mock transfected parental 293 and β-arr 1/2 KO cells compared with 1 μg FLAG-β2AR transfected cells. Results shown are a representative triplicate experiment from three independent experiments. Mean and SEM values are plotted. (B and C) Parental HEK293 cells or β-arr1/2-DKO cells (CL1 or CL2) were transfected with a plasmid encoding N-terminally FLAG epitope-tagged β2AR (B) or N-terminally FLAG epitope-tagged V2R (C). The cells were treated with or without ligand (Iso, isoproterenol; AVP, arginine vasopressin) for 1 h and GPCR on cell surface was labeled with a primary antibody against the FLAG epitope tag, followed by a secondary antibody conjugated with Alexa 488. Approximately 20,000 cells were analyzed by a flow cytometer. Mean fluorescent intensity (MFI) was used to represent cell surface GPCRs and normalized by that in vehicle-treated condition. Data are mean ± SEM of four to five independent experiments, each performed in biological triplicates. ***, p < 0.001 based on t-test. ns, not significant.
Fig. S6. β-arrestin is not required for ERK phosphorylation in arginine vasopressin receptor 2 (AVP2R) expressing cells. Time course of vasopressin (100 nM) stimulation in parental 293 and β-arr 1/2 KO cell lines transfected with 4 μg HA-AVPR2. Western blot for ERK phosphorylation (pERK), total ERK, and α-tubulin. Results represent three independent experiments.
Fig. S7. Stable expression of FLAG-β2AR on Gnas f/f MEFs and Gαs KO cells and effect of EPAC inhibition on isoproterenol-mediated ERK phosphorylation and RAP1A activation. A) Flow cytometry analysis of stably-expressed FLAG-β2AR relative to isotype control in Gnas f/f MEFs. Representative of three independent experiments. B) Flow cytometry analysis of FLAG-β2AR in Gαs KO and parental cells relative to isotype control. Representative of three independent experiments. C) Western blot showing the amounts of pERK in 293 FLAG-β2AR cells pretreated with DMSO control or CE3F4 (10 μM), unstimulated or stimulated for 3 min or 10 min with Iso (10 μM). Representative of three independent experiments. D) Western blot showing active RAP1A pull down (IP) and control input levels of RAP1A and α-tubulin at 3 min and 10 min Iso stimulations (10 μM) following pretreatment with DMSO control (Cont) or the EPAC inhibitor CE3F4 (10 μM). Stimulations with the EPAC analog 8-pCPT-2′-O-Me-cAMP (2Me) at 100 μM and thrombin (Th) at 0.1 Units/ml were used as positive controls for pull down of active RAP1A. Representative of two independent experiments.
Fig. S8. EGFR, PI3K, and Gαi signaling are dispensable for activation of ERK by β2AR, but Gβγ signaling is important. A) Western blot showing the amounts of pERK and total ERK and α-tubulin as loading controls in 293 FLAG-β2AR cells pretreated with DMSO control or the EGFR inhibitor AG1478 (10 μM), unstimulated (-) or stimulated (+) for 3 min with Iso (10 μM, left) or EGF (10 ng/mL, right). Representative of three independent experiments. B) Western blot showing the amounts of pERK and pAkt (S473) relative to total protein controls and α-tubulin in 293 FLAG-β2AR cells pretreated with DMSO control or the PI3K inhibitor LY294002 (25 μM), unstimulated (-) or stimulated (+) for 3 min with Iso (10 μM). Representative of three independent experiments. C) Western blot showing the amounts of pERK and total ERK and α-tubulin as loading controls in 293 FLAG-β2AR control cells or cells pretreated with pertussis toxin (PTX) to block Gi signaling (50 ng/mL), unstimulated (-) or stimulated (+) for 3 min with Iso (10 μM, left) or EGF (10 ng/mL, right). Representative of three independent experiments. D) Flow cytometry profile of stably-expressed FLAG-β2AR relative to isotype control in Rasless MEFs. Representative of X three independent experiments.. E) Western blot showing the amounts of pSHC, and total SHC and α-tubulin as loading controls, in 293 FLAG-β2AR cells transfected with control plasmid or GRK2ct plasmid, unstimulated (-) or stimulated (+) for 3 min with Iso (10 μM). Representative of three independent experiments.
Movie S1. Live cell confocal imaging of β2AR internalization in HEK293 cells. Live cell confocal microscopy imaging of SNAP-β2AR-488 on 293 cells over a 20 time course of Iso (10 μM) stimulation.
Movie S2. Live cell confocal imaging of β2AR internalization in β-arr1 KO cells. Live cell confocal microscopy imaging of SNAP-β2AR-488 on β-arr1 KO cells over a 20 time course of Iso (10 μM) stimulation.
Movie S3. Live cell confocal imaging of β2AR internalization in β-arr-less cells. Live cell confocal microscopy imaging of SNAP-β2AR-488 on β-arr-less over a 20 time course of Iso (10 μM) stimulation.
Movie S4. Live cell TIRF imaging of β2AR internalization into clathrin coated pits in HEK293 cells. Live cell TIRF imaging of FLAG-β2AR-488 (green) and clathrin light chain (CLC)-dsRed (red) on 293 cells over a 870 s time course of Iso (10 μM) stimulation.
Movie S5. Live cell TIRF imaging of β2AR internalization into clathrin coated pits in β-arr1 KO cells. Live cell TIRF imaging of FLAG-β2AR-488 (green) and clathrin light chain (CLC)-dsRed (red) on β-arr1 KO cells over a 870 s time course of Iso (10 μM) stimulation.
Movie S6. Live cell TIRF imaging of β2AR internalization into clathrin coated pits in β-arr-less cells. Live cell TIRF imaging of FLAG-β2AR-488 (green) and clathrin light chain (CLC)-dsRed (red) on β-arr-less cells over a 870 s time course of Iso (10 μM) stimulation.