

Abstract
Our objective was to validate the International Harmonization Project (IHP) PET response criteria, correlate with the Deauville criteria and diagnostic CT-based (dCT) lesion size changes.
Methods
All patients were recruited prospectively to CALGB 50203 trial for treatment of stage I–II, non-bulky HL. FDG-PET and dCT were performed at baseline and after two AVG cycles (PET-2, dCT-2) in 88 patients. IHP, Deauville criteria and percent decrease in the sum of the products of the perpendicular diameters (%SPPD) after 2 cycles were correlated with progression free survival (PFS).
Results
After a median follow-up of 3.3 years, 23.9% of patients relapsed/progressed (3-year PFS:77%). By IHP, the 2-year PFS were 0.88 and 0.54 for PET-2 negative and positive groups, respectively, p=0.0009. Similar results were obtained for Deauville criteria. In a univariate analysis, PET-2 predicted PFS better than %SPPD:in a combinatorial analysis, in the PET-2 positive group, a negative dCT-2 increased PFS by 27–35%. However, some confidence intervals were large due to small sample sizes.
Conclusion
IHP- and Deauville criteria-based interpretation of PET-2 was strongly associated with 2-year PFS. The combined analyses of PET-2 with dCT-2 suggest a better predictive value for PFS compared to either test alone, further studies are underway to confirm these findings.
Introduction
A rapid response to chemotherapy can serve as a better surrogate marker for favorable outcome than tumor size reduction (1–3). Only up to 30% of lymphoma patients with a residual mass on morphologic imaging will relapse (4, 5) while 80–100% of HL patients with persistent FDG uptake after 1–3 chemotherapy cycles have been associated with relapse (6–11). In early stage HL, despite the high negative predictive values, the high rate of false positive findings associated with interim FDG-PET (30%–70%) raised concerns about its potential clinical value (6,7,10,12). Previously published results, however, reported on mixed HL groups whose pre-test risks of relapse are divergent. There is convincing evidence that interim PET is a reliable prognostic test to identify poor responders in advanced-stage HL, but prospective data are lacking in early-stage HL (8, 11,12).
Although major milestones have been achieved in standardizing PET readings in lymphoma, a set of consistent and specific universal criteria has yet to be established. The International Harmonization Project (IHP) led to incorporation of PET into revised international working group (IWG) response criteria for lymphoma (13), however, IHP recommendations which use the FDG uptake in the mediastinal blood pool as a threshold to define a positive PET result, were proposed for end-of-therapy evaluation. With the increasing interest in interim FDG PET as a response surrogate, the so-called “Deauville” (London) criteria, were developed for interpretation of interim scans (14, 15). These criteria use the liver uptake as the reference which provides a higher threshold for a PET positive result. The latter also offers a relatively continuous reading scheme suggesting a higher likelihood of residual disease with increasing levels of minimal residual FDG uptake (MRU) within persistent masses. As almost all sites of MRUs are observed within measurable masses, we hypothesized that combining the size measurement from dCT with FDG metabolic changes would improve the specificity of response evaluation.
Our aim was to examine the response after two cycles of chemotherapy in patients with early stage, non-bulky HL employing IHP criteria as a primary and Deauville criteria as a secondary interpretation scheme along with size changes from dCT to determine the better predictor of clinical outcome.
Patients and Methods
This phase-II multicenter trial CALGB trial included previously untreated patients with histologically documented, non-bulky, stage I–II classical HL with clinical stages I–II, and measurable disease on physical examination or imaging studies (16).
Treatment Scheme
Each doxorubicin, vinblastine, and gemcitabine (AVG) cycle is administered intravenously (IV) on days 1 and 15; treatment cycles were repeated every 28 days for a total of 6 cycles as previously described (16). Responses were determined after 2 cycles and after completion of AVG according to the 1999 version of the International Lymphoma Workshop (IWG) criteria (17).
Imaging
All patients had FDG PET or PET/CT studies and a separate high resolution dCT scan at baseline and after two chemotherapy cycles (PET-2 and dCT-2). No treatment change was made based on the PET-2 results. All scans were performed 0–6 days prior to cycle-3after 4–6 hours of fasting. Emission data were acquired starting approximately 60 min after injection of [18F]FDG.
FDG PET Data Analysis
All scans were centrally read by two reviewers and an adjudicator, who were all blinded to each other’s interpretation and to the clinical information. The primary interpretation was performed by visual assessment in 390 lesions (88 patients) according to the IHP response criteria (13, 18). A secondary PET reading was performed using the Deauville five-point reading scale (14, 15). Scores 4,5 were considered positive. Tumor % sum of the products of perpendicular diameters (SPPD) change was measured between baseline dCT and dCT-2. PET-2 and dCT-2 data was also evaluated using a combinatorial analysis.
Statistical Considerations
This clinical trial was designed to accrue a maximum of 98 patients (16). A total of 88 PET-2and dCT-2 studies were available for analyses. The Kaplan-Meier method (19) was used to estimate progression-free survival (PFS) measured from the time of trial entry until progression or death. Two-sided log-rank test (20) was used to compare PFS between PET-2 negative and positive groups. The positive predictive values (PPV) and negative predictive values (NPV) of PET-2 and dCT-2 were estimated for 2-year PFS. One-sided p values were determined in comparisons of sensitivity and specificity (21). The %SPPD change was determined between baseline dCT and dCT-2. A receiver operator curve (ROC) analysis was performed to determine the best cut-off for %SPPD to define a positive and negative dCT result. Residual disease was assessed among the PET-2 positive patients by biopsy, if feasible or by following until relapse The PET-2 and dCT-2 data were correlated with PFS.
RESULTS
The clinical results of this trial have been published elsewhere (16). The objective of current analyses is to compare IHP criteria with various reading schemes to determine the better criteria for interim response evaluation. Although there was no specific aim of determining interobserver variability, on a patient basis 10 cases required adjudication (11.4%).
A total of 88 patients with complete sets of PET and dCT data were evaluated among 99 assessable patients who were enrolled into this CALGB trial (Table 1). Adverse risk factors for stage I–II disease included age >40 years 37/88 (42%), >3 sites of involvement 57/82 (70%), >4 sites of involvement 40/82 (49%).
Table 1.
Patient Characteristics, FDG-PET Results and Recurrence
| Stage | Number of patients n, (%) | PET-2 positive*n, (%) | PET-2 negative*n, (%) | Recurrence (%) | 2-year PFS |
|---|---|---|---|---|---|
| IA | 7 (8.0%) | 2 (28.6%) | 5 (71.4%) | 28.6% | 71% |
| IIA | 63 (71.6%) | 15 (23.8%) | 48 (76.2%) | 27.0% | 76% |
| IIB | 18 (20.4%) | 7 (38.9%) | 11 (61.1%) | 11.1% | 89% |
| Histology | |||||
| NS | 65 (78.3%) | 17 (26.2%) | 48 (73.8%) | 21.5% | 80% |
| MC | 10 (12.0%) | 3 (30.0%) | 7 (70%) | 20.0% | 80% |
| cHL-u | 7 (8.4%) | 2 (28.6%) | 5 (71.4%) | 42.9% | 57% |
| L-R cHL | 1 (1.2%) | 0 (0.0%) | 1 (100%) | 0.0% | 100% |
|
SPPD> median Baseline, median =23.3 |
44/88 (50%)§ | 16/24 (66.7%), P=0.093∞ 9/16 progressed (56.2%) |
28/64 (43.8%), P=0.093∞ 4/28 progressed (14.3%) |
29.6% (61.9% of all recurrences) |
70% vs. 86%‡ |
|
SPPD > median Post 2-cycle, median =8.3 |
43/87 (50%)§ | 16/24 (66.7%), P=0.058∞ 9/16 progressed (56.2%) |
27/63 (42.9%), P=0.058∞ 5/27 progressed (18.5%) |
32.6% (66.7% of all recurrences) |
70% vs. 86%‡ |
| SPPD median, baseline | 37.9, (p=0.015)∞ | 23.3 | na | na | |
| SPPD median, post-2 cycle | 12.8, (p=0.002)∞ | 7.4 | na | na | |
| Adverse Factors | |||||
| age ≥40 years | 37 (42.0%) | 11 (29.7%) | 26 (70.3%) | 9 (24.3%) | 78% |
| age <40 years | 51 (58.0%) | 13 (25.5%) | 38 (74.5%) | 12 (23.5%) | 78% |
| ≥ 3 sites of involvement | 57 (69.5%) | 16 (28.1%) | 41 (71.9%) | 15 (26.3%) | 77% |
| < 3 sites of involvement | 25 (30.5%) | 7 (28.0%) | 18 (72%) | 4 (16.0%) | 84% |
| ≥ 4 sites of involvement | 40 (48.8%) | 12 (30.0%) | 28 (70%) | 11 (27.5%) | 78% |
| < 4 sites of involvement | 42 (51.2%) | 11 (26.2%) | 31 (73.8) | 8 (19.0%) | 81% |
NS: nodular sclerosis, MC: mixed cellularity cHL-u: classical Hodgkin lymphoma-unspecified L-R cHL: lympocyte-rich classical Hodgkin lymphoma, PFS: progression free survival, SPPD: sum of the product of the perpendicular diameters,
IHP-based results are presented rather than those of Deauville-based to conform to the protocol design,
definition of “median”,
difference between “−” and “+” groups, Wilcoxon Rank Sums test
patients with tm SPPD > median vs. patients with tm SPPD< median
Response, Relapse and Survival
The median follow-up was 3.3 years (range, 1.8 to 5.0 years). The results are summarized in Table 2. Median survival has not been reached for the entire group. No patient progressed within 6 months of therapy. All patients who progressed had received all 6 cycles of therapy. Twenty-one (23.9%) patients relapsed (median PFS, 0.74 years, range 0.53–3.17 years). Thirteen relapses were within primary sites, 7 in both primary and new sites, only 1 (4.8%) at a new site. One of the 88 patients died as result of HL progression. The 2-year and 3-year PFS were 78% [CI: 68%–86%] and 77%, [CI: 67%–85%], respectively (Table 2).
Table 2.
Response and Relapses vs.FDG-PET Results
| IWG Response n (%) |
PET-2 positive n (%) |
Relapsed n (%) |
2-year PFS | |
|---|---|---|---|---|
| CR+CRu | 64 (72.7%) | 11 (17.9%) | 11 (17.2%) | 86% |
| PR | 21 (23.9%) | 11 (52.4%) | 7 (33.3%) | 67% |
| Stable | 3 (3.4%) | 2 (66.7%) | 3 (100.0%) | 0% |
| Total | 88 (100%) | 24 (27.3%) | 21 (23.9%) | 78% |
CR: complete response CRu: complete response-undetermined PR: partial response; PFS progression free survival
In stage IIB patients there was a trend for a higher percentage of PET-2 positive results (Table 1). The sensitivity, specificity, PPV, NPV, % progression, 2-year probability of PFS, hazard ratios (HR) for IHP, Deauville and dCT criteria are displayed in Tables 3, 4 and Figures 1–3. In a subgroup analysis for PET/CT, excluding those who had a PET alone study (n=74), slightly better results were obtained for PPV and specificity (Table 3).
Table 3.
Comparative Results for Different Reading Parameters
| IHP PET-2* [95% CI] |
Deauville PET-2* [95% CI] |
Deauville PET-2§ [95% CI] |
%SPPD change∞ CT after 2 cycles [95% CI] |
|
|---|---|---|---|---|
| Sensitivity |
52.4% [30–74] |
38.1% [18–62] |
41.2% [18–67] |
71.4% [48–89] |
| Specificity |
80.6% [60–89] |
88.1% [78–95] |
89.5% [78.5–96] |
69.7% [57–80] |
| PPV |
45.8% [26–67] |
50.0% [25–75] |
53.8% [25–81] |
42.9% [26–61] |
| NPV |
84.4% [73–92] |
81.9% [71–90] |
83.6% [72–92] |
88.5% [77–95] |
Entire Group: PET alone+PET/CT, n=88,
PET/CT excluding PET alone, n=74,
65% cut-off SPPD: sum of the products of perpendicular diameters of measurable lesions
Table 4.
PET/CT Evaluation with IHP and Deauville Criteria, dCT and Combined Analysis
| Patients % |
Progression* % |
2-year PFS %, [95% CI] |
HR [95% CI] |
|
|---|---|---|---|---|
| PET/CT by IHP | ||||
| PET2− | 75.7 | 14.3 | 89, [78,95] | |
| PET2+ | 24.3 | 50.0 | 50, [26,70] | 4.8 [1.8–12.5] |
| PET/CT by Deauville | ||||
| PET2− | 82.4 | 16.4 | 87, [75,93] | |
| PET2+ | 17.6 | 53.8 | 46, [19,70] | 4.6 [1.7–12.0] |
| %SPPD Δ | ||||
| ≥65% (negative) | 60.3% | 9.1 | 91, [78,96] | |
| <65% (positive) | 39.7 | 44.8 | 62, [42,77] | 4.9 [1.9–12.9] |
| Combined Analysis | ||||
| PET2− / ≥ 65% | 50.7 | 5.4 | 95, [80,99] | |
| PET2− / < 65% | 24.6 | 33.3 | 78, [51,91] | |
| PET2+ / ≥ 65% | 9.6 | 28.6 | 71, [26,92] | |
| PET2+ / < 65% | 15.1 | 63.6 | 36, [11,63] |
dCT-2, post cycle 2 diagnostic CT
overall there were 17 progressions %SPPD Δ, % change in sum of the products of perpendicular diameters of measurable lesions between baseline and post cycle 2 diagnostic CT Data in 73 patients were available for SPPD analysis Data in 74 patients were available for PET/CT analysis
PET/CT analysis was used as the best case scenario for PET imaging to compare with the combined analysis in all patients which included both PET alone and PET/CT.
Figure 1.
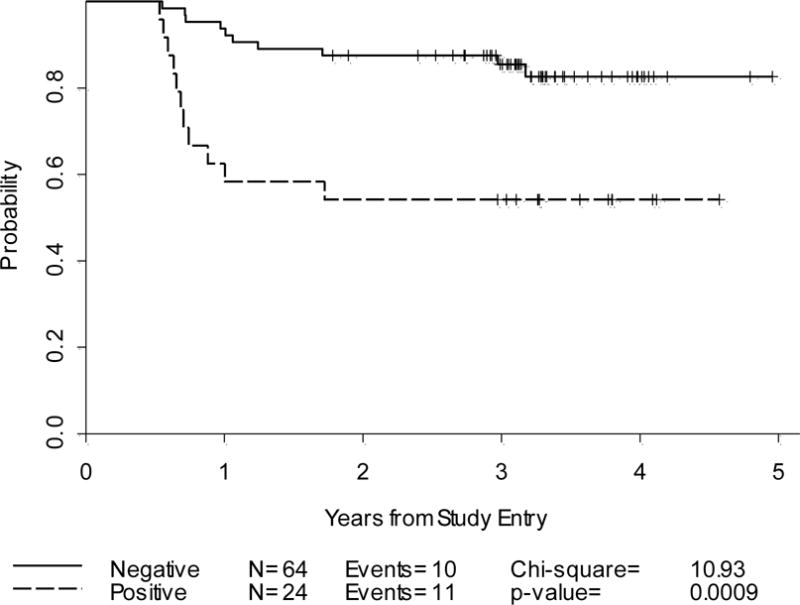
Progression-Free Survival: Cycle-2 PET alone and PET/CT by IHP criteria(n=88)
Figure 3.
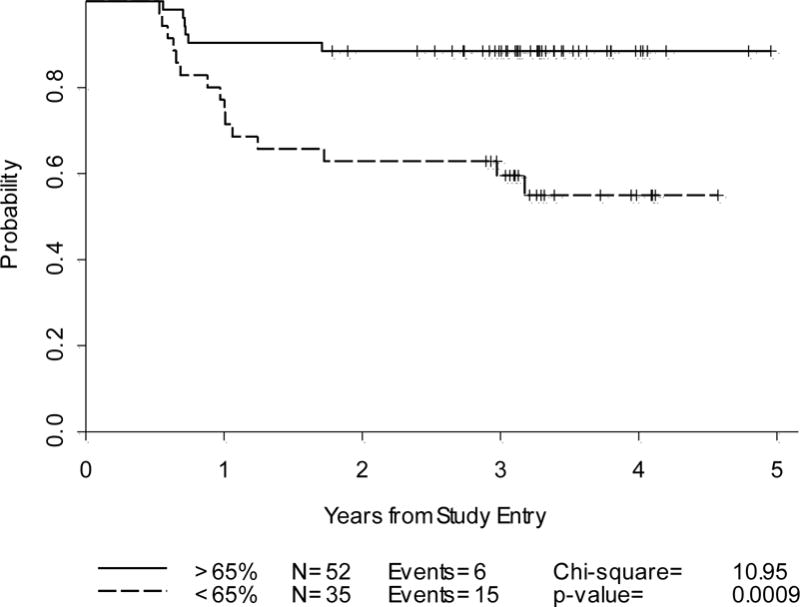
Progression-Free Survival: %SPPD decrease on dCT-2(n=87)
There were significant differences in median SPPD between the PET-2 negative and PET-2 positive groups, both at baseline and post cycle-2 (p=0.015 vs. p=0.002, Wilcoxon Rank Sums test) (Table 1). Although not statistically significant, there was a trend for PET-2 positive patients to have a baseline SPPD greater than the median compared to those who were PET-2 negative (66.7% vs. 43.8%; p=0.09) (Table 1). The majority of the recurrences occurred in those whose tumor SPPD exceeded the median at baseline and at cycle-2 (61.9% and 67.9%, respectively).
Based on the best cut-off determined from ROC analysis, a %SPPD decrease of <65% was used as a positive result on dCT-2 (Tables 3, 4) (Figure 3). PET-2 negative patients had a higher %SPPD decrease at dCT-2 compared to PET-2 positive patients. The median %SPPD decrease in PET-2 negative patients was 70.1 as compared to 64.3 in PET-2 positive patients, p=0.041. Although this difference was only of borderline significance, the finding suggests that patients with greater decline in %SPPD are more likely to have a negative PET scan post cycle 2. The 2-year probabilities in PFS were similar for all analyses including PET/CT negativity after 2 cycles using either IHP or Deauville criteria or SPPD decrease of >65% (Table4). However, a PET/CT positive result after 2 cycles using either IHP or Deauville criteria had a better predictive value than a %SPPD decrease of <65% for predicting 2-year PFS (Table 4). Combined analysis of PET-2 by IHP criteria and %SPPD decrease at dCT-2: In a combined approach, the following categories were analyzed for PET-2 and dCT-2 findings: Both tests are negative; PET-2 is negative and dCT-2 is positive;-PET-2 is positive and dCT-2 is negative;-Both tests are positive.
Discordant results (either test is negative or positive in a different direction)
In the entire population (PET alone+PET/CT), for cases with a PET-2 positive and a dCT-2 negative result (n=10), the 2-year PFS was 70% [CI: 33%–89%]. For those with a PET-2 negative and a positive result dCT-2 (n=21), the corresponding value was 76% [CI: 52%–89%].
Concordant results (both tests are either positive or negative)
In the entire population (PET alone and PET/CT), when both tests were negative (n=42), the 2-year PFS was 93% [CI: 79%–98%). When both tests were positive (n=14), the 2-year PFS was 43% [CI: 18%–66%].
Exclusively in those patients with PET/CT, the above values were slightly better, particularly when both PET-2 and dCT-2 were positive (Table 4).
These results suggest that the best predictive values may be obtained when the results of PET-2 anddCT-2 are in the same direction, (Table 4). More specifically, in patients with concordant negative PET-2 and dCT-2 scans, the 2-year PFS was 95% vs. 78% when dCT-2 was positive for residual disease. Similarly, in patients with concordant positive PET-2 and dCT-2 scans, the 2-year PFS was 71% vs. 36% when dCT-2 was positive (Table 4) (Figure 4). In the PET-2 negative group, there was a trend for higher influence from PET-2 results, with only a 17% decrease in the 2-year PFS when dCT-2 was positive. More impressively, in the PET-2 positive group, a negative dCT-2 increased PFS by 35%, suggesting a higher influence from dCT-2 results (Table 4). Thus, in cases with mixed results, these two tests should be weighed against each other, and greater emphasis be placed on the negative test (PET-2 negative or dCT-2 negative), because of the expected favorable prognosis in early stage HL.
Figure 4.
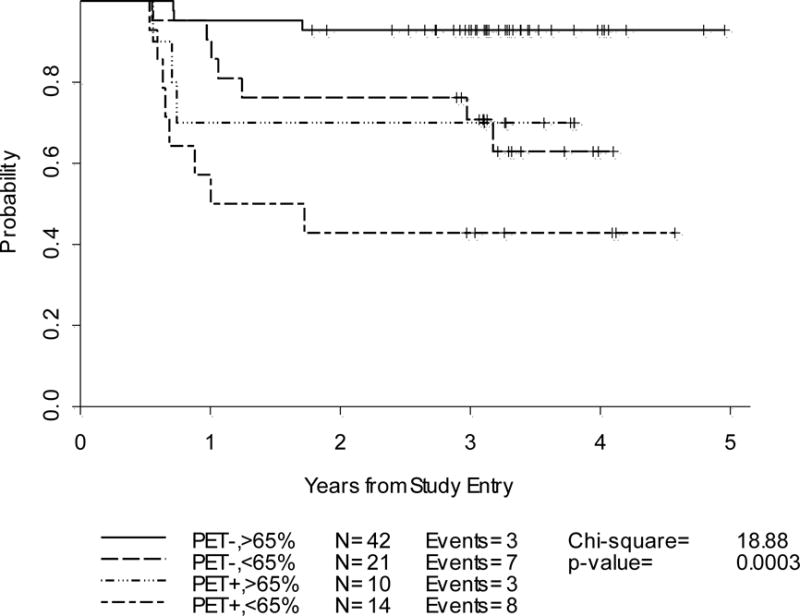
Progression-Free Survival: Cycle-2 by Combined IHP Criteria and %SPPD decrease on dCT-2(n=87)
Note that some of the above confidence intervals are large due to small number of patients in each individual group. The fact that there were only 21 events over 4 different categories for combinatorial analysis implies that these results require confirmation by additional studies.
Discussion
In the current prospective analysis, using the IHP criteria our results compare favorably to earlier published studies in the PET-2 negative group (6, 7, 22), and in the PET-2 positive group they yielded either similar (22) or better results than did previous data (6, 7). Nonetheless, these results should be interpreted in the context of the lack of prior prospective data in large samples limited to early stage disease. Because the predictive value of imaging tests are affected by the efficacy of treatment regimens, an additional consideration should include that in this trial, the AVG regimen and the strategy of no radiation therapy to those who were in an unfavorable risk category, produced an inferior CR rate compared to that of standard ABVD regimen (23) or combined modality treatment in early stage HL patients (77% vs. 94%) (24, 25). PET-2 predicted 2-year PFS with a statistically significant difference between the negative and positive groups using both IHP (88% vs. 54%) and Deauville criteria (85% vs. 50%). Hutchings et al, reported a PPV of approximately 30% for interim PET after 2 or 3 cycles of chemotherapy in a subgroup analysis for early stage HL (6, 7), while the NPV exceeded 95%. In this subgroup, the 2-year PFS in the interim PET negatives. PET-positive patients were 97–100% and 70–80%, respectively, and despite a statistically significant difference, the interim PET-positive group yielded almost a 50% inferior predictive value compared to ours (6, 7). Notably, these results are in stark contrast with those published in advanced stage HL in which almost all interim PET-positive patients relapsed within two years (6–8, 11). The best predictive value for interim PET imaging were reported by Zinzani et al in 147 early stage HL patients (24). Using interpretation criteria that are somewhat similar to IHP criteria, 97.6% of patients with a negative PET-2 result were in CR after a median follow up of 45 months while only 21% of PET-2 positive patients had a continuous CR at a median follow-up of 28 months. The9-yr PFS for PET-2 negative and PET-2 positive patients were 94.7% and 31.3%, respectively. The attributes of these data, mainly, the retrospective design, inclusion of all early-stage patients regardless of tumor bulk, consideration of stage IIB as advanced, involvement of radiotherapy as well as the divergent interpretation criteria might account for the differences between our series and this prior study.
Our PET-2 negative data for NPV (84%) and 2-year PFS (88%) appear inferior to previous early stage HL data (95–100%) (6, 7, 22). Moreover, 27% of our patients had a PET-2 positive result which was approximately 30% higher than expected based on earlier comparable reports (22, 26–30). These findings may, conceivably, be attributed to lower CR rates achieved with AVG therapy (81%) as compared with standard ABVD therapy (94%), the non-use of radiotherapy in this cohort (16, 31) and/or to the differences in patient risk factors. Interestingly, Barnes et al have recently failed to identify a difference in PFS between interim PET positive and negative groups (87% vs. 91%) (22). This particular study contrasts with ours and other prior results (6, 7, 26). However, this study had a number of limitations in that it was retrospective, PET was performed at variable intervals of 2–4 therapy cycles, there was no pre-determined standardized PET timing and the reading scheme was graded on a four-point scale without a priori reference to define a positive finding. Naturally, consistency in interpretation schemes is of pivotal importance to ensure reproducibility and comparability of results across centers (32–34). In the latter study, the four-point reading scheme was probably conducive to a more subjective reading than a reference based continuous scheme for interim chemosensitivity analysis. Sher et al also reported only 15% PPV and 96% NPV for interim PET in 46 HL patients (35). The primary objective of post-therapy predictive value of PET imaging, allowed for variability in the timing of interim PET scans and number of cycles, thus, leading to potential heterogeneity in interim data. This study also differed from ours in its retrospective design, inclusion of advanced stage patients and the use of consolidative radiotherapy (35).
IHP vs. Deauville criteria
On interim PET studies, 10–15% of patients, a variable degree of MRU is detected often at a site of a measurable residual mass. The encouraging results of earlier studies defining a positive PET result with a MRU of greater than the mediastinal blood pool (6–8, 11) supported the integration of posttherapy PET into the revised IWG response criteria (13,18). The higher threshold required of a positive PET reading early during therapy was not taken into consideration. Optimally, PET imaging should be performed approximately two weeks after chemotherapy administration to avoid transient stromal inflammatory host response peaking at days 8–10 of therapy (36), but treatment schedules may not permit such a window. In our study, interim PET was performed 9–14 days after initiation of the second part of AVG therapy. This controlled timing may be partially responsible for slight improvement in PPV compared to earlier published data (6,7,22,35).
In HL, excessive production of cytokines and chemokines by non-neoplastic bystander cells results in an abundance of inflammatory cells outnumbering tumor specific Reed- Sternberg cells that account for only 1% of the total cells (37). The Deauville criteria were adopted to minimize false positive results by employing a higher threshold using liver uptake as the reference and to allow for a relatively continuous reading scheme (14, 15). In our series, Deauville criteria-based readings yielded marginally better PPV (50% vs. 46%) and 2-year PFS in the PET-2 positive group (50% vs. 54%) than the IHP results. In contrast, in a recent risk-adapted study of HL by Le Roux et al, using a multitude of prognostic factors including PET/CT and CT results after four ABVD cycles, the PPV for predicting 2-year PFS was 25% with IHP while Deauville criteria yielded a higher PPV at 45% (p<0.0001) with no negative impact on NPV (38). However, the design of this prior study significantly differs from ours by employing a response-adapted strategy, performing the interim PET after 4 cycles and not being restricted to early stage HL. Despite using identical interpretation criteria; the NPV of a test may be lowered with suboptimal efficacy of the treatment, considering the inferior CR rates obtained by the AVG regimen compared to standard ABVD treatment. Moreover, a significant difference may not be detectable due to small sample size.
Combining PET-2 with dCT-2
Although the inadequacy of CT-based response criteria is well-recognized with the proven superiority of PET/CT as a response surrogate, the incremental value of combining these two modalities is yet to be tested. In our data, the most encouraging predictive result was obtained when PET-2 data were integrated with %SPPD changes from dCT-2. Overall, PET-2 positivity using either IHP or Deauville criteria had an approximately 10% better predictive value than a positive dCT-2 result for predicting 2-year PFS. When both tests were positive, the predictive value for 2-year PFS was improved by as much as 14% compared to results from PET-2 alone. More strikingly, in the PET-2 positive group, the 2-year PFS improved by approximately 30% with the association of a negative dCT-2 result. Early during therapy, the decrease in tumor size is usually not significant, however, in homogeneously chemosensitive tumors, it is conceivable that the size can decrease considerably even after a few cycles. This was shown by Meyers et al who reported a superior freedom from disease progression in patients achieving a CR/Cru (>75% decrease in SPPD) after two cycles of ABVD (5-year survival, 95% vs. 81%, p <007) (3).
As a result of their chaotic exponential growth, measuring tumors by fractal dimensions could better describe irregular tumor morphology and complex biological behavior. Because of their high fractal dimension, tumors have higher buffering capacity than benign masses, hence, the tumor size does not change until a threshold is reached (39, 40). Based on the same principle, during chemotherapy, exponential tumor growth can be abruptly interrupted by several cycles of treatment leading to a collapse in tumor volume due to a substantial fall in the log number of cells given a uniform chemosensitivity (39–41). Consequently, the considerable size decrease and metabolic changes should together be taken into account early during therapy. This combined approach maybe particularly valuable if the persistent FDG uptake is suspected to represent a false positive finding.
Conclusions
Our results confirm that interim PET/CT after two cycles of chemotherapy using either IHP or Deauville criteria has a high NPV in early stage non-bulky HL. The PPV of PET-2, however, remains to be improved to better guide management. The Deauville criteria provided only a marginal improvement in PPV. Our results were suggested that PET-2 positive patients had larger lesions after cycle2. The combined analysis of PET-2 with dCT-2 data suggests an improvement in prediction of PFS compared to each test alone. However, the main limitation is the lack of sufficiently high number of patients in respective categories of matched PET-2 anddCT-2 results. Hence, these results should be viewed as proof of concept which will be prospectively tested in ongoing clinical trials.
Figure 2.
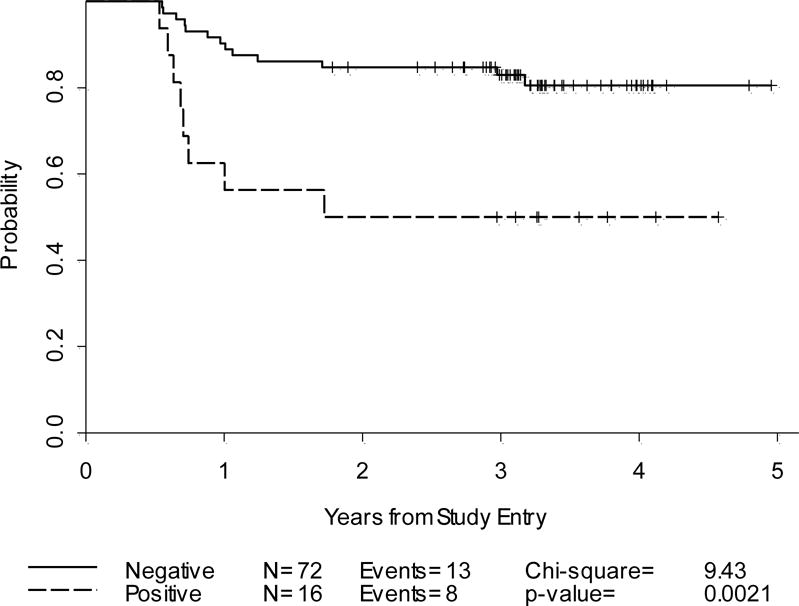
Progression-Free Survival: Cycle-2 PET alone and PET/CT by Deauville criteria(n=88)
Acknowledgments
Supported by CALGB (National Cancer Institute) with partial support by Eli Lilly and Company
The research for CALGB 50203 was supported, in part, by grants from the National Cancer Institute (CA31946) to the Cancer and Leukemia Group B (Monica M. Bertagnolli, MD, Chair) and to the CALGB Statistical Center (Daniel Sargent, PhD). The content of this manuscript is solely the responsibility of the authors and does not necessarily represent the official views of the National Cancer Institute.
Dr. Straus acknowledges partial support of the Lymphoma Foundation, Adam Spector Fund for Hodgkin’s Research and The Ernest & Jeanette Dicker Charitable Foundation
The following institutions participated in this study:
Christiana Care Health Services, Inc. CCOP, Wilmington, DE–Stephen Grubbs, M.D., supported by CA45418Dana-Farber Cancer Institute, Boston, MA–Harold J Burstein, M.D., Ph.D., supported by CA32291Georgetown University Medical Center, Washington, DC–Minetta C Liu, M.D., supported by CA77597Cancer Centers of the Carolinas, Greenville, SC–Jeffrey K. Giguere, M.D, supported by CA29165Hematology-Oncology Associates of Central New York CCOP, Syracuse, NY–Jeffrey Kirshner, M.D., supported by CA45389Kansas City Community Clinical Oncology Program CCOP, Kansas City, MO–Rakesh Gaur, M.D. Massachusetts General Hospital, Boston, MA–Jeffrey W. Clark, M.D., supported by CA32291Memorial Sloan-Kettering Cancer Center, New York, NY–Clifford A. Hudis, M.D., supported by CA77651Northern Indiana Cancer Research Consortium CCOP, South Bend, IN–Rafat Ansari, M.D., supported by CA86726Roswell Park Cancer Institute, Buffalo, NY–Ellis Levine, M.D., supported by CA59518Southeast Cancer Control Consortium Inc. CCOP, Goldsboro, NC–James N. Atkins, M.D., supported by CA45808State University of New York Upstate Medical University, Syracuse, NY–Stephen L. Graziano, M.D., supported by CA21060The Ohio State University Medical Center, Columbus, OH–Clara D Bloomfield, M.D., supported by CA77658University of California at San Francisco, San Francisco, CA–Charles J Ryan, M.D., supported by CA60138University of Chicago, Chicago, IL–Hedy L Kindler, M.D., supported by CA41287University of Iowa, Iowa City, IA–Daniel A. Vaena, M.D., supported by CA47642University of Maryland Greenebaum Cancer Center, Baltimore, MD–Martin Edelman, M.D., supported by CA31983University of Nebraska Medical Center, Omaha, NE–Anne Kessinger, M.D., supported by CA77298University of North Carolina at Chapel Hill, Chapel Hill, NC–Thomas C. Shea, M.D., supported by CA47559University of Vermont, Burlington, VT–Steven M Grunberg, M.D., supported by CA77406Wake Forest University School of Medicine, Winston-Salem, NC–David D Hurd, M.D., supported by CA03927Walter Reed Army Medical Center, Washington, DC–Brendan M Weiss, M.D., supported by CA26806Washington University School of Medicine, St. Louis, MO–Nancy Bartlett, M.D., supported by CA77440Weill Medical College of Cornell University, New York, NY–John Leonard, M.D., supported by CA07968
Footnotes
Presented in part at the American Society of Hematology, 2008
Authorship
L.K designed research, analyzed imaging data, wrote the manuscript; H.S analyzed imaging data, helped write the manuscript; JJ performed statistical analyses; N.C.H reviewed imaging data L.H.S. analyzed imaging data and provided administrative support; E.D.H. performed pathological review of diagnostic material; S-H.J. provided statistical design and analysis; G.P.C. provided patients; B.D.C helped write the manuscript, provided administrative support and provided patients
Disclaimers: None to declare
References
- 1.Armitage JO, Weisenburger DD, Hutchins M, et al. Chemotherapy for diffuse large-cell lymphoma–rapidly responding patients have more durable remissions. J ClinOncol. 1986;4:160–164. doi: 10.1200/JCO.1986.4.2.160. [DOI] [PubMed] [Google Scholar]
- 2.Haw R, Sawka CA, Franssen E, Berinstein HL. Significance of a partial or slow response to front-line chemotherapy in the management of intermediate-grade or high-grade non-Hodgkin’s lymphoma: a literature review. J ClinOncol. 1994;12:1074–1084. doi: 10.1200/JCO.1994.12.5.1074. [DOI] [PubMed] [Google Scholar]
- 3.Meyer RM, Gospodarowicz MK, Connors JM, et al. Randomized comparison of ABVD chemotherapy with a strategy that includes radiation therapy in patients with limited-stage Hodgkin’s lymphoma: National Cancer Institute of Canada Clinical Trials Group and the Eastern Cooperative Oncology Group. J ClinOncol. 2005;23:4634–4642. doi: 10.1200/JCO.2005.09.085. [DOI] [PubMed] [Google Scholar]
- 4.Radford JA, Cowan RA, Flanagan M, et al. The significance of residual mediastinal abnormality on the chest radiograph following treatment for Hodgkin’s disease. J ClinOncol. 1988;6:940–946. doi: 10.1200/JCO.1988.6.6.940. [DOI] [PubMed] [Google Scholar]
- 5.Lewis E, Bernardino ME, Salvador PG, Cabanillas FF, Barnes PA, Thomas JL. Post-therapy CTdetected mass in lymphoma patients: is it viable tissue? J Comput Assist Tomogr. 1982;6:792–795. doi: 10.1097/00004728-198208000-00025. [DOI] [PubMed] [Google Scholar]
- 6.Hutchings M, Mikhaeel NG, Fields PA, et al. Prognostic value of interim FDG-PET after two or three cycles of chemotherapy in Hodgkin lymphoma. Ann Oncol. 2005;16:1160.1168. doi: 10.1093/annonc/mdi200. [DOI] [PubMed] [Google Scholar]
- 7.Hutchings M, Loft A, Hansen M, et al. FDG-PET after two cycles of chemotherapy predicts treatment failure and progression-free survival in Hodgkin lymphoma. Blood. 2006;107:52.59. doi: 10.1182/blood-2005-06-2252. [DOI] [PubMed] [Google Scholar]
- 8.Gallamini A, Rigacci L, Merli F, et al. The predictive value of positron emission tomography scanning performed after two courses of standard therapy on treatment outcome in advanced stage Hodgkin’s disease. Haematologica. 2006;91:475.481. [PubMed] [Google Scholar]
- 9.Kostakoglu L, Goldsmith SJ, Leonard JP, et al. FDG-PET after 1 cycle of therapy predicts outcome in diffuse large cell lymphoma and classic Hodgkin disease. Cancer. 2006;107:2678.2687. doi: 10.1002/cncr.22276. [DOI] [PubMed] [Google Scholar]
- 10.Zinzani PL, Tani M, Fanti S, et al. Early positron emission tomography (PET) restaging: a predictive final response in Hodgkin’s disease patients. Ann Oncol. 2006;17:1296–1300. doi: 10.1093/annonc/mdl122. [DOI] [PubMed] [Google Scholar]
- 11.Gallamini A, Hutchings M, Rigacci L, et al. Early interim 2-[18F]fluoro-2-deoxy-D-glucose positron emission tomography is prognostically superior to international prognostic score in advanced-stage Hodgkin’s lymphoma: a report from a joint Italian-Danish study. J ClinOncol. 2007;25:3746–52. doi: 10.1200/JCO.2007.11.6525. [DOI] [PubMed] [Google Scholar]
- 12.Terasawa T, Lau J, Bardet S, et al. Fluorine-18-fluorodeoxyglucose positron emission tomography for interim response assessment of advanced-stage Hodgkin’s lymphoma and diffuse large B-cell lymphoma: a systematic review. J ClinOncol. 2009;27:1906–14. doi: 10.1200/JCO.2008.16.0861. [DOI] [PubMed] [Google Scholar]
- 13.Cheson BD, Pfistner B, Juweid ME, et al. Revised response criteria for malignant lymphoma. J Clin Oncol. 2007;25:579–586. doi: 10.1200/JCO.2006.09.2403. [DOI] [PubMed] [Google Scholar]
- 14.Meignan M, Gallamini A, Haioun C. Report on the First International Workshop on Interim-PETScan in Lymphoma. Leuk Lymphoma. 2009;50:1257.1260. doi: 10.1080/10428190903040048. [DOI] [PubMed] [Google Scholar]
- 15.Barrington SF, Qian W, Somer E, et al. Concordance between four European centres of PET reporting criteria designed for use in multicentre trials in Hodgkin lymphoma. Eur J Nucl Med Mol Imaging. 2010;37:1824.1833. doi: 10.1007/s00259-010-1490-5. [DOI] [PubMed] [Google Scholar]
- 16.Straus DJ, Johnson JL, Lacasce AS, et al. Doxorubicin, vinblastine, gemcitabine (CALGB 50203) for stage I/II non-bulky Hodgkin lymphoma: pretreatment prognostic factors and interim PET. Blood. 2011;117:5314–5320. doi: 10.1182/blood-2010-10-314260. [DOI] [PMC free article] [PubMed] [Google Scholar]
- 17.Cheson BD, Horning SJ, Coiffier B, et al. Report of an international workshop to standardize response criteria for non-Hodgkin’s lymphomas. NCI Sponsored International Working Group. J Clin Oncol. 1999;17:1244. doi: 10.1200/JCO.1999.17.4.1244. [DOI] [PubMed] [Google Scholar]
- 18.Juweid ME, Wiseman GA, Vose JM, Ritchie JM, Menda Y, Wooldridge JE. Response assessment of aggressive non-Hodgkin’s lymphoma by Integrated International Workshop Criteria and fluorine-18-fluorodeoxyglucose positron emission tomography. J ClinOncol. 2005;23:4652–4661. doi: 10.1200/JCO.2005.01.891. [DOI] [PubMed] [Google Scholar]
- 19.El K, Meier P. Nonparametric estimation from incomplete observations. J Am Stat Assoc. 1958;53:457–481. [Google Scholar]
- 20.Peto R, Peto J. Asymptotically efficient rank invariant test procedures. Journal of the Royal Statistical Society. Series A (General) 1972;135:185–207. [Google Scholar]
- 21.McNemar Q. Note on the sampling error of the difference between correlated proportions or percentages. Psychometrika. 1947;12:153–157. doi: 10.1007/BF02295996. [DOI] [PubMed] [Google Scholar]
- 22.Barnes JA, Lacasce AS, Zukotynski K, et al. End-of-treatment but not interim PET scan predicts outcome in nonbulky limited-stage Hodgkin’s lymphoma. Ann Oncol. 2011;22:910–915. doi: 10.1093/annonc/mdq549. [DOI] [PubMed] [Google Scholar]
- 23.Canellos GP, Abramson JS, Fisher DC, LaCasce AS. Treatment of favorable, limited-stage Hodgkin’s lymphoma with chemotherapy without consolidation by radiation therapy. J Clin Oncol. 2010;28:1611–1615. doi: 10.1200/JCO.2009.25.3260. [DOI] [PubMed] [Google Scholar]
- 24.Eich HT, Diehl V, Gorgen H, et al. Intensified chemotherapy and dose-reduced involved-field radiotherapy in patients with early unfavorable Hodgkin’s lymphoma: final analysis of the German Hodgkin Study Group HD11 Trial. J Clin Oncol. 2010;28:4199–4206. doi: 10.1200/JCO.2010.29.8018. [DOI] [PubMed] [Google Scholar]
- 25.Engert A, Plutschow A, Eich HT, et al. Reduced treatment intensity in patients with early-stage Hodgkin’s lymphoma. N Engl J Med. 2010;363:640–652. doi: 10.1056/NEJMoa1000067. [DOI] [PubMed] [Google Scholar]
- 26.Zinzani PL, Rigacci L, Stefoni V, et al. Early interim (18)F-FDG PET in Hodgkin’s lymphoma: evaluation on 304 patients. Eur J Nucl Med Mol Imaging. 2012;39:4–12. doi: 10.1007/s00259-011-1916-8. [DOI] [PubMed] [Google Scholar]
- 27.Marc APE, Reman O, Federico M, et al. First Report On the H10 EORTC/GELA/IIL Randomized Intergroup Trial On Early FDG-PET Scan Guided Treatment Adaptation Versus Standard Combined Modality Treatment in Patients with Supra-Diaphragmatic Stage I/II Hodgkin’s Lymphoma, for the Grouped’Etude Des Lymphomes De l’Adulte (GELA), European Organisation for the Research and Treatment of Cancer (EORTC) Lymphoma Group and the IntergruppoItaliano Linfomi (IIL) Blood (ASH Annual Meeting Abstracts) 2009;114 Abstract 97. [Google Scholar]
- 28.Fitoussi O, Brice P, Hirt S, et al. EARLY Interim FDG-PET Scan in Localised Hodgkin Lymphoma: Evaluation of Practice in 5 French Centers. Blood (ASH Annual Meeting Abstracts) 2008;112 Abstract 4935. [Google Scholar]
- 29.Stefoni V, Broccoli A, Alinari L, et al. Predictive role of Early Interim FDG-PET in Hodgkin Lymphoma. Blood (ASH Annual Meeting Abstracts) 2009 Nov;114:1659. [Google Scholar]
- 30.Radford J, O’Doherty M, Barrington S, et al. Results of the 2nd Planned Interim Analysis of the RAPID Trial (involved field radiotherapy versus no further treatment) in Patients with Clinical Stages 1A and 2A Hodgkin Lymphoma and negative FDG-PET Scan after 3 Cycles ABVD. Blood (ASH Annual Meeting Abstracts) 2008;112 Abstract 369. [Google Scholar]
- 31.Straus DJ, Portlock CS, Qin J, et al. Results of a prospective randomized clinical trial of doxorubicin, bleomycin, vinblastine, and dacarbazine (ABVD) followed by radiation therapy (RT) versus ABVD alone for stages I, II, and IIIA nonbulky Hodgkin disease. Blood. 2004;104:3483–3489. doi: 10.1182/blood-2004-04-1311. [DOI] [PubMed] [Google Scholar]
- 32.Zijlstra JM, Comans EF, van Lingen A, Hoekstra OS, Gundy CM, Coebergh WJ, et al. FDG PET in lymphoma: the need for standardization of interpretation. An observer variation study. Nucl Med Commun. 2007;28:798.803. doi: 10.1097/MNM.0b013e3282eff2d5. [DOI] [PubMed] [Google Scholar]
- 33.Andre M, Vander Borght T, Bosly A. Interim FDG-PET Scan in Hodgkin’s Lymphoma: Hopes and Caveats. AdvHematol. 2011;2011:430679. doi: 10.1155/2011/430679. [DOI] [PMC free article] [PubMed] [Google Scholar]
- 34.Hutchings M, Barrington SF. PET/CT for therapy response assessment in lymphoma. J Nucl Med. 2009;50:21S.30S. doi: 10.2967/jnumed.108.057190. [DOI] [PubMed] [Google Scholar]
- 35.Sher DJ, Mauch PM, Van Den Abbeele A, et al. Prognostic significance of mid- and post-ABVD PET imaging in Hodgkin’s lymphoma: the importance of involved-field radiotherapy. Ann Oncol. 2009;20:1848.1853. doi: 10.1093/annonc/mdp071. [DOI] [PubMed] [Google Scholar]
- 36.Spaepen K, Stroobants S, Dupont P, et al. [(18)F]FDG PET monitoring of tumour response to chemotherapy: does [(18)F]FDG uptake correlate with the viable tumour cell fraction? Eur J Nucl Med Mol Imaging. 2003;30:682–688. doi: 10.1007/s00259-003-1120-6. [DOI] [PubMed] [Google Scholar]
- 37.Steidl C, Lee T, Shah SP, Farinha P, et al. Tumor-associated macrophages and survival in classic Hodgkin’s lymphoma. N Engl J Med. 2010;362:875–885. doi: 10.1056/NEJMoa0905680. [DOI] [PMC free article] [PubMed] [Google Scholar]
- 38.Le Roux PY, Gastinne T, Le Gouill S, et al. Prognostic value of interim FDG PET/CT in Hodgkin’s lymphoma patients treated with interim response-adapted strategy: comparison of International Harmonization Project (IHP), Gallamini and London criteria. Eur J Nucl Med Mol Imaging. 2011;38:1064–1071. doi: 10.1007/s00259-011-1741-0. [DOI] [PubMed] [Google Scholar]
- 39.Norton LA. Gompertzian model of human breast cancer growth. Cancer Res. 1988;48:7067.7071. [PubMed] [Google Scholar]
- 40.Norton L, Simon R. The Norton-Simon hypothesis revisited. Cancer Treat Rep. 1986;70:163.169. [PubMed] [Google Scholar]
- 41.Baish JW, Jain R. Fractals and Cancer. Cancer Res. 2000;60:3683–3688. [PubMed] [Google Scholar]