

Summary
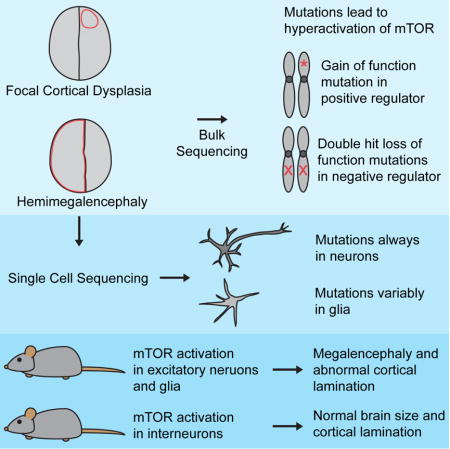
Focal cortical dysplasia (FCD) and hemimegalencephaly (HME) are epileptogenic neurodevelopmental malformations caused by mutations in mTOR pathway genes. Deep sequencing of these genes in FCD/HME brain tissue identified an etiology in 27/66 cases (41%). Radiographically indistinguishable lesions are caused by somatic activating mutations in AKT3, MTOR, and PIK3CA, and germline loss-of-function mutations in DEPDC5, NPRL2, and TSC1/2, including TSC2 mutations in isolated HME demonstrating a “two-hit” model. Mutations in the same gene cause a disease continuum from FCD to HME to bilateral brain overgrowth, reflecting the progenitor cell and developmental time when the mutation occurred. Single cell sequencing demonstrated mTOR activation in neurons in all lesions. Conditional PIK3CA activation in mouse cortex showed that mTOR activation in excitatory neurons and glia, but not interneurons, is sufficient for abnormal cortical overgrowth. These data suggest mTOR activation in dorsal telencephalic progenitors, in some cases specifically the excitatory neuron lineage, causes cortical dysplasia.
Keywords: next generation sequencing, DNA sequencing, single cell sequencing, human genetics, epilepsy, cortical development, brain malformations, somatic mutations, mTOR pathway, excitatory neurons
Graphical abstract
Introduction
Focal malformations of cortical development (MCDs), including FCD and HME, are caused by somatic activation of the mTOR pathway and represent the most important causes of surgically treated intractable childhood epilepsy (Blumcke et al., 2017; Harvey et al., 2008). FCDs, classified into several subtypes by the International League Against Epilepsy (Blumcke et al., 2011), involve small regions of radiographically and histopathologically abnormal cortex, whereas HME shows abnormal enlargement of much or all of a cerebral hemisphere (Blumcke et al., 2011; Poduri et al., 2012). Patients present with seizures that can be refractory to medical management (Kwan et al., 2010) and often require surgical resection of the abnormal brain tissue for seizure control (Aronica and Crino, 2014), allowing direct study of that tissue.
While it has long been recognized that tuberous sclerosis complex (TSC), a multisystem disorder caused by loss-of-function mutations in TSC1 or TSC2, is associated with abnormal activation of the mTOR pathway (Lipton and Sahin, 2014), recent work has identified somatic activating mutations in MTOR itself, and genes encoding positive regulators of MTOR, in both FCD and HME (Jansen et al., 2015; Lee et al., 2012; Lim et al., 2015; Poduri et al., 2012). Several new genes have also been described that act analogously to TSC1 and TSC2 as negative regulators of MTOR, causing FCD and HME via germline loss-of-function mutation coupled to demonstrated or inferred somatic loss of the second allele (Baulac et al., 2015; D’Gama et al., 2015; Lim et al., 2017; Scheffer et al., 2014; Sim et al., 2016; Weckhuysen et al., 2016). Surprisingly, TSC mutations can cause isolated FCD or HME in the absence of widespread hamartomas (D’Gama et al., 2015; Hoelz et al., 2017; Lim et al., 2017).
Several crucial questions remain about cortical dysplasia pathogenesis, including the cell type in which mTOR pathway activation leads to dysplasia and epilepsy and whether the distinct topographic distributions of FCD and HME correspond to somatic mutations in different neuronal or glial subtypes. For example, the focal distribution of FCD mirrors the relative clustering of excitatory neuronal clones (Gao et al., 2014), whereas the hemispheric dispersion of mutant cells in HME mirrors the clonal distribution of interneurons, suggesting that these two lesions might reflect mutations in excitatory or inhibitory neuronal lineages, respectively.
Here, we identify causative mutations in AKT1, AKT3, DEPDC5, MTOR, NPRL2, PIK3CA, PIK3R2, TSC1, and TSC2 in 18 FCD, HME and polymicrogyria (PMG) cases, including isolated HME cases with “two-hit” germline and somatic TSC2 mutations. Single cell analyses of mutation-positive cases demonstrate that abnormal activation of the mTOR pathway in neurons is necessary and sufficient to cause epileptogenic MCDs. Mouse models show that abnormal activation of the mTOR pathway in the Emx-1 expressing lineage, which gives rise to excitatory neurons and some glia, is sufficient to cause abnormal cortical lamination and overgrowth, whereas such activation in inhibitory interneurons causes only subtle defects in cortical interneuron number. Overall, we show that FCD and HME are part of a spectrum of disease caused by mutations that activate the mTOR pathway in dorsal telencephalic progenitors that give rise to excitatory neurons and in some cases glia.
Results
Targeted ultra-deep sequencing identifies mutations in focal MCDs
We performed targeted ultra-deep sequencing on DNA extracted from surgically resected brain, blood, and/or buccal samples from 52 FCD, 38 HME, and 5 polymicrogyria cases (Figure S1). They included patients studied previously (D’Gama et al., 2015; Poduri et al., 2012) in whom no pathogenic variant was identified and new samples. DNA was sequenced using two custom panels targeting 12 mTOR pathway genes: AKT1, AKT3, CCND2, DEPDC5, MTOR, PIK3CA, PIK3R2, PTEN, TSC1, and TSC2 in both panels and NPRL2 and NPRL3 only in Panel 2, which achieved coverage >5000X. We performed several analyses to identify high quality, rare, and protein-altering variants and validated all variants using Sanger sequencing, ddPCR, and/or subcloning (Experimental Procedures and Supplemental Experimental Procedures). Variants were considered pathogenic if they were loss-of-function variants, predicted deleterious missense variants proven pathogenic by functional studies, and/or variants previously identified in FCD, HME or related syndromes. In total, we identified and validated 19 pathogenic variants in AKT1, AKT3, DEPDC5, MTOR, NPRL2, PIK3CA, PIK3R2, TSC1 and TSC2 in 18 patients (Table 1, Figure 1, and Tables S1–4).
Table 1.
Pathogenic mutations and likely pathogenic variant detected in the mTOR pathway in patients with FCD, HME, and PMG with megalencephaly.
| Subject | Diagnosis | Gene | Mutation | HGVS | Type | AAF | Comments |
|---|---|---|---|---|---|---|---|
| HME-19 | HME, Proteus | AKT1 | Ms | p.E17K | Somatic | 8.1–9.3% Brain | Previously identified in Proteus syndrome (Lindhurst et al., 2011) |
| HME-12 | HME | AKT3 | Ms | p.E17K | Somatic (Not in blood) | 3.4–4.4% Brain, 0% Blood | Previously identified in HME (Jansen et al., 2015; Lee et al., 2012; Poduri et al., 2012) |
| FCD-11 | FCD IIa | DEPDC5 | Ns | p.R874* | Germline | 47.7% Brain, 52.4% Blood | Loss of function, previously identified in focal epilepsy (Lal et al., 2014) |
| FCD-6 | FCD IIb | MTOR | Ms | p.L1460P | Somatic | 2.3–2.6% Brain | Previously identified in FCD (Mirzaa et al., 2016; Moller et al., 2016; Nakashima et al., 2015), Functional studies suggest pathogenic (Grabiner et al., 2014) |
| FCD-7 | FCD | MTOR | Ms | p.S2215Y | Somatic | 2.5–2.8% Brain | Previously identified in FCD (Moller et al., 2016; Nakashima et al., 2015), Functional studies suggest pathogenic (Grabiner et al., 2014) |
| FCD-14 | FCD | MTOR | Ms | p.T1977R | Somatic | 2.8–4.7% Brain, 0% Blood | Functional studies suggest pathogenic (Grabiner et al., 2014) |
| HME-13 | HME | MTOR | Ms | p.S2215Y | Somatic | 7.1–8.3% Brain | Previously identified in FCD (Moller et al., 2016; Nakashima et al., 2015), Functional studies suggest pathogenic (Grabiner et al., 2014) |
| HME-9 | HME | MTOR | Ms | p.T1977K | Somatic (Not in blood) | 9.0–10.4% Brain, 0% Blood | Previously identified in FCD (Lim et al., 2015), Functional studies suggest pathogenic (Grabiner et al., 2014) |
| FCD-8 | FCD IIb | MTOR | Ms | p.C1483R | Somatic | 10.0–10.6% Brain | Previously identified in FCD (Lim et al., 2015), Functional studies suggest pathogenic (Grabiner et al., 2014) |
| HME-14 | HME | MTOR | Ms | p.S2215F | Somatic (Not in blood) | 18.3–20.6% Brain, 0% Blood | Previously identified in FCD (Lim et al., 2015; Mirzaa et al., 2016; Moller et al., 2016; Nakashima et al., 2015), Functional studies suggest pathogenic (Grabiner et al., 2014) |
| PMG-1 | PMG, macrocephaly | MTOR | Ms | p.C1483Y | De novo Germline | 49.5% Blood | Previously identified in HME (Lee et al., 2012), Functional studies suggest pathogenic (Grabiner et al., 2014) |
| FCD-13 | FCD IIa | NPRL2 | Ns | p.Q188* | Germline | 31.7–50.9% Brain, 32.1–51.1% Blood | Loss of function |
| HME-22 | HME | PIK3CA | Ms | p.E542K | Somatic (Not in blood) | 15.9–17.4% Brain, 0% Blood | Previously identified in CLOVES (Kurek et al., 2012) and HME (D’Gama et al., 2015; Jansen et al., 2015) |
| PMG-2 | PMG, macrocephaly | PIK3R2 | Ms | p.K376E | Germline | 50% Blood | Previously identified in BPP (Mirzaa et al., 2015) |
| FCD-12 | FCD IIb | TSC1 | Ns | p.Q55* | Somatic | 5.1–6.7% Brain | Previously identified in TSC (LOVD) |
| FCD-10 | FCD | TSC2 | Ns | p.R751* | Somatic (Not in blood) | 1.0% Brain, 0% Blood | Loss of function, Previously identified in TSC (Jones et al., 1999) |
| HME-11 | HME | TSC2 | Fs | p.Y587* | Somatic (Not in blood) | 3.1–3.8% Brain, 0.0% Blood | Loss of function, AA change previously identified in TSC (LOVD) |
| HME-15 | HME | TSC2 | Ms | p.E1558K | Somatic | 7.5–11.6% Brain | Previously identified in TSC (Dabora et al., 2001) |
| HME-15 | HME | TSC2 | Ms | p.L631P | Germline | 47.4% Brain | Likely pathogenic, predicted deleterious |
AAF: alternate allele frequency, BPP: bilateral perisylvian polymicrogyria, CLOVES: Congenital Lipomatous Overgrowth, Vascular Malformations, Epidermal Nevis, Spinal/Skeletal Anomalies/Scoliosis, FCD: focal cortical dysplasia, Fs: frameshift, HGVS: Human Genome Variation Society, HME: hemimegalencephaly, LOVD: Leiden Open Variation Database, Ms: missense, Ns: nonsense, PMG: polymicrogyria, TSC: tuberous sclerosis complex. See also Figure S1, Table S1, and Table S2.
Figure 1. Somatic mutations leading to abnormal activation of the mTOR pathway are identified across a spectrum of somatic cortical dysplasias and a continuum of alternate allele frequencies.
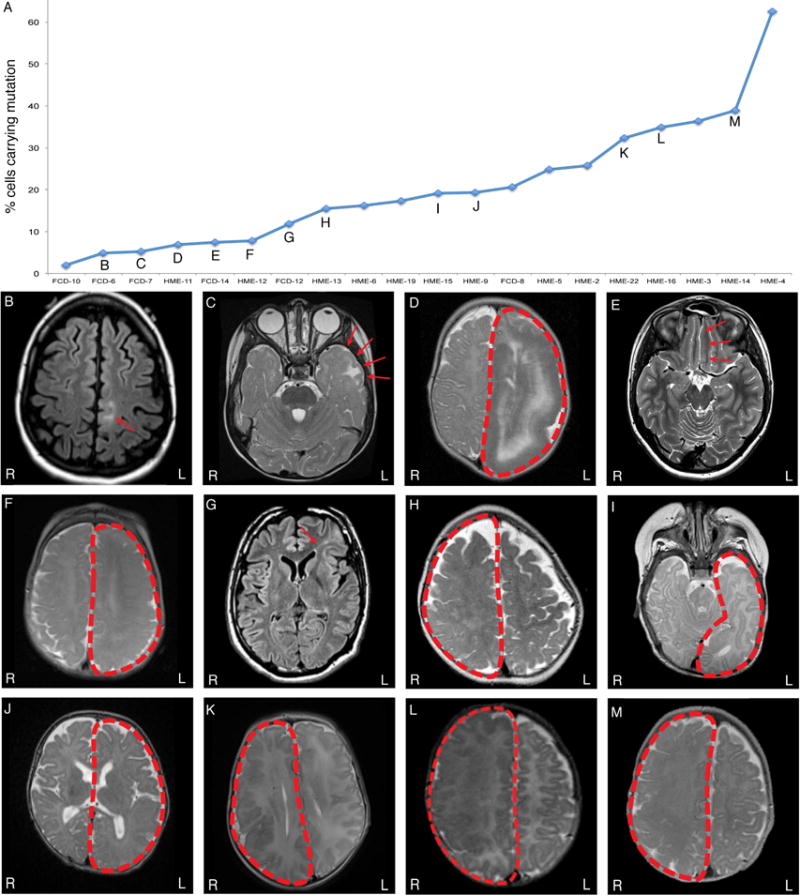
(A) Somatic mutations identified in FCD and HME cases in this study and our previous studies (D’Gama et al., 2015; Poduri et al., 2012) are graphed according to the percentage of cells carrying the somatic mutation. (B-M) Magnetic resonance imaging (MRI) of mutation positive cases: FCD-6 (B), FCD-7 (C), HME-11 (D), FCD-14 (E), HME-12 (F), FCD-12 (G), HME-13 (H), HME-15 (I), HME-9 (J), HME-22 (K), HME-16 (L), and HME-14 (M). Although lesions with the lowest mosaicism are all FCD, and those with the highest are all HME, there is substantial overlap, suggesting that they form a continuum in terms of mosaicism. FCD: focal cortical dysplasia; HME: hemimegalencephaly.
Pathogenic variants identified in FCD
In four patients with FCD, we identified loss-of-function mutations in negative regulators of the mTOR pathway: DEPDC5, NPRL2, TSC1, and TSC2. Patient FCD-11, with a right frontotemporal FCD IIa, harbors DEPDC5 variant p.R874*, previously identified in focal epilepsy (Lal et al., 2014). Patient FCD-13, with a left superior frontal gyrus FCD IIa, has NPRL2 variant p.Q188*. Patient FCD-10, with a left frontal FCD, has the somatic nonsense TSC2 variant p.R751*, previously identified in TSC (Jones et al., 1999) and detected in brain but not blood. We were unable to obtain additional medical records to ascertain whether this patient has additional TSC features. Patient FCD-12, with a left frontal FCD IIb (Figure 1G) and no other TSC features, harbors the somatic nonsense TSC1 variant p.Q55*, previously identified in TSC (Leiden Open Variation Database [LOVD]). We did not identify germline mutations in TSC1 or TSC2 in either of these cases, further suggesting that both patients had isolated FCD and not syndromic TSC. Somatic TSC mutation without detectable germline mutation has recently been reported in FCD (Lim et al., 2017).
In an additional four patients with FCD, we identified somatic missense mutations in MTOR that were recently reported in FCD (Lim et al., 2015; Nakashima et al., 2015) and/or shown to activate mTOR (Grabiner et al., 2014): patient FCD-6, with a left frontoparietal FCD IIb (Figure 1B), has MTOR variant p.L1460P; patient FCD-7, with a left temporal FCD (Figure 1C), has MTOR variant p.S2215Y; patient FCD-8, with a left hemisphere FCD IIb, has MTOR variant p.C1483R; and patient FCD-14, with a left hemisphere FCD (Figure 1E), has MTOR variant p.T1977R detected in brain but not blood. Overall, the percentage of cells carrying the pathogenic mutations ranged from 4.6–20.6% for the six patients with FCD and identified somatic mutations (Figure 1A).
Pathogenic variants identified in HME
In eight patients with HME, we identified mutations in AKT1, AKT3, MTOR, PIK3CA, and TSC2. Patient HME-19, with left HME and systemic physical findings consistent with Proteus syndrome, has the somatic AKT1 variant p.E17K, previously identified in Proteus syndrome (Lindhurst et al., 2011). Patient HME-12, with left HME (Figure 1F), has the paralogous somatic AKT3 variant p.E17K, detected in brain but not blood, which was initially identified in another HME patient by our lab (Poduri et al., 2012).
Three patients harbor somatic missense mutations in MTOR that were recently reported in FCD (Lim et al., 2015; Nakashima et al., 2015) but to our knowledge have not been reported in HME: Patient HME-13, with right HME (Figure 1H), has MTOR variant p.S2215Y; patient HME-9, with left HME (Figure 1J), has MTOR variant p.T1977K, detected in brain but not blood; and patient HME-14, with right HME (Figure 1M), has MTOR variant p.S2215F, also detected in brain but not blood. In addition, patient HME-22, with right HME (Figure 1K), has somatic PIK3CA variant p.E542K, detected in brain but not blood, which was initially identified in HME in another HME patient by our lab (D’Gama et al., 2015).
“Two-hit” TSC2 variants identified in isolated HME
In two patients with isolated HME, we detected “two-hit” germline plus somatic mutations in TSC2. Patient HME-15, who presented with infantile spasms and left HME (Figure 1I), has a predicted deleterious germline missense variant in TSC2, p.L631P, and a somatic missense variant in TSC2, p.E1558K, which was previously identified in TSC (Dabora et al., 2001). Patient HME-11, who presented with hypomotor, tonic, and clonic seizures and left HME (Figure 1D), has a germline missense variant in TSC2, p.R1713H, which we identified in our previous study (D’Gama et al., 2015) and was also previously identified in TSC (Hirfanoglu and Gupta, 2010; Hoogeveen-Westerveld et al., 2011), as well as a somatic frameshift variant in TSC2, p.Y587*, detected in brain but not blood; the same mutation has been previously identified in TSC (LOVD). While we acknowledge the age-dependence of syndromic TSC manifestations, based on available records and specialized pediatric neurology examinations, both patients lacked any signs of syndromic TSC, and brain MRIs did not show other TSC hallmarks. These findings are remarkable since TSC mutations have not previously been associated with isolated HME, and since capturing both germline and somatic mutations in TSC-associated cortical dysplasia is uncommon (Lim et al., 2017). The percentage of cells carrying the pathogenic mutations ranged from 6.2–41.2% for the eight patients with HME and identified somatic mutations (Figure 1A).
Overall Yield
Our current and previous studies (D’Gama et al., 2015; Poduri et al., 2012) have identified pathogenic mutations in 41% (27/66) of the focal MCD cases for whom brain tissue was available (10/38 FCD, 26%, and 17/28 HME, 61%) and none (0/33) of the cases for whom brain tissue was not available (Figure 2 and Table S4). In all cases for whom both brain and non-brain samples were available (2 FCD and 7 HME cases), pathogenic somatic mutations were identified only in brain. This suggests that most pathogenic mutations in FCD and HME arise relatively late during embryonic development and are likely “brain only,” and that testing of blood DNA is generally not useful diagnostically.
Figure 2. Mammalian target of rapamycin (mTOR) pathway and identified pathogenic mutations.
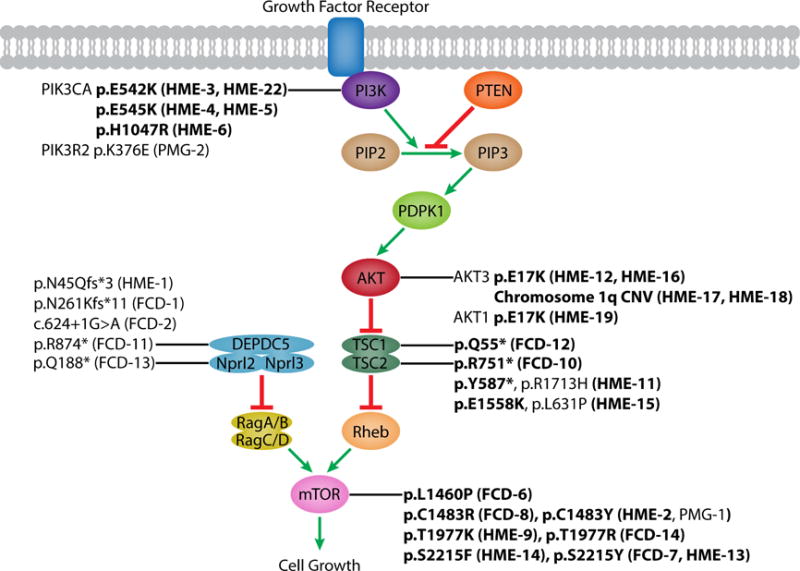
Schematic of the mTOR pathway annotated with pathogenic mutations identified by our lab (this study and our previous studies (D’Gama et al., 2015; Poduri et al., 2012)). Somatic mutations are in boldface. FCD: focal cortical dysplasia; HME: hemimegalencephaly, PMG: polymicrogyria. See also Table S3 and S4.
Pathogenic variants identified in PMG with Megalencephaly (PMG-M)
We identified a de novo germline missense variant in MTOR, p.C1483Y, in patient PMG-1, with bilateral perisylvian PMG, megalencephaly, multiple congenital anomalies, and death at age 2 years due to respiratory failure; this variant was previously reported in the somatic state in an HME case (Lee et al., 2012). A germline mutation of the same amino acid, p.C1483F, has previously been reported in a patient with megalencephaly and intractable epilepsy who died at 19 months due to respiratory failure (Kingsmore et al., 2013). We also identified a germline missense variant in PIK3R2, p.K376E, in patient PMG-2, with bilateral perisylvian PMG with megalencephaly; this variant was recently identified in a case with bilateral perisylvian PMG (Mirzaa et al., 2015).
Pathogenic somatic mutations are present in the neuronal lineage
To define the minimal cell types in cortical dysplasias, we sorted single nuclei from seven genetically characterized cases using an antibody against NeuN, performed whole genome amplification using multiple displacement amplification, and genotyped the mutations as previously described (Evrony et al., 2012) (Experimental Procedures, Figure 3, Table S5). In two FCD and two HME cases, the identified somatic mutations were strongly enriched in neuronal compared to non-neuronal cells, including both cases with the smallest lesion and smallest proportion of cells carrying the mutation. Patient FCD-6 carries MTOR variant p.L1460P in 4.6–5.2% of cells based on NGS, with 7.1 ± 1.8% of NeuN+ cells and 0.53 ± 0.53% of NeuN- cells carrying the mutation (p<0.001, two-tailed Fisher’s exact test). Patient FCD-14 carries MTOR variant p.T1977R in 5.6–9.4% of cells based on NGS, with 24 ± 4.2% of NeuN+ cells and 0% of NeuN- cells carrying the mutation (p<0.0001). Patient HME-16 (HMG-3 from (Poduri et al., 2012)) carries AKT3 mutation p.E17K in ≈35% of cells based on subcloning, with 60 ± 5.2% of NeuN+ cells and 26.8 ± 4.9% of NeuN- cells carrying the mutation (p<0.0001). Patient HME 23 carries PIK3CA variant p.E545K (independently identified) in 47% of cells based on ddPCR, with 77 ± 4.5% of NeuN+ cells and 24.4 ± 6.4% of NeuN- cells carrying the mutation (p<0.00000001). These results suggest that somatic mutations involving the smallest numbers of cells are strongly enriched in neuronal compared to glial cells during development. Larger FCD lesions showed mutations in neuronal and non-neuronal cells (p>0.05), and one HME case showed modest enrichment in NeuN- compared to NeuN+ cells (p<0.0001). These data suggest that somatic mutations associated with FCD and HME can occur in progenitors that generate both neuronal and non-neuronal cells, but in some cases occur in neuron-specific progenitors. In all cases, the mutation is present in >5% of neuronal cells, suggesting that activation of the mTOR pathway in the neuronal lineage is obligatory for the abnormal cortical development underlying FCD and HME. However, these data do not identify whether mTOR activity in excitatory or inhibitory neurons is essential for dysplasia formation.
Figure 3. Pathogenic somatic mutations in FCD and HME are always present in the neuronal lineage.
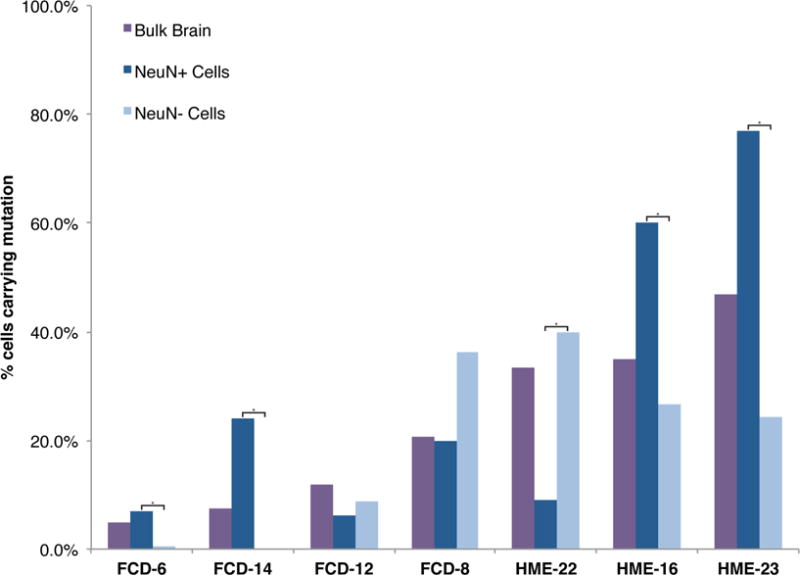
Single neuronal and non-neuronal nuclei from Patients FCD-6, FCD-8, FCD-12, FCD-14, HME-16, HME-22, and HME-23 were isolated using an antibody against NeuN, DNA was amplified, and genotyping was performed for the respective pathogenic mutations. The sequencing traces were analyzed to calculate the number of cells with the mutation, taking into account allelic dropout, as described previously (Evrony et al., 2012). P values were calculated from cell counts using a two-tailed Fisher’s exact test; asterisks indicate a significant difference in % cells carrying the mutation between the NeuN+ and NeuN− cell populations for that case. FCD: focal cortical dysplasia; HME: hemimegalencephaly. See also Table S5.
mTOR pathway activation in dorsal telencephalic progenitors is sufficient to cause abnormal cortical lamination and overgrowth
We explored the importance of abnormal mTOR activation in excitatory versus inhibitory cortical neurons using mouse models with cell type-specific mTOR pathway activation via conditional expression of constitutively active PIK3CA p.H1047R, a mutation associated with both FCD and HME (D’Gama et al., 2015; Jansen et al., 2015), in either the dorsal telencephalic lineage (Emx1-Cre;PIK3CAH1047R/wt, referred to as “Emx1-Cre,” which uses an Emx1-Cre and expresses in excitatory neurons and some glia) (Gorski et al., 2002) or in the interneuron lineage (Nkx2.1-Cre;(ROSA)26-tdTomato fl/PIK3CA_H1047Rfl mice, referred to as “Nkx2.1-Cre,” which uses an Nkx2.1-Cre and also expresses tdTomato in the interneuron lineage). Conditional mTOR pathway activation in the Emx-1 expressing lineage leads to dramatic megalencephaly (Figure 4A-M). The Emx1-Cre P7 cortex is significantly larger than wild-type P7 cortex, with markedly abnormal gyrification in cingulate cortex, neocortex, piriform cortex, and dentate gyrus (Figure 4A-D, M), confirming recent results that abnormal activation of the mTOR pathway in excitatory neurons and glia causes cortical enlargement (Roy et al., 2015).
Figure 4. Conditional expression of the activating PIK3CA mutation H1047R in dorsal telencephalic progenitor cells causes cortical enlargement, especially in superficial layers.
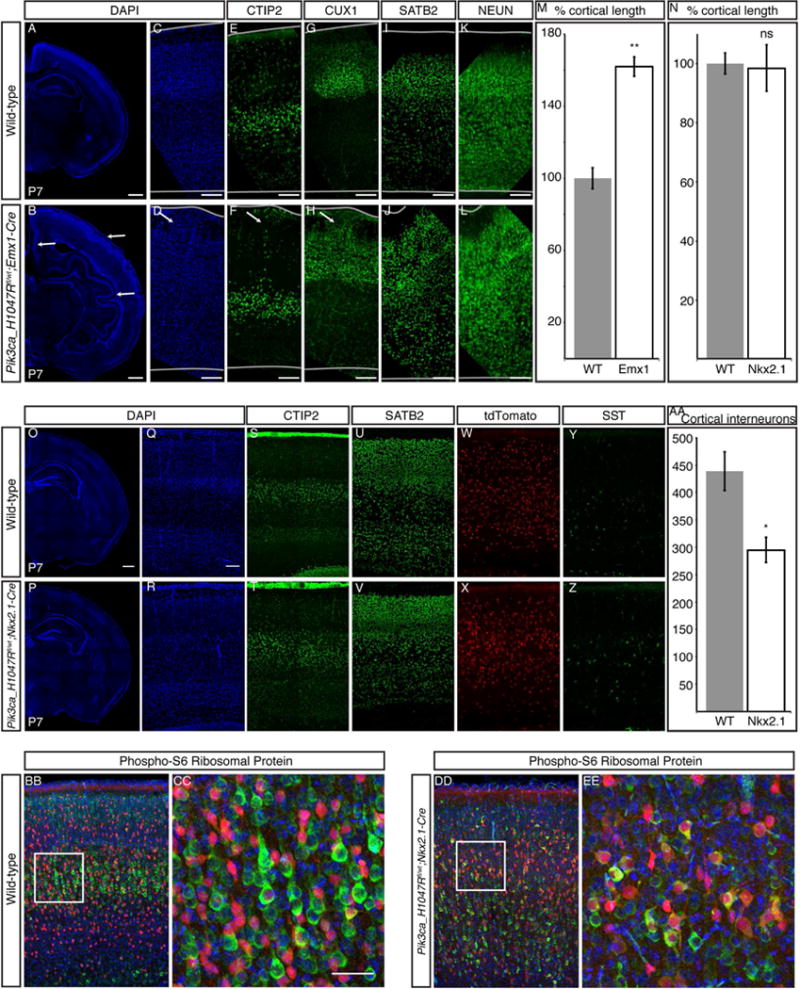
(A–D) Compared with wild-type P7 cortex (A, C), Emx1-Cre;PIK3CAH1047R/wt P7 cortex (B, D) is larger, with marked gyrification in cingulate cortex, neocortex, and piriform cortex (arrows in B,D). (E–L) Deep-layer gene expression (CTIP2) is normal (E–F), with some heterotopic cells reaching the pial surface (arrow in F). (G-J) Superficial-layer gene expression (Cux1, Satb2) is increased, with significant heterotopias (arrow in H). (M) The total length of the neocortical surface is significantly increased in Emx1-Cre mice compared with wild-type. (N) There is no significant difference in total length of the neocortical surface in Nkx2.1-Cre;(ROSA)26-tdTomato fl/PIK3CA_H1047Rfl P7 cortex compared with wild-type. (O-V) Nkx2.1-Cre P7 cortical lamination is comparable with wild-type P7 cortex, as shown by staining with markers of layers V–VI (CTIP2) and layers II/III and IV (SATB2), and no gyrification is present in the mutant. (W–Z) Interneuron distribution in the mutant cortex layers is comparable to wild-type, as shown by tdTomato-positive cells and Somatostatin (SST) staining. (AA) Interneuron number (tdTomato-positive cells) is significantly reduced in Nkx2.1-Cre P7 cortex compared with wild-type. (BB-EE) Compared with wild-type, most tdTomato-positive recombinant interneurons (red) in the Nkx2.1-Cre P7 cortex are also positive for Phospho-S6 Ribosomal Protein (green), an indicator of mTOR pathway activation. N = 3. Unpaired t-test. * P < 0.05, ** P < 0.01. Data are represented as mean ± SEM. Scale bars, 500 μm (whole hemispheres) and 100 μm (cortex higher magnifications).
Markers of deep cortical layers, such as CTIP2, are expressed in Emx1-Cre cortex at comparable levels and in generally similar numbers of cells as in wild-type cortex (Figure 4E-F). Most CTIP2-positive deep-layer neurons in Emx1-Cre cortex have migrated to an appropriate laminar position in layers V and VI, though some heterotopic cells expressing deep-layer markers breach the deep layers and reach the pial surface (arrow, Figure 4F). In contrast, superficial-layer gene expression and migration are significantly abnormal in Emx1-Cre cortex (Figure 4G-J). More neurons in Emx1-Cre cortex express markers of superficial-layer neurons, such as CUX1 and SATB2, compared with wild-type cortex. In addition, laminar structure is markedly abnormal in superficial layers, with significant heterotopias and loss of normal sub-laminar structure. Our results suggest that generation and migration of excitatory cortical neurons is profoundly disrupted in Emx1-Cre cortex.
Although mTOR activation in the dorsal telencephalic lineage creates dramatic megalencephaly, similar activation in the interneuron lineage does not cause detectable dysplasia, megalencephaly, or overgrowth (Figure 4N-EE). We find no significant difference in total length of the neocortical surface between Nkx2.1-Cre and wild-type P7 mice (Figure 4N), consistent with the grossly normal brain seen in conditional knockout mice with TSC1 depletion in Dlx5/6-positive interneuron precursors (Fu et al., 2012). The genotypically wild-type excitatory neurons show normal cortical lamination and layer thickness in the Nkx2.1-Cre brain, with both CTIP2 and SATB2 positive neurons migrating to appropriate positions, and no visible heterotopic cells (Figure 4O-V). In contrast, cortical interneuron number is abnormal in the Nkx2.1-Cre P7 brain, with significantly fewer interneurons compared to wild-type brain (Figure 4W-AA). These results show that expression of mutant PIK3CA in the interneuron lineage does not reproduce the severe phenotype found in the Emx1-Cre mutant. Overall, the mouse models show that abnormal activation of the mTOR pathway in the dorsal telencephalic, but not the interneuron, lineage is sufficient to cause abnormal cortical lamination and overgrowth. Taken together with our single cell results demonstrating that pathogenic somatic mutations occur in neuron-specific progenitors in some cases, these data further suggest that abnormal activation of the mTOR pathway in the excitatory neuron lineage may be sufficient to cause focal MCDs in some cases.
Discussion
In this study, we further elucidate the genetic etiology of FCD and HME, and investigate the cell type-specificity of abnormal mTOR activation in dysplasia pathogenesis. Our data confirm the association of mutations in AKT1, AKT3, DEPDC5, MTOR, NPRL2, PIK3CA, TSC1, and TSC2 with FCD or HME, and show that “two-hit” germline and somatic TSC2 mutations can cause isolated HME. Single cell analyses show that abnormal activation of the mTOR pathway is always present in the neuronal lineage but variably present in glia. Mouse model analyses show that mTOR pathway activation in the dorsal telencephalic lineage, but not the interneuron lineage, is sufficient to model cortical dysplasia. Overall, our results suggest that FCD and HME are not discrete diseases, but rather represent a disease continuum caused by somatic mutations occurring throughout neurogenesis in progenitor cells that give rise to excitatory neurons and in some cases glia.
Our study highlights the relationship between depth of coverage in next generation sequencing experiments and sensitivity to detect pathogenic somatic mutations. In our previous study, we identified a germline TSC2 mutation in HME-11, and in this study the higher depth of coverage achieved allowed us to identify a previously undetectable second somatic TSC2 mutation present in ≈7% of brain cells. We were only able to identify somatic mutations when brain tissue was available, and such mutations were present in as few as 2% of brain cells. The lack of mutation outside the brain emphasizes that sequencing of brain tissue-derived DNA is required for genetic diagnosis in virtually all FCD and HME cases. The dependence of sensitivity upon depth of coverage suggests that still more “unsolved” FCD cases may reflect somatic mutations present at even lower allele frequencies.
We implicate TSC2 mutations in HME, supporting the application of Knudson’s “two-hit” model of tumor pathogenesis (Knudson, 1971) to MCDs. This mechanism is well supported for non-nervous system tumors associated with TSC, such as renal cell carcinoma, but has only rarely been demonstrated for cerebral lesions (Crino et al., 2010; Qin et al., 2010; Tyburczy et al., 2015b). Similarly, a second hit has only once been identified in a FCD patient who carried germline and somatic mutations in DEPDC5 (Baulac et al., 2015). Curiously, a recent report of somatic mutations in TSC1 and TSC2 in FCD cases failed to identify associated germline mutations (Lim et al., 2017), which would seem in principle easier to detect. We demonstrate germline and somatic mutations 1) in TSC2 from non-TSC patients and 2) associated with HME. Our remaining cases with germline loss-of-function mutations may also contain “second hit” mutations that could represent large-scale CNVs undetectable by targeted sequencing, mutations in genes not included in our panel or in introns (Tyburczy et al., 2015a), or mutations below our detection limit.
Our single cell analyses of mutation-positive cases show that the mutations are always present in the neuronal lineage, and in some cases present in neuron-specific progenitors, suggesting that abnormal activation of the mTOR pathway in neurons is necessary and sufficient for the development of focal epileptogenic MCDs. Our Emx1-Cre mouse model demonstrates abnormal cortical overgrowth and cortical lamination defects. Although previous work has described the effect of PIK3CA p.H1047R expression beginning in late embryonic or neonatal ages (Roy et al., 2015), we generate mice with PIK3CA p.H1047R expression beginning in early embryonic age and examine cortical lamination and subtype identity postnatally when this identity is typically fully acquired in the wild-type brain. Although Emx1-Cre is expressed in progenitors that produce all cortical excitatory neurons, expression of constitutively active PIK3CA p.H1047R specifically causes over-production of superficial-layer neurons, which are generated after deep-layer neurons. This has significant implications for human cortical dysplasia because human cortex contains a relatively greater share of superficial-layer neurons, which are uniquely vulnerable to constitutively active PIK3CA expression, compared to mouse cortex.
On the other hand, in our Nkx2.1-Cre mouse model, we do not see cortical overgrowth or cortical lamination defects, and only find a subtle defect in cortical interneuron number. Previous mouse models have shown that conditional activation of mTOR in either neuronal or glial subsets can lead to abnormal cortical enlargement and seizures, generally using inactivation of TSC1, TSC2, or PTEN; however, only mouse models with conditional activation of mTOR in neuron-containing lineages have shown cortical lamination defects (Magri et al., 2013; Meikle et al., 2007; Roy et al., 2015; Uhlmann et al., 2002; Zeng et al., 2011; Zhou et al., 2009). Thus, our data suggests that the cortical lamination defects seen in cortical dysplasia may be due to mutant excitatory neurons. However, mutant glia and neuron-glia interactions may also be contributing to cortical dysplasia pathogenesis, especially to abnormal cortical overgrowth and seizures, in cases where the somatic mutation occurs in a progenitor giving rise to both cell types. Together, our single cell and mouse model analyses suggest that 1) somatic mutations activating the mTOR pathway in dorsal telencephalic progenitors cause a continuum of cortical dysplasias, 2) activation in the excitatory neuron lineage is essential for dysplasia formation, and 3) activation in the excitatory neuron lineage is sufficient for dysplasia formation in some cases.
Given that somatic mutations are frequent, it is reasonable to assume that somatic mutations that activate the mTOR pathway sometimes occur in progenitor cells of the ganglionic eminences that give rise only to interneurons, but such a condition has yet to be described. The relatively normal appearance of the cerebral cortex in the Nkx2.1-Cre mice suggests that such a mutation may not lead to a radiographically or histologically abnormal brain, as with FCD or HME, but may nonetheless disrupt neuronal circuitry and contribute to the development of seizures (Fu et al., 2012), especially given the demonstrated decrease in cortical interneuron number. Families with germline mutations in DEPDC5 have epilepsy, but only a few have radiographically detectable dysplasia (Scheffer et al., 2014). One possibility is that a somatic “second hit” DEPDC5 mutation in the inhibitory lineage may contribute to epilepsy in such patients without obvious dysplasia.
The widespread nature of HME initially suggested that it might reflect mutations in the clonally widespread interneuron lineage, while the focal nature of FCD suggested a defect of the excitatory lineage. In contrast, our data suggest that both lesions likely reflect mutations in dorsal telencephalic progenitors that normally give rise to excitatory neurons. Both the degree of mosaicism (Figure 1) and radiographic extent of these two lesions appear to represent a continuum rather than separable distributions, further suggesting their related origin. In this scenario, the differing extent of smaller and larger lesions would instead reflect the time and place of origin of the somatic mutation in the dorsal cortical progenitor zone (Figure 5), as has been recently hypothesized (Blumcke and Sarnat, 2016; Cepeda et al., 2006). Our data and previous study have suggested that somatic mutations present at lower alternate allele frequencies (AAF) in human brain—that is, mutations present in a smaller number of cells—appear to arise later in development than mutations present at higher AAF—that is, mutations present in a larger number of cells (Lodato et al., 2015).
Figure 5. FCD and HME represent a continuum, with lesion differences reflecting the time and place of origin of the mutation.
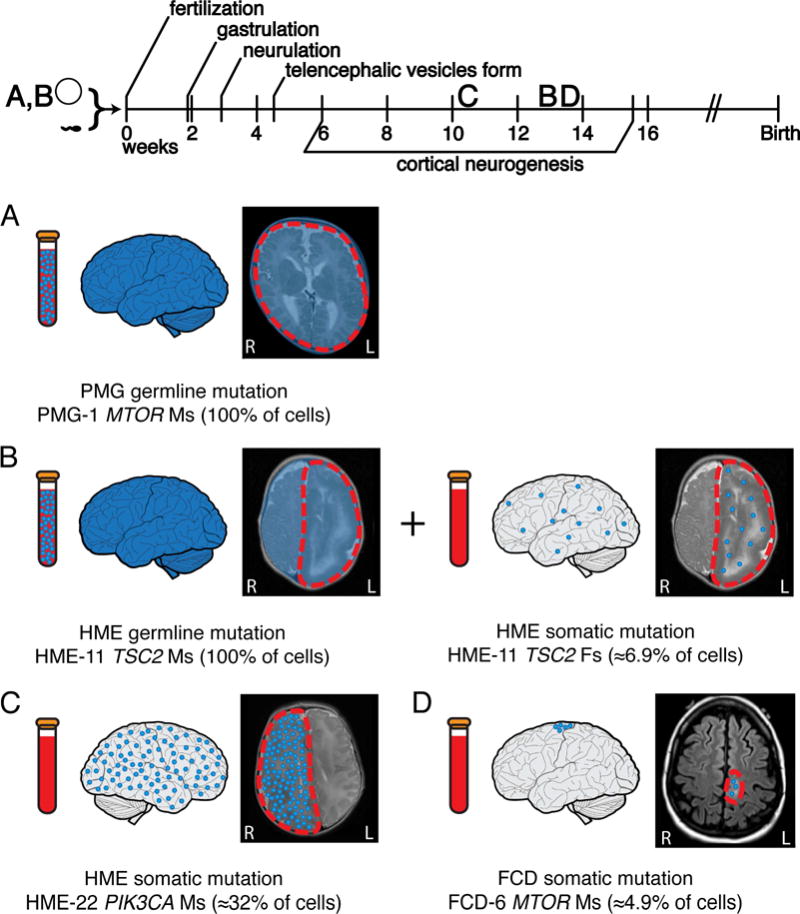
(A) Germline mutations occur before fertilization and are detectable in the brain and a clinically accessible blood sample. Germline activating mutations in the mTOR pathway can lead to megalencephaly, as seen in case PMG-1 with a de novo germline MTOR mutation. (B) “Two-hit” germline and somatic mutations in negative regulators of the mTOR pathway can lead to focal MCDs. In some cases, such as HME-11 with two TSC2 mutations, we have identified both a germline and a somatic mutation leading to HME. The germline mutation was detectable in brain and blood, while the somatic mutation occurred later during embryonic development and was detectable only in brain. (C) Activating somatic mutations in positive regulators of the mTOR pathway can also lead to focal MCDs. Those mutations present at a higher AAF, suggesting they arose earlier during cortical neurogenesis, appear more likely to lead to HME; for example, we identify a somatic activating point mutation in PIK3CA present in ≈32% of the cells in the abnormal hemisphere of case HME-22. (D) Mutations present at a lower AAF, suggesting they arose later during cortical neurogenesis, appear more likely to lead to FCD; for example, we identify a somatic activating point mutation in MTOR present in ≈4.9% of the cells in the abnormal cortical tissue of case FCD-6. AAF: alternate allele frequency; FCD: focal cortical dysplasia; HME: hemimegalencephaly, PMG: polymicrogyria.
Analyzing our results in combination with recent studies strongly supports a relationship between the allele frequency of a mutation and the resulting phenotype (Figure 6). For example, for patients carrying the p.S2215Y/F mutation in MTOR, fourteen patients with FCD, mostly FCD IIb, carry the mutation in 2.1–18.6% of cells, and two patients with HME carry the mutation in 14.2–41.2% of cells (Lim et al., 2015; Mirzaa et al., 2016; Moller et al., 2016; Nakashima et al., 2015). In fact, analyzing all of the somatic mutations reported in the literature associated with FCD and HME reveals that the average AAF for somatic mutations associated with FCD, 3.76 ± 2.89%, is significantly lower than the average AAF for somatic mutations associated with HME, 16.35 ± 9.26% (p<0.0001, two-tailed t test) (Table S6). Thus, a larger fraction of cells carrying a mutation, which suggests the mutation arose earlier in development, appears to correlate with a “larger” MCD and a more severe phenotype. The two FCD cases in whom the pathogenic mutations were limited to neurons also showed the lowest alternate allele frequencies, consistent with the suggestion that these limited mutations arose later during development, potentially after segregation of neuronal and glial lineages, compared to mutations present more broadly.
Figure 6. The relationship between alternate allele frequency and disease phenotype is evident for both individual mutant alleles and overall identified mutations.
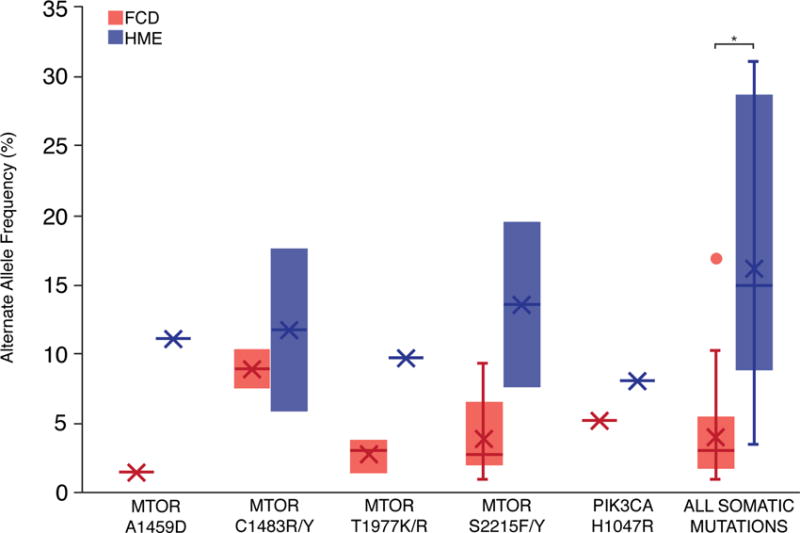
After performing a literature review to identify all reported mutations associated with FCD and HME and their average AAFs, we identified individual mutant alleles associated with both FCD and HME. Due to the small number of cases associated with each mutant allele, p values were not calculated for individual alleles. Overall, the average AAF for somatic mutations associated with FCD is significantly lower than the average AAF for somatic mutations associated with HME (p<0.0001, two-tailed t test). See also Table S6.
Comparison of our results to recent studies of functionally silent clonal somatic mutation in normal human brain (Lodato et al., 2015) suggests that mTOR gain-of-function produces a proliferative advantage resulting in an approximately 10-fold enrichment of mutant cells compared to normal cells. Functionally silent somatic mutations that occupy focal shapes and volumes similar to FCD or hemispheric patterns similar to HME are present at much smaller alternative allele fractions than mTOR pathway mutations: 0.1–1% versus 1–10% for FCD-sized lesions; 1–5% versus 5–30% for HME-sized lesions (Evrony et al., 2015; Lodato et al., 2015). Mutations not affecting proliferation are also usually detected both in brain and non-brain tissues at AAF >≈5% (Jamuar et al., 2014; Lodato et al., 2015), but mTOR mutations are limited to the brain, further supporting a proliferative advantage in the brain for mTOR mutations. This suggests that most FCD and HME mutations arise in dorsal cerebral cortical progenitors after the neural plate stage but show a relative growth advantage allowing them to achieve higher clonal fractions than cells carrying functionally silent mutations.
Currently, patients with FCD and HME and intractable epilepsy rely on surgical resection for attempted seizure control. With our identification of mutations in TSC1/2 in patients with FCD and HME, we provide further evidence linking FCD, HME, and TSC with the hope that mTOR inhibitors currently being studied in patients with TSC may be effective for patients with FCD and HME (Poduri, 2014). Recently, several mouse models of focal MCDs have shown alleviation of seizures upon treatment with mTOR pathway inhibitors (Baek et al., 2015; Lim et al., 2015; Roy et al., 2015). Clinical testing for somatic mutations is limited and currently requires submission of multiple tissue types, but our data suggest that analysis of brain tissue alone with deep sequencing strategies is sufficient to detect the relevant mutations. If emerging clinical trials require a tissue diagnosis, as is the case in the molecular treatment of somatic cancers (Xue and Wilcox, 2016), then clinical studies may need to adopt deep sequencing strategies of brain tissue from FCD and HME cases.
Experimental Procedures
Patient Cohort
This study was approved by the institutional review boards of Boston Children’s Hospital, University of California Los Angeles, and Cleveland Clinic. Subjects were identified and evaluated in a clinical setting, and biological samples were collected for research after obtaining written informed consent. 95 patients were included; 52 had FCD, 38 had HME, and 5 had PMG (4/5 with megalencephaly) based on MRI and neuropathology. Clinical information, including gender, for cases with identified variants is reported in Table S2.
DNA sequencing and analysis
Genomic DNA was extracted from patient samples using standard methods. We prepared libraries using two custom Haloplex panels (Agilent) according to the manufacturer’s protocol and performed sequencing on HiSeq sequencers (Illumina). Further details on panel design, DNA library preparation, sequencing, and analysis are available in the Supplemental Experimental Procedures.
Validation of mTOR Pathway Variants
Rare and protein-altering (missense, nonsense, splice site, frameshift, and insertion-deletion) variants in the target genes were validated using Sanger sequencing. For potential somatic variants, validation was performed using digital droplet PCR (ddPCR) or subcloning. In addition, for potential somatic variants, ddPCR was performed on any additional samples that were not sequenced, and for all variants segregation analysis was performed when parental DNA was available. Further validation details are available in the Supplemental Experimental Procedures.
Single Nuclei Analysis
Isolation of single nuclei using fluorescence-activated nuclear sorting (FANS) with antisera to NeuN (Millipore MAB377X), and whole genome amplification using multiple displacement amplification (MDA) were performed as described previously (Evrony et al., 2012). Single nuclei from FCD-6, FCD-8, FCD-12, FCD-14, HME-16, HME-22, and HME-23 were isolated, amplified, and sequenced for their respective pathogenic mutations using PCR (GoTaq Hot Start DNA Polymerase, Promega). Analysis to calculate the number of cells with the mutation, taking into account allelic dropout, was performed as described previously (Evrony et al., 2012). For HME-16, we combined our current with our previous analysis (Evrony et al., 2012). Cell counts of NeuN+ and NeuN− populations with pathogenic mutations identified using single nuclei analysis were compared using a two-tailed Fisher’s exact test and corrected for multiple testing.
Mouse models and Immunohistochemistry
All mouse studies were approved by the Boston Children’s Hospital IACUC, and were performed in accordance with institutional and federal guidelines. Emx1-Cre (RRID: MGI_4440744, stock number 005628), Nkx2.1-Cre (RRID: MGI 3773076, stock number 008661), Rosa26R-tdTomato-Ai9 (RRID: MGI_3809523, stock number 007909), and Rosa26-Pik3ca_H1047R (RRID: MGI_5000472, stock number 016977) mice were purchased from Jackson Laboratories. Mice were housed with a standard 12-hour light/dark schedule (lights on at 07:00 AM) and mixed gender was used for all experiments.
Littermate pairs of experimental and control mice were collected on postnatal day 7 and transcardially perfused with 4% paraformaldehyde, and brains were dissected and post-fixed at 4°C overnight. Tissue was sectioned at 50 μm coronal sections on a vibrating microtome (Leica). Anatomically matched sections were selected from each mouse, and somatosensory cortex was imaged by fluorescent microscopy (for montages) and confocal microscopy (for individual immunostains). Non-specific epitopes were blocked through 1h incubation at room temperature (RT) in 8% goat serum/0.3% bovine serum albumin or 10% normal donkey serum in phosphate-buffered saline (PBS 1X) prior to incubation with primary antibody diluted in blocking solution at 4°C overnight. Secondary antibody incubation was performed for 1.5h at RT. For DAPI staining, tissue was either mounted in DAPI-Fluoromount-G (SouthernBiotech) or incubated for 10min with Hoechst 33342 (Thermo Fisher Scientific) diluted 1:5000 in PBS 1X prior to mounting in Fluoromount G without DAPI (Southern Biotech). Primary antibodies: rabbit anti-Satb2 (1:300, Abcam ab92446), rabbit anti-Ctip2 (1:300, Abcam ab28448), rabbit anti-CDP1 (1:200, Santa Cruz M-222), rabbit anti-Phospho-S6 Ribosomal Protein (Ser235/236) (1:400, Cell Signaling Technology 4858), mouse anti-NeuN (Millipore, MAB377), rat anti-Somatostatin (1:50, Abcam ab30788). Secondary antibodies: donkey anti-rabbit, donkey anti-rat, and goat anti-mouse Alexa Fluor 488 (1:800, Thermo Fisher). Fluorescently stained sections were imaged with a Zeiss LSM 700 confocal microscope driven by ZEN Imaging Software and equipped with a 10× Plan-APOCHROMAT/NA 0.45 and a 20× Plan-APOCHROMAT/NA 0.8 objectives. Fluorophore excitation and scanning were performed with diode lasers at 405nm, 488nm and 561nm for Hoechst, Alexa 488 and tdTomato respectively. For cortical length measurements, whole hemispheres were imaged using the Tile-scan mode and a 10× objective, and the superficial surface of layer II/III was measured from motor cortex to piriform cortex using Image J. For cortical layer markers, the entire cortical thickness corresponding to the region of the somatosensory cortex was imaged using the Tile-scan mode and a 20x objective. Images were analyzed using ImageJ to obtain the whole z-stack data set and measure cortical length.
Statistical analysis
Mean alternate allele frequencies of pathogenic somatic mutations identified in FCD and HME cases reported by our study and the published literature were compared using a two-tailed unpaired t test.
Supplementary Material
Table S1: Details for Identified Variants, Related to Table 1
Table S2: Clinical Information for Patients with Pathogenic Variants, Related to Table 1
Table S4: Sequencing and Validation Details for Pathogenic Variants from this study and our previous studies, Related to Figure 2
Table S6: Literature Review, Related to Figure 6
Acknowledgments
We are grateful for the participation of the patients enrolled in our studies. We thank Peter Black, Anne Bergin, Derek Bruce, John Gaitanis, Harvey Sarnat, Howard Weiner, Mustafa Sahin, Heather Olsen, James Riviello, Farraf Rajabi, Robyn Busch, William Bingaman, Jorge Gonzalez-Martinez, and Katherine Keever for recruiting patients and providing tissue samples; Aldo Rozzo, R. Sean Hill, Jennifer Partlow, and Brenda Barry for logistical assistance. This research was supported in part by the Repository Core for Neurological Disorders, Department of Neurology, Boston Children’s Hospital, and the IDDRC (NIH P30HD018655). A.M.D. was supported by the NIGMS (T32GM007753), the NRSA (5T32 GM007226–39), and the Stuart H.Q. & Victoria Quan Fellowship at Harvard Medical School. M.B.W. was supported by the Leonard and Isabelle Goldenson Research Fellowship. A.J.B. was supported by the NIMDS (R01NS035129). D.J.K. was supported by the European Commission (602391–2). H.V.V. was supported by the NINDS (NS083823). G.W.M. was supported by the NINDS (R01NS083823 and R01NS038992) and the Davies/Crandall endowed Chair for Epilepsy Research at UCLA. I.B. was supported by the European Union FP7 health program under grant agreement #602531. A.P. was supported by the NINDS (K23NS069784) and the Boston Children’s Hospital Translational Research Program. C.A.W. was supported by the NINDS (RO1NS079277 and R01 NS035129), the NIMH (U01MH106883), Paul G. Allen Frontiers Program, and Manton Center for Orphan Disease Research. C.A.W. is an Investigator of the Howard Hughes Medical Institute.
Footnotes
Publisher's Disclaimer: This is a PDF file of an unedited manuscript that has been accepted for publication. As a service to our customers we are providing this early version of the manuscript. The manuscript will undergo copyediting, typesetting, and review of the resulting proof before it is published in its final citable form. Please note that during the production process errors may be discovered which could affect the content, and all legal disclaimers that apply to the journal pertain.
Author Contributions
A.M.D., A.P., and C.A.W. designed the study. C.A.W. supervised the study. A.M.D., M.B.W, A.H., S.B., and N.E.H. performed experiments and analyzed data. C.M.L., Z.Y., I.B., D.J.K., H.V.V., J.R.M., and G.W.M. recruited patients and collected and prepared tissue samples. E.Y., Z.Y., I.B., A.J.B., G.W.M., C.A.W., I.N., and A.P. interpreted brain imaging. A.M.D., A.P., and C.A.W. wrote the manuscript, and all coauthors edited the manuscript.
Accession Numbers
Targeted sequencing data deposition for cases with variants reported in this paper: dbGAP phs000492 (in process).
Declaration of Interests
H.V.V. owns stock in several pharmaceutical companies and has received honoraria for lectures (no direct conflict with this paper). G.W.M. serves on the Data Management Committee for Neuropace, Inc. I.B. has received honoraria for lectures (no direct conflict with this paper).
References
- Aronica E, Crino PB. Epilepsy related to developmental tumors and malformations of cortical development. Neurotherapeutics. 2014;11:251–268. doi: 10.1007/s13311-013-0251-0. [DOI] [PMC free article] [PubMed] [Google Scholar]
- Baek ST, Copeland B, Yun EJ, Kwon SK, Guemez-Gamboa A, Schaffer AE, Kim S, Kang HC, Song S, Mathern GW, et al. An AKT3-FOXG1-reelin network underlies defective migration in human focal malformations of cortical development. Nature medicine. 2015;21:1445–1454. doi: 10.1038/nm.3982. [DOI] [PMC free article] [PubMed] [Google Scholar]
- Baulac S, Ishida S, Marsan E, Miquel C, Biraben A, Nguyen DK, Nordli D, Cossette P, Nguyen S, Lambrecq V, et al. Familial focal epilepsy with focal cortical dysplasia due to DEPDC5 mutations. Annals of neurology. 2015;77:675–683. doi: 10.1002/ana.24368. [DOI] [PubMed] [Google Scholar]
- Blumcke I, Sarnat HB. Somatic mutations rather than viral infection classify focal cortical dysplasia type II as mTORopathy. Curr Opin Neurol. 2016;29:388–395. doi: 10.1097/WCO.0000000000000303. [DOI] [PubMed] [Google Scholar]
- Blumcke I, Spreafico R, Haaker G, Coras R, Kobow K, Bien CG, Pfafflin M, Elger C, Widman G, Schramm J, et al. Histopathological Findings in Brain Tissue Obtained during Epilepsy Surgery. N Engl J Med. 2017;377:1648–1656. doi: 10.1056/NEJMoa1703784. [DOI] [PubMed] [Google Scholar]
- Blumcke I, Thom M, Aronica E, Armstrong DD, Vinters HV, Palmini A, Jacques TS, Avanzini G, Barkovich AJ, Battaglia G, et al. The clinicopathologic spectrum of focal cortical dysplasias: a consensus classification proposed by an ad hoc Task Force of the ILAE Diagnostic Methods Commission. Epilepsia. 2011;52:158–174. doi: 10.1111/j.1528-1167.2010.02777.x. [DOI] [PMC free article] [PubMed] [Google Scholar]
- Cepeda C, Andre VM, Levine MS, Salamon N, Miyata H, Vinters HV, Mathern GW. Epileptogenesis in pediatric cortical dysplasia: the dysmature cerebral developmental hypothesis. Epilepsy Behav. 2006;9:219–235. doi: 10.1016/j.yebeh.2006.05.012. [DOI] [PubMed] [Google Scholar]
- Crino PB, Aronica E, Baltuch G, Nathanson KL. Biallelic TSC gene inactivation in tuberous sclerosis complex. Neurology. 2010;74:1716–1723. doi: 10.1212/WNL.0b013e3181e04325. [DOI] [PMC free article] [PubMed] [Google Scholar]
- D’Gama AM, Geng Y, Couto JA, Martin B, Boyle EA, LaCoursiere CM, Hossain A, Hatem NE, Barry B, Kwiatkowski DJ, et al. mTOR pathway mutations cause hemimegalencephaly and focal cortical dysplasia. Annals of neurology. 2015 doi: 10.1002/ana.24357. [DOI] [PMC free article] [PubMed] [Google Scholar]
- Dabora SL, Jozwiak S, Franz DN, Roberts PS, Nieto A, Chung J, Choy YS, Reeve MP, Thiele E, Egelhoff JC, et al. Mutational analysis in a cohort of 224 tuberous sclerosis patients indicates increased severity of TSC2, compared with TSC1, disease in multiple organs. Am J Hum Genet. 2001;68:64–80. doi: 10.1086/316951. [DOI] [PMC free article] [PubMed] [Google Scholar]
- Evrony GD, Cai X, Lee E, Hills LB, Elhosary PC, Lehmann HS, Parker JJ, Atabay KD, Gilmore EC, Poduri A, et al. Single-neuron sequencing analysis of L1 retrotransposition and somatic mutation in the human brain. Cell. 2012;151:483–496. doi: 10.1016/j.cell.2012.09.035. [DOI] [PMC free article] [PubMed] [Google Scholar]
- Evrony GD, Lee E, Mehta BK, Benjamini Y, Johnson RM, Cai X, Yang L, Haseley P, Lehmann HS, Park PJ, et al. Cell lineage analysis in human brain using endogenous retroelements. Neuron. 2015;85:49–59. doi: 10.1016/j.neuron.2014.12.028. [DOI] [PMC free article] [PubMed] [Google Scholar]
- Fu C, Cawthon B, Clinkscales W, Bruce A, Winzenburger P, Ess KC. GABAergic interneuron development and function is modulated by the Tsc1 gene. Cereb Cortex. 2012;22:2111–2119. doi: 10.1093/cercor/bhr300. [DOI] [PMC free article] [PubMed] [Google Scholar]
- Gao P, Postiglione MP, Krieger TG, Hernandez L, Wang C, Han Z, Streicher C, Papusheva E, Insolera R, Chugh K, et al. Deterministic progenitor behavior and unitary production of neurons in the neocortex. Cell. 2014;159:775–788. doi: 10.1016/j.cell.2014.10.027. [DOI] [PMC free article] [PubMed] [Google Scholar]
- Gorski JA, Talley T, Qiu M, Puelles L, Rubenstein JL, Jones KR. Cortical excitatory neurons and glia, but not GABAergic neurons, are produced in the Emx1-expressing lineage. J Neurosci. 2002;22:6309–6314. doi: 10.1523/JNEUROSCI.22-15-06309.2002. [DOI] [PMC free article] [PubMed] [Google Scholar]
- Grabiner BC, Nardi V, Birsoy K, Possemato R, Shen K, Sinha S, Jordan A, Beck AH, Sabatini DM. A diverse array of cancer-associated MTOR mutations are hyperactivating and can predict rapamycin sensitivity. Cancer Discov. 2014;4:554–563. doi: 10.1158/2159-8290.CD-13-0929. [DOI] [PMC free article] [PubMed] [Google Scholar]
- Harvey AS, Cross JH, Shinnar S, Mathern GW, Taskforce IPESS. Defining the spectrum of international practice in pediatric epilepsy surgery patients. Epilepsia. 2008;49:146–155. doi: 10.1111/j.1528-1167.2007.01421.x. [DOI] [PubMed] [Google Scholar]
- Hirfanoglu T, Gupta A. Tuberous sclerosis complex with a single brain lesion on MRI mimicking focal cortical dysplasia. Pediatric neurology. 2010;42:343–347. doi: 10.1016/j.pediatrneurol.2010.01.001. [DOI] [PubMed] [Google Scholar]
- Hoelz H, Coppenrath E, Hoertnagel K, Roser T, Tacke M, Gerstl L, Borggraefe I. Childhood-Onset Epileptic Encephalopathy Associated With Isolated Focal Cortical Dysplasia and a Novel TSC1 Germline Mutation. Clin EEG Neurosci. 2017 doi: 10.1177/1550059417697841. 1550059417697841. [DOI] [PubMed] [Google Scholar]
- Hoogeveen-Westerveld M, Wentink M, van den Heuvel D, Mozaffari M, Ekong R, Povey S, den Dunnen JT, Metcalfe K, Vallee S, Krueger S, et al. Functional assessment of variants in the TSC1 and TSC2 genes identified in individuals with Tuberous Sclerosis Complex. Human mutation. 2011;32:424–435. doi: 10.1002/humu.21451. [DOI] [PubMed] [Google Scholar]
- Jamuar SS, Lam AT, Kircher M, D’Gama AM, Wang J, Barry BJ, Zhang X, Hill RS, Partlow JN, Rozzo A, et al. Somatic mutations in cerebral cortical malformations. N Engl J Med. 2014;371:733–743. doi: 10.1056/NEJMoa1314432. [DOI] [PMC free article] [PubMed] [Google Scholar]
- Jansen LA, Mirzaa GM, Ishak GE, O’Roak BJ, Hiatt JB, Roden WH, Gunter SA, Christian SL, Collins S, Adams C, et al. PI3K/AKT pathway mutations cause a spectrum of brain malformations from megalencephaly to focal cortical dysplasia. Brain. 2015;138:1613–1628. doi: 10.1093/brain/awv045. [DOI] [PMC free article] [PubMed] [Google Scholar]
- Jones AC, Shyamsundar MM, Thomas MW, Maynard J, Idziaszczyk S, Tomkins S, Sampson JR, Cheadle JP. Comprehensive mutation analysis of TSC1 and TSC2-and phenotypic correlations in 150 families with tuberous sclerosis. Am J Hum Genet. 1999;64:1305–1315. doi: 10.1086/302381. [DOI] [PMC free article] [PubMed] [Google Scholar]
- Kingsmore S, Smith L, Soden S, Dinwiddie D, Saunders C, Farrow E, Miller N, Abdelmoity A, Atherton A. Exome Sequencing Reveals De Novo Germline Mutation of the Mammalian Target of Rapamycin (MTOR) in a Patient with Megalencephaly and Intractable Seizures. Journal of Genomes and Exomes. 2013;63 [Google Scholar]
- Knudson AG., Jr Mutation and cancer: statistical study of retinoblastoma. Proc Natl Acad Sci U S A. 1971;68:820–823. doi: 10.1073/pnas.68.4.820. [DOI] [PMC free article] [PubMed] [Google Scholar]
- Kurek KC, Luks VL, Ayturk UM, Alomari AI, Fishman SJ, Spencer SA, Mulliken JB, Bowen ME, Yamamoto GL, Kozakewich HP, et al. Somatic mosaic activating mutations in PIK3CA cause CLOVES syndrome. Am J Hum Genet. 2012;90:1108–1115. doi: 10.1016/j.ajhg.2012.05.006. [DOI] [PMC free article] [PubMed] [Google Scholar]
- Kwan P, Arzimanoglou A, Berg AT, Brodie MJ, Allen Hauser W, Mathern G, Moshe SL, Perucca E, Wiebe S, French J. Definition of drug resistant epilepsy: consensus proposal by the ad hoc Task Force of the ILAE Commission on Therapeutic Strategies. Epilepsia. 2010;51:1069–1077. doi: 10.1111/j.1528-1167.2009.02397.x. [DOI] [PubMed] [Google Scholar]
- Lal D, Reinthaler EM, Schubert J, Muhle H, Riesch E, Kluger G, Jabbari K, Kawalia A, Baumel C, Holthausen H, et al. DEPDC5 mutations in genetic focal epilepsies of childhood. Annals of neurology. 2014;75:788–792. doi: 10.1002/ana.24127. [DOI] [PubMed] [Google Scholar]
- Lee JH, Huynh M, Silhavy JL, Kim S, Dixon-Salazar T, Heiberg A, Scott E, Bafna V, Hill KJ, Collazo A, et al. De novo somatic mutations in components of the PI3K-AKT3-mTOR pathway cause hemimegalencephaly. Nature genetics. 2012;44:941–945. doi: 10.1038/ng.2329. [DOI] [PMC free article] [PubMed] [Google Scholar]
- Lim JS, Gopalappa R, Kim SH, Ramakrishna S, Lee M, Kim WI, Kim J, Park SM, Lee J, Oh JH, et al. Somatic Mutations in TSC1 and TSC2 Cause Focal Cortical Dysplasia. Am J Hum Genet. 2017;100:454–472. doi: 10.1016/j.ajhg.2017.01.030. [DOI] [PMC free article] [PubMed] [Google Scholar]
- Lim JS, Kim WI, Kang HC, Kim SH, Park AH, Park EK, Cho YW, Kim S, Kim HM, Kim JA, et al. Brain somatic mutations in MTOR cause focal cortical dysplasia type II leading to intractable epilepsy. Nature medicine. 2015;21:395–400. doi: 10.1038/nm.3824. [DOI] [PubMed] [Google Scholar]
- Lindhurst MJ, Sapp JC, Teer JK, Johnston JJ, Finn EM, Peters K, Turner J, Cannons JL, Bick D, Blakemore L, et al. A mosaic activating mutation in AKT1 associated with the Proteus syndrome. N Engl J Med. 2011;365:611–619. doi: 10.1056/NEJMoa1104017. [DOI] [PMC free article] [PubMed] [Google Scholar]
- Lipton JO, Sahin M. The neurology of mTOR. Neuron. 2014;84:275–291. doi: 10.1016/j.neuron.2014.09.034. [DOI] [PMC free article] [PubMed] [Google Scholar]
- Lodato MA, Woodworth MB, Lee S, Evrony GD, Mehta BK, Karger A, Lee S, Chittenden TW, D’Gama AM, Cai X, et al. Somatic mutation in single human neurons tracks developmental and transcriptional history. Science. 2015;350:94–98. doi: 10.1126/science.aab1785. [DOI] [PMC free article] [PubMed] [Google Scholar]
- Magri L, Cominelli M, Cambiaghi M, Cursi M, Leocani L, Minicucci F, Poliani PL, Galli R. Timing of mTOR activation affects tuberous sclerosis complex neuropathology in mouse models. Dis Model Mech. 2013;6:1185–1197. doi: 10.1242/dmm.012096. [DOI] [PMC free article] [PubMed] [Google Scholar]
- Meikle L, Talos DM, Onda H, Pollizzi K, Rotenberg A, Sahin M, Jensen FE, Kwiatkowski DJ. A mouse model of tuberous sclerosis: neuronal loss of Tsc1 causes dysplastic and ectopic neurons, reduced myelination, seizure activity, and limited survival. J Neurosci. 2007;27:5546–5558. doi: 10.1523/JNEUROSCI.5540-06.2007. [DOI] [PMC free article] [PubMed] [Google Scholar]
- Mirzaa GM, Campbell CD, Solovieff N, Goold CP, Jansen LA, Menon S, Timms AE, Conti V, Biag JD, Olds C, et al. Association of MTOR Mutations With Developmental Brain Disorders, Including Megalencephaly, Focal Cortical Dysplasia, and Pigmentary Mosaicism. JAMA Neurol. 2016;73:836–845. doi: 10.1001/jamaneurol.2016.0363. [DOI] [PMC free article] [PubMed] [Google Scholar]
- Mirzaa GM, Conti V, Timms AE, Smyser CD, Ahmed S, Carter M, Barnett S, Hufnagel RB, Goldstein A, Narumi-Kishimoto Y, et al. Characterisation of mutations of the phosphoinositide-3-kinase regulatory subunit, PIK3R2, in perisylvian polymicrogyria: a next-generation sequencing study. Lancet Neurol. 2015;14:1182–1195. [Google Scholar]
- Moller RS, Weckhuysen S, Chipaux M, Marsan E, Taly V, Bebin EM, Hiatt SM, Prokop JW, Bowling KM, Mei D, et al. Germline and somatic mutations in the MTOR gene in focal cortical dysplasia and epilepsy. Neurol Genet. 2016;2:e118. doi: 10.1212/NXG.0000000000000118. [DOI] [PMC free article] [PubMed] [Google Scholar]
- Nakashima M, Saitsu H, Takei N, Tohyama J, Kato M, Kitaura H, Shiina M, Shirozu H, Masuda H, Watanabe K, et al. Somatic Mutations in the MTOR gene cause focal cortical dysplasia type IIb. Annals of neurology. 2015;78:375–386. doi: 10.1002/ana.24444. [DOI] [PubMed] [Google Scholar]
- Poduri A. DEPDC5 does it all: shared genetics for diverse epilepsy syndromes. Annals of neurology. 2014;75:631–633. doi: 10.1002/ana.24160. [DOI] [PubMed] [Google Scholar]
- Poduri A, Evrony GD, Cai X, Elhosary PC, Beroukhim R, Lehtinen MK, Hills LB, Heinzen EL, Hill A, Hill RS, et al. Somatic activation of AKT3 causes hemispheric developmental brain malformations. Neuron. 2012;74:41–48. doi: 10.1016/j.neuron.2012.03.010. [DOI] [PMC free article] [PubMed] [Google Scholar]
- Qin W, Chan JA, Vinters HV, Mathern GW, Franz DN, Taillon BE, Bouffard P, Kwiatkowski DJ. Analysis of TSC cortical tubers by deep sequencing of TSC1, TSC2 and KRAS demonstrates that small second-hit mutations in these genes are rare events. Brain Pathol. 2010;20:1096–1105. doi: 10.1111/j.1750-3639.2010.00416.x. [DOI] [PMC free article] [PubMed] [Google Scholar]
- Roy A, Skibo J, Kalume F, Ni J, Rankin S, Lu Y, Dobyns WB, Mills GB, Zhao JJ, Baker SJ, et al. Mouse models of human PIK3CA-related brain overgrowth have acutely treatable epilepsy. Elife. 2015;4 doi: 10.7554/eLife.12703. [DOI] [PMC free article] [PubMed] [Google Scholar]
- Scheffer IE, Heron SE, Regan BM, Mandelstam S, Crompton DE, Hodgson BL, Licchetta L, Provini F, Bisulli F, Vadlamudi L, et al. Mutations in mammalian target of rapamycin regulator DEPDC5 cause focal epilepsy with brain malformations. Annals of neurology. 2014;75:782–787. doi: 10.1002/ana.24126. [DOI] [PubMed] [Google Scholar]
- Sim JC, Scerri T, Fanjul-Fernandez M, Riseley JR, Gillies G, Pope K, van Roozendaal H, Heng JI, Mandelstam SA, McGillivray G, et al. Familial cortical dysplasia caused by mutation in the mammalian target of rapamycin regulator NPRL3. Annals of neurology. 2016;79:132–137. doi: 10.1002/ana.24502. [DOI] [PubMed] [Google Scholar]
- Tyburczy ME, Dies KA, Glass J, Camposano S, Chekaluk Y, Thorner AR, Lin L, Krueger D, Franz DN, Thiele EA, et al. Mosaic and Intronic Mutations in TSC1/TSC2 Explain the Majority of TSC Patients with No Mutation Identified by Conventional Testing. PLoS Genet. 2015a;11:e1005637. doi: 10.1371/journal.pgen.1005637. [DOI] [PMC free article] [PubMed] [Google Scholar]
- Tyburczy ME, Jozwiak S, Malinowska IA, Chekaluk Y, Pugh TJ, Wu CL, Nussbaum RL, Seepo S, Dzik T, Kotulska K, et al. A shower of second hit events as the cause of multifocal renal cell carcinoma in tuberous sclerosis complex. Hum Mol Genet. 2015b;24:1836–1842. doi: 10.1093/hmg/ddu597. [DOI] [PMC free article] [PubMed] [Google Scholar]
- Uhlmann EJ, Wong M, Baldwin RL, Bajenaru ML, Onda H, Kwiatkowski DJ, Yamada K, Gutmann DH. Astrocyte-specific TSC1 conditional knockout mice exhibit abnormal neuronal organization and seizures. Annals of neurology. 2002;52:285–296. doi: 10.1002/ana.10283. [DOI] [PubMed] [Google Scholar]
- Weckhuysen S, Marsan E, Lambrecq V, Marchal C, Morin-Brureau M, An-Gourfinkel I, Baulac M, Fohlen M, Kallay Zetchi C, Seeck M, et al. Involvement of GATOR complex genes in familial focal epilepsies and focal cortical dysplasia. Epilepsia. 2016;57:994–1003. doi: 10.1111/epi.13391. [DOI] [PubMed] [Google Scholar]
- Xue Y, Wilcox WR. Changing paradigm of cancer therapy: precision medicine by next-generation sequencing. Cancer Biol Med. 2016;13:12–18. doi: 10.28092/j.issn.2095-3941.2016.0003. [DOI] [PMC free article] [PubMed] [Google Scholar]
- Zeng LH, Rensing NR, Zhang B, Gutmann DH, Gambello MJ, Wong M. Tsc2 gene inactivation causes a more severe epilepsy phenotype than Tsc1 inactivation in a mouse model of tuberous sclerosis complex. Hum Mol Genet. 2011;20:445–454. doi: 10.1093/hmg/ddq491. [DOI] [PMC free article] [PubMed] [Google Scholar]
- Zhou J, Blundell J, Ogawa S, Kwon CH, Zhang W, Sinton C, Powell CM, Parada LF. Pharmacological inhibition of mTORC1 suppresses anatomical, cellular, and behavioral abnormalities in neural-specific Pten knock-out mice. J Neurosci. 2009;29:1773–1783. doi: 10.1523/JNEUROSCI.5685-08.2009. [DOI] [PMC free article] [PubMed] [Google Scholar]
Associated Data
This section collects any data citations, data availability statements, or supplementary materials included in this article.
Supplementary Materials
Table S1: Details for Identified Variants, Related to Table 1
Table S2: Clinical Information for Patients with Pathogenic Variants, Related to Table 1
Table S4: Sequencing and Validation Details for Pathogenic Variants from this study and our previous studies, Related to Figure 2
Table S6: Literature Review, Related to Figure 6