

SUMMARY
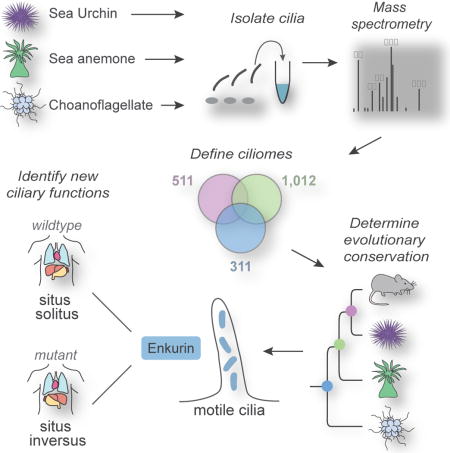
Cilia are organelles specialized for movement and signaling. To infer when during evolution signaling pathways became associated with cilia, we characterized the proteomes of cilia from sea urchins, sea anemones and choanoflagellates. We identified 437 high confidence ciliary candidate proteins conserved in mammals and discovered that Hh and GPCR pathways were linked to cilia before the origin of bilateria and TRP channels before the origin of animals. We demonstrated that candidates not previously implicated in ciliary biology localized to cilia and further investigated ENKUR, a TRP channel-interacting protein identified in the cilia of all three organisms. ENKUR localizes to motile cilia and is required for patterning the left/right axis in vertebrates. Moreover, mutation of ENKUR causes situs inversus in humans. Thus, proteomic profiling of cilia from diverse eukaryotes defines a conserved ciliary proteome, reveals ancient connections to signaling, and uncovers a ciliary protein that controls development and human disease.
eTOC Blurb
Cilia are cellular appendages used for motility and intercellular communication. Sigg et al. reconstruct the evolutionary ancestry of cilia through proteomics of sea urchin, sea anemone, and choanoflagellate cilia. One identified ciliary protein, ENKUR, helps pattern the vertebrate left/right body axis. Humans with inherited mutations in ENKUR have situs inversus.
INTRODUCTION
The development of multicellular animals, involving complex cell movements, growth, patterning and differentiation, is orchestrated through intercellular communication. During and after development, some forms of cell-cell communications require cilia (Goetz and Anderson, 2010). Similarly, certain forms of intercellular communication that occur among single-celled organisms, such as mating in the unicellular green alga Chlamydomonas, involve cilia (Pan and Snell, 2000; Solter and Gibor, 1977; Wang et al., 2006). In addition to sensing signals from other cells, cilia in both unicellular protozoa and multicellular animals can sense environmental stimuli such as light and chemical cues such as odors (Bloodgood, 2010; Malicki and Johnson, 2016).
Cilia and the related structures, flagella, are comprised of microtubular cores called axonemes that emanate from basal bodies and are ensheathed by membranes that are compositionally distinct from the contiguous plasma membrane (Carvalho-Santos et al., 2011; Satir and Christensen, 2007). In animals, some types of cilia are motile and others immotile. Vertebrates use non-motile primary cilia for detecting certain environmental stimuli and for intercellular communication, functions that require the localization of specific signal transduction machinery to cilia (Goetz and Anderson, 2010). Mammals use motile cilia and flagella for sperm locomotion and the generation of extracellular fluid flow (Satir and Christensen, 2007).
One critical role for motile cilia in many vertebrate embryos is in the specification of the left-right body axis. In mammals, motile cilia in the node, a cup-shaped structure on the ventral surface of the embryo, beat clockwise to generate a leftward flow that is required for left-right axis patterning (Marszalek et al., 1999; Nonaka et al., 1998; Supp et al., 1999). Motile cilia also clear lungs of mucous and debris, and circulate cerebrospinal fluid (Satir and Christensen, 2007).
Like primary cilia, motile cilia can also transduce signals required for animal development and adult tissue function. For example, cilia on human airway epithelial cells possess G-protein coupled receptors (GPCRs) that increase beat frequency in response to bitter compounds (Bloodgood, 2010; Shah et al., 2009). Cilia may also sense the leftward flow in left-right axis specification (McGrath et al., 2003).
Three signaling pathways associated with cilia are Hedgehog (Hh) signaling, some forms of GPCR signaling, and the activity of select Transient receptor potential (TRP) channels. The connections between cilia and Hh signaling, a critical regulator of embryonic development and adult homeostasis, are perhaps the best characterized, and many of the Hh signal transduction components localize to cilia (Goetz and Anderson, 2010). GPCRs that sense specific neurotransmitters and hormones also localize to neuronal primary cilia, suggesting that they have specific functions there (Hilgendorf et al., 2016). Similarly, TRP channel family members present in cilia regulate local calcium levels to modulate embryonic development (Delling et al., 2013).
Reflecting the diverse roles of cilia, ciliary defects cause a variety of human diseases with a wide range of manifestations, collectively called ciliopathies. Ciliopathy-associated phenotypes include retinal degeneration, polycystic kidney disease (PKD), skeletal malformations, bronchiectasis and left-right axis defects (Hildebrandt et al., 2011).
Because of the deep evolutionary conservation of cilia, the functions of cilia in single-celled organisms provide insights into the functions of animal cilia. For example, proteomic analysis of the Chlamydomonas flagellum and comparative genomics of ciliated and non-ciliated organisms has helped define the ciliary parts list and identify the genetic causes of ciliopathies (Avidor-Reiss et al., 2004; Li et al., 2004; Pazour et al., 2005).
Unlike the extensive conservation of ciliary structural proteins between Chlamydomonas and humans, many ciliary signaling proteins, including most components of the Hh pathway, are not conserved beyond animals (Adamska et al., 2007). We hypothesized that comparisons of the ciliary proteomes of animals and their close relatives would reveal new components of ciliary intercellular signaling pathways and help elucidate how signaling and cilia became associated over animal evolution. To test this hypothesis, we selected three organisms phylogenetically positioned to reveal ancestral ciliary functions at critical steps throughout animal evolution: sea urchins, sea anemones, and choanoflagellates. Sea urchins, early-branching non-chordate deuterostomes with embryonic cilia that are used for motility and Hh signaling (Warner et al., 2013), can provide insights into the signaling pathways associated with cilia before the emergence of chordates. Sea anemones are cnidarians (non-bilaterians) and like sea urchins, possess highly ciliated embryos. Sea anemones can reveal ciliary proteins that were present in early-branching animals, before bilaterians arose. As the closest known relative of animals, choanoflagellates are well positioned to shed light on the evolutionary origin of metazoans. These flagellated protozoa can elucidate ciliary proteins that evolved before the emergence of animals.
We identified ciliary proteins from each of these organisms by isolating their cilia and analyzing them by mass spectrometry. Comparison of the ciliary proteomes, which we refer to as evolutionary proteomics, revealed a core, shared ciliary proteome and helped illuminate the ancestry of ciliary signaling proteins, uncovering ancient links between cilia and GPCR, Hh and TRP channel signaling pathways. Evolutionary proteomics also identified previously uncharacterized, evolutionarily ancient ciliary proteins conserved in mammals, including a protein called ENKURIN (ENKUR). We found that ENKUR is highly conserved among ciliated eukaryotes. ENKUR orthologs from diverse animal species and choanoflagellates localize to cilia, suggesting a conserved ciliary function. Functional characterization of ENKUR revealed that it is expressed in tissues with motile cilia and is required for left-right axis patterning in Xenopus and mice, but is dispensable for ciliary motility in the mouse respiratory tract. Furthermore, mutations in human ENKUR may cause inherited situs inversus, revealing that evolutionary analysis of organellar proteomes can provide insight into the etiology of disease.
RESULTS
Ciliary proteomes of sea urchins, sea anemones and choanoflagellates
To identify ciliary proteins conserved between animals and a close relative of animals, we isolated cilia from the sea urchin Strongylocentrotus purpuratus, the sea anemone Nematostella vectensis, and the choanoflagellate Salpingoeca rosetta (Figure 1A). Sea urchins develop from triploblastic embryos that are covered with motile cilia (Figure 1B). Sea anemones develop from diploblastic embryos and, like sea urchins, have a highly ciliated larval stage. Choanoflagellate cells have a single, apical flagellum (Dayel et al., 2011).
Figure 1. Isolation of cilia from sea urchins, sea anemones and choanoflagellates.
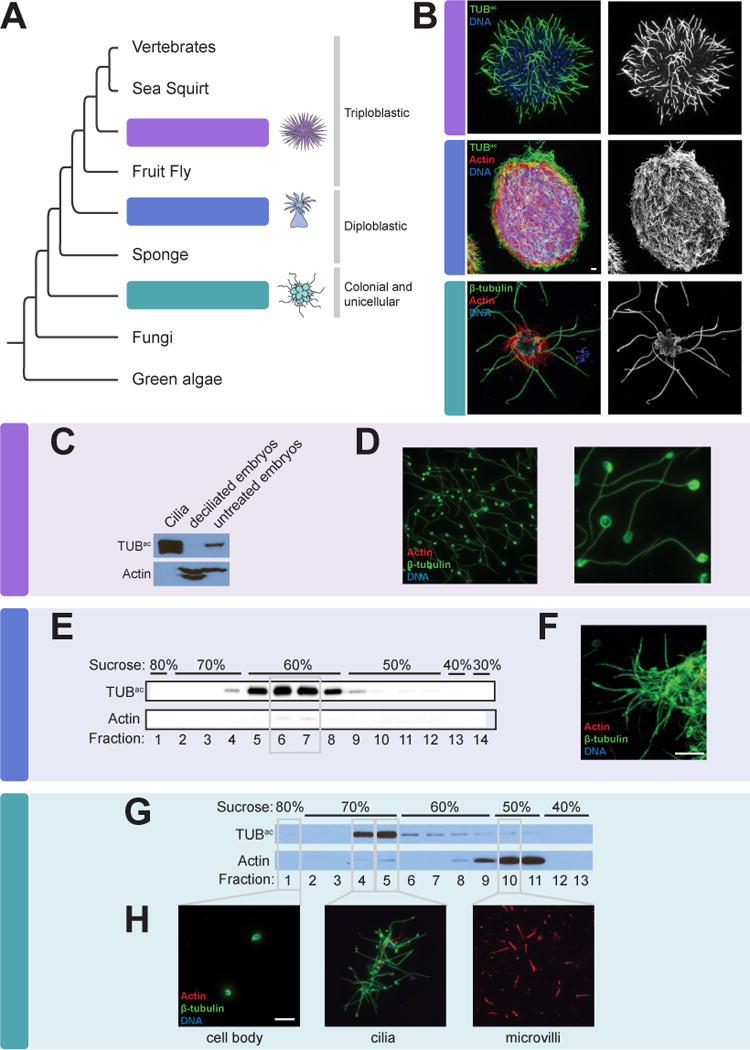
(A) The phylogenetic relationship of the organisms studied in this work to other eukaryotes. (B) Immunofluorescent staining of cilia, marked by β-tubulin or Tubulinac (TUBac) (green), in a sea urchin (Strongylocentrotus purpuratus) gastrula embryo, a sea anemone (Nematostella vectensis) planula larva, and a colony of choanoflagellate cells (Salpingoeca rosetta). Phalloidin staining of the sea anemone larva demonstrates the localization of Actin (red) to the cell bodies. Phalloidin staining of the choanoflagellate colony marks the collar of microvilli that surrounds each flagellum. Nuclei are stained with DAPI (blue). (C) Lysates of isolated S. purpuratus embryonic cilia, deciliated embryos, and intact embryos immunoblotted for TUBac and Actin. Cilia are enriched for TUBac and have undetectable amounts of Actin, whereas deciliated embryos have undetectable amounts of TUBac. (D) Immunostaining of purified S. purpuratus cilia for β-tubulin (green), Actin (red) and nuclei (DAPI, blue) demonstrates that the axonemes of isolated cilia remain intact (β-tubulin) and confirms that no Actin or nuclei are detected in the ciliary fraction. (E) Immunoblot analysis of fractions from the sucrose step gradient purification of isolated N. vectensis cilia reveals that the 60% sucrose fractions contains TUBac, peaking in fractions 6 and 7. (F) Immunostaining of fraction 7 for β-tubulin (green), Actin (red) and nuclei (DAPI, blue) confirms that the sea anemone ciliary fraction is replete with cilia (TUBac) and contains little Actin and no detectable nuclei. (G) Immunoblot analysis of fractions from the sucrose step gradient purification of S. rosetta components reveal that TUBac is enriched in the 70% sucrose step and Actin is enriched in the 50% sucrose step. (H) Immunostaining of fractions for β-tubulin (green), Actin (red) and nuclei (DAPI, blue) confirms that cilia are enriched in the 70% sucrose step, cell bodies identified by DAPI staining are in the 80% sucrose step and microvilli marked by Actin are enriched in the 50% sucrose step. Scale bars, 5 μm for all images. (See Table S1).
For each of these three species, all of which possess mono-ciliated cells, we isolated cilia from developmental stages selected to increase the likelihood of identifying ciliary signaling proteins relevant to development. As sea urchin gastrula stage cilia are required for development (Warner et al., 2013), we used a high salt shock to amputate cilia from gastrula stage sea urchin embryos (Figure 1B) and separate deciliated embryos from the isolated cilia by differential centrifugation (Auclair and Siegel, 1966; Stephens, 1986). This method resulted in efficient separation of whole cilia, including the axoneme and ciliary membrane, from the basal body and the rest of the cell (Stephens, 1995). Immunofluorescent imaging and immunoblot analysis demonstrated that the ciliary fraction was highly enriched for the ciliary components β-Tubulin and acetylated Tubulin (TUBac) and Actin, a non-ciliary protein, was undetectable (Figure 1C and D). To enhance the detection of stage-specific ciliary signaling proteins, we isolated cilia from sea urchin embryos at both early and late gastrulation stages. To enrich for signaling proteins which are often less abundant than structural and motor proteins, we separated the axonemes and their associated proteins from the non-axonemal portion, also called the “membrane plus matrix” fraction (Figure 2A) (Pazour et al., 2005; Witman et al., 1972). SDS-PAGE revealed unique banding patterns for each fraction, indicating successful separation (Figure 2B).
Figure 2. Characterization of the sea urchin ciliome.
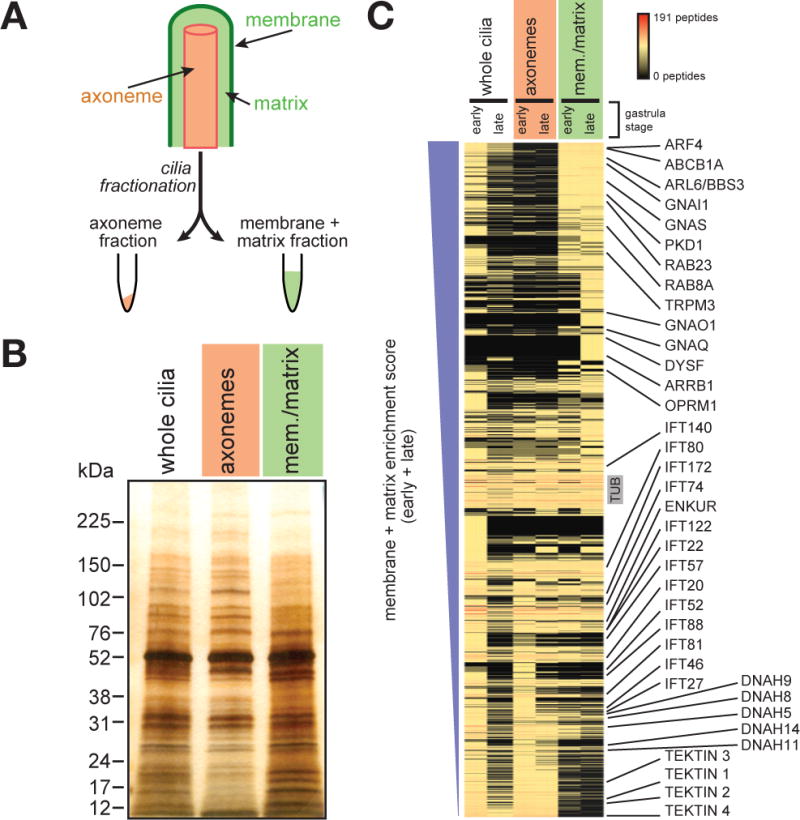
(A) A schematic of ciliary fractionation. Treatment of whole isolated S. purpuratus cilia with detergent followed by centrifugation separates cilia into two fractions, axonemes and membrane + matrix. (B) Silver stain of isolated S. purpuratus whole cilia, axonemes and membrane + matrix (mem./matrix) fractions resolved by SDS-PAGE. The protein banding pattern of the axoneme fraction differs from that of the membrane + matrix fraction. (C) Proteins sorted by their membrane + matrix enrichment score (see Methods). The unique peptide count for each protein is represented in the heat map. Known axonemal proteins (e.g., IFT components, axonemal Dyneins and Tektins) are enriched in the axonemal fraction. Known ciliary membrane and membrane-associated proteins (e.g., PKD1, ARF4, RAB8A) are enriched in the membrane + matrix fraction. (See Table S2).
To isolate sea anemone cilia, we developed a deciliation protocol based on high salt shock. After separating cilia from sea anemone larvae of the planula stage (the stage that follows gastrulation) (Figure 1B), we purified the cilia by sucrose gradient centrifugation and fractionation. Fractions high in TUBac contained little Actin and were comprised of intact cilia (Figure 1E and F).
We discovered that dibucaine, a compound used to isolate flagella from Chlamydomonas and Tetrahymena, caused choanoflagellate cells in rosette colonies to release their flagella (Thompson et al., 1974; Witman, 1986). In Chlamydomonas, diabucaine severs cilia distal to the basal body and transition zone (Sanders and Salisbury, 1994). After amputating flagella from colonial choanoflagellates (Figure 1B), we used sucrose gradient centrifugation and fractionation to separate microvilli and cell bodies from isolated cilia. Again, immunofluorescent imaging and immunoblot analysis revealed that the ciliary fraction was highly enriched for TUBac, whereas the microvilli fraction was enriched for Actin (Figure 1G and H).
To identify the ciliary proteomes of these species, we analyzed the isolated cilia and flagella by mass spectrometry. We performed mass spectrometric protein profiling on unfractionated purified sea urchin cilia (whole cilia), the isolated axonemal fraction (axonemes) and the non-axonemal fraction (membrane plus matrix). Due to the tractability of obtaining large quantities of sea urchin cilia, we were able analyze cilia isolated from three separate embryo cultures at two different developmental stages. We separated the peptides from unfractionated whole cilia using two distinct methods of chromatography: pre-fractionated by hydrophilic interaction chromatography followed by C18 LC-MS/MS or LC-MS/MS using a high resolution C18 column and an extended reverse phase gradient. For the mass spectrometry data analyses, we chose a low-stringency cut-off to capture signaling proteins: proteins with a unique peptide count of 2 or more were included for future analysis (Table S1).
For isolated sea anemone cilia, we analyzed whole cilia from sucrose gradient fractions containing peak levels of TUBac from two individual embryo cultures (Figure 1E, fractions 6 and 7). As with the sea urchin, to further increase the diversity of peptides that we could identify, we separated peptides using the two distinct methods of chromatography described above.
To obtain a sufficient amount of material for mass spectrometry of choanoflagellate cilia, we performed two separate cilia preparations and pooled the samples before analysis. The sample was fractionated by high resolution reverse phase before mass spectrometry. To identify proteins selectively enriched in choanoflagellate flagella, we analyzed fractions containing cell bodies (fraction 1) and microvilli (fraction 10) alongside the ciliary fractions (fractions 4 and 5) (Figure 1G). We defined proteins with a ciliary fraction peptide count higher than that of the cell body and microvilli fraction as candidate members of the choanoflagellate ciliary proteome, or ‘ciliome’.
Metazoan developmental signaling pathways are proposed to have emerged with the advent of multicellularity or with major transitions in animal evolution (Pincus et al., 2008; Pires-daSilva and Sommer, 2003). Many signal transduction components are membrane-associated, suggesting that the membrane plus matrix fraction of sea urchin cilia would be enriched for signal transduction components relative to the axonemal fraction. Therefore, we calculated the degree of membrane plus matrix enrichment for each sea urchin protein by comparing its peptide count in the membrane plus matrix fraction to that of the axonemal fraction (Figure 2C and Table S2).
Comparing the data from the sea urchin whole cilia, axonemes and membrane plus matrix revealed that some proteins identified in ciliary fractions were not detected in the whole cilia data (Figure 2C), suggesting that fractionation increased the sensitivity of peptide detection. Conversely, a small subset of proteins detected in the early gastrula whole cilia fraction were not detected in the ciliary fraction, likely due to enrichment by hydrophilic interaction chromatography. All other sea urchin samples were analyzed exclusively by reverse phase chromatography. As expected, previously identified axonemal proteins (e.g., IFTs, motor proteins, Tektins) were enriched in the axonemal fraction (Figure 2C). Also as expected, previously identified ciliary membrane-associated proteins (e.g., PKD1, BBS3, RAB8A) were enriched in the membrane plus matrix fraction (Figure 2C). Moreover, membrane proteins not previously associated with cilia were enriched in the membrane plus matrix, including Dysferlin (DYSF), ATP-binding cassette, sub-family B (MDR/TAP), member 1A (ABCB1A), Transient receptor potential cation channel subfamily M member 3 (TRPM3).
Definition of a conserved ciliome identifies novel ciliary proteins
From the isolated cilia of three organisms, we identified peptides corresponding to over 3,000 proteins in total (Table 1 and S1). As we are most interested in the evolution of ciliary signaling in the progression from the unicellular ancestors of animals to humans, we focused on those proteins with a homolog in mammals. BLAST identified 1,266 ciliome proteins with a homolog in mouse (Table 1 and S1), a set we termed the ‘conserved ciliome’. As expected based on their evolutionary distances to mammals, the sea urchin ciliome contains the greatest number of mammalian homologs (1,012), followed by the sea anemone (511) and choanoflagellate ciliomes (311), respectively (Table 1, Figure 3A).
Table 1. Mass spectrometry data.
For the cilia of the organisms listed, the number of proteins identified, number of proteins with homologs in mouse, proportion and number of proteins identified in previous studies of ciliary biology, number of proteins associated with human diseases, and number of proteins associated with identified ciliopathies are listed. (See also Table S1, S3 and S4).
| Choanoflagellate | Sea anemone | Sea urchin | Total | |
|---|---|---|---|---|
| number of proteins identified | 464a | 991a | 2,222a | n/a |
| proteins with homolog in mouse | 311 | 511 | 1,012 | 1,266 |
|
| ||||
| Known cilia proteins | ||||
|
| ||||
| SYSCILIA Gold Standard genes | 41% | 55% | 69% | n/a |
| published cilia data sets | 208 | 360 | 644 | 765 |
| disease genes | 67 | 93 | 212 | 241 |
| ciliopathy genes | 36 | 47 | 69 | 73 |
multiple protein isoforms encoded by single genes are present in these data
Figure 3. Defining an evolutionarily conserved ciliome.
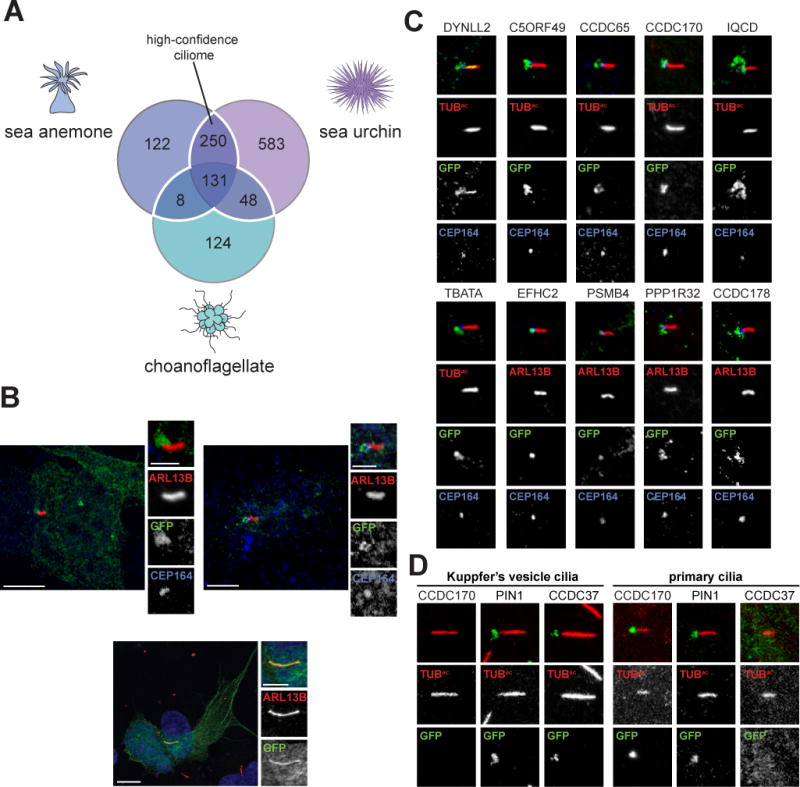
(A) Venn diagram of the overlap of S. purpuratus, N. vectensis and S. rosetta ciliomes. The white line encompasses the high-confidence ciliary proteins present in 2 or more ciliomes. Only proteins that possess a mouse homolog (BLAST E value ≤ 1e-5) are included. (B) Immunofluorescent staining for cilia (ARL13B, red) and candidate proteins fused to GFP (green) expressed in IMCD3 cells. Human C4orf47-GFP localizes to cilia and cytoplasmic microtubules. Fusions of human CSNK1D and CCDC113 with GFP predominantly co-localize with the basal body component CEP164 (blue). For C4orf46-GFP, nuclei are stained with Hoechst (blue). Scale bar for whole cell images, 5 μm. Scale bar for cilia only images, 2.5 μm. (C) Ten GFP-tagged human proteins, out of 49 randomly selected proteins from the high-confidence ciliome, localize to cilia or the ciliary base of IMCD3 cells. Immunofluorescent staining marks GFP-tagged proteins (green), cilia are indicated by ARL13B or TUBac (red), as indicated, and the basal body is highlighted by CEP164 (blue). Scale bar, 2.5 μm. (D) Immunofluorescent staining of human proteins fused to GFP (green) in the D. rerio embryo (somite stage 6–10). Cilia are marked by staining for TUBac (red). Cilia from within the Kuppfer’s vesicle and primary cilia found outside the Kuppfer’s vesicle are depicted. Scale bar, 2.5 μm. (See also Figure S1, S3, Table S3, S4 and S5).
As a first assessment of the ciliome, we compared the ciliary members of the SYSCILIA Gold Standard database, a list of well characterized proteins involved in cilia biology (van Dam et al., 2013), to each organism’s ciliome. Of the SYSCILIA Gold Standard proteins present in cilia, 69% were present in the sea urchin ciliome (Tables 1 and S3). The sea anemone ciliome contained 55% of the SYSCILIA Gold Standard ciliary proteins and the choanoflagellate ciliome contained 41%. Previous ciliary proteomics or genomics studies identified less than half the number of the ciliary SYSCILIA Gold Standard members, suggesting that the ciliomes encompasses a large proportion of ciliary components (Avidor-Reiss et al., 2004; Ishikawa et al., 2012; Li et al., 2004; Mick et al., 2015; Ostrowski et al., 2002; Pazour et al., 2005).
437 mouse homologs were represented in at least two of the ciliomes, providing confidence that they represent bona fide ciliary components (Figure 3A, Table S1 highlighted in blue). To begin to assess whether this ‘high-confidence ciliome’ encompasses evolutionarily conserved ciliary components, we compared it to proteins implicated in ciliary biology by 19 genomic, expression and proteomic studies in diverse unicellular and multicellular ciliated organisms (see Table S4 for list of studies and associated organisms) (Avidor-Reiss et al., 2004; Blacque et al., 2005; Boesger et al., 2009; Broadhead et al., 2006; Cao et al., 2006; Chen et al., 2006; Choksi et al., 2014; Efimenko et al., 2005; Ishikawa et al., 2012; Laurençon et al., 2007; Li et al., 2004; Liu et al., 2007; Mayer et al., 2008; Merchant et al., 2007; Mick et al., 2015; Narita et al., 2012; Ostrowski et al., 2002; Pazour et al., 2005; Smith et al., 2005). 76% of the high-confidence ciliome proteins has been previously implicated in ciliary biology (Table S1).
As the closest known living relative of animals, we hypothesized that choanoflagellate cilia would contain proteins conserved in mammals that are not present in the cilia of protozoa more distantly related to animals. To test this hypothesis, we compared the choanoflagellate ciliome to that of Chlamydomonas reinhardtii, the flagella of which have been well characterized by mass spectrometry (Pazour et al., 2005). We found that out of the 465 proteins in the choanoflagellate ciliome, 267 did not have a homolog in the C. reinhardtii ciliome (Table S3). Of the choanoflagellate ciliome proteins not present in the C. reinhardtii ciliome, over half (157 proteins) had a homolog in the mouse, indicating that these protein are not unique to choanoflagellates and may represent ciliary proteins that emerged after the evolutionary divergence of Chlamydomonas from the lineage that would give rise to animals.
As a final test of whether the ciliomes represent a broad survey of ciliary components, we examined whether ciliopathy-associated proteins were identified in the conserved ciliome. Seventy-four of the conserved ciliome proteins are mutated in a ciliopathy, including 11 proteins associated with Bardet-Biedl-Syndrome (BBS), both proteins associated with autosomal recessive PKD, 13 proteins associated with short rib thoracic dysplasia, and 21 proteins associated with primary ciliary dyskinesia (PCD) (Table S1).
Thus, we hypothesized that high-confidence ciliome constituents not associated with ciliopathies are candidates that may explain the etiologies of orphan ciliopathies. For example, one high-confidence ciliome member, coiled-coil domain containing 63 (CCDC63), was recently identified as being essential for mouse sperm flagella formation, suggesting that it could be a ciliary protein linked to male fertility (Young et al., 2015). Other ciliome constituents may also indicate ciliary etiologies for syndromes not previously recognized as ciliopathies. For example, WD-repeat domain 65 (WDR65, also known as CFAP57), was identified in all three ciliomes and is associated with van der Woude syndrome, a craniofacial malformation with features similar to that of Orofaciodigital syndrome, a recognized ciliopathy (Rorick et al., 2011).
We also assessed whether these ciliomes have predictive power to identify previously undescribed ciliary components. C4orf22 (1700007G11Rik), C9orf116 (1700007K13Rik), C10orf107 (1700040L02Rik), MORN repeat containing 5 (MORN5), IQ motif containing D (IQCD), armadillo repeat containing 3 (ARMC3), UBX domain protein 11 (UBXN11), MYCBP associated protein (MYCBPAP), coiled-coil domain containing 96 (CCDC96), IQ motif and ubiquitin domain containing (IQUB), EF hand calcium binding domain 1 (EFCAB1), DPY30 domain containing 1 (DYDC1) all prominently localize to the multicilia of fallopian tube cells, suggesting that they may be previously unrecognized components of motile cilia (Uhlén et al., 2015). We expressed LAP-tagged versions of select candidates and assessed their localization in IMCD3 cells. C4orf47 (1700029J07Rik), for example, localizes to cytoplasmic microtubules and cilia (Figure 3B). Others, including Coiled-coil domain containing 113 (CCDC113) and Casein kinase 1δ (CSNK1D) localized predominantly to the base of cilia (Figure 3B).
Many proteins in the high-confidence ciliome are known to localize to and function within mammalian cilia, but others, like C4orf47, have not previously been identified as ciliary proteins. To estimate what proportion of proteins in the high-confidence ciliome are bona fide ciliary proteins in mammals, we randomly selected 49 proteins from the high-confidence ciliome and tested if the GFP-tagged human homolog localized to cilia of IMCD3 cells (Table S5). We also tested the localization 30 randomly selected human proteins not identified in the ciliome. As some proteins known to localize along the length of the cilium also accumulate at the ciliary base (e.g. IFT and BBS proteins (Ansley et al., 2003; Deane et al., 2001)), we considered proteins that localize to the base of the cilium as being highly suggestive of ciliary function. Based on the proportion of the human genome encoding known ciliary proteins, we expected that 1–3 of the 30 randomly selected proteins would localized to cilia. Four of these proteins localized to cilia or the ciliary base (Figure S1A), suggesting that the test is specific and that non-ciliary proteins are unlikely to localize cilia in this assay. Of the 49 randomly selected candidate ciliary proteins, 10 localized to the cilium or the ciliary base (Figure 3C and S1B). Included in the 49 proteins were 8 SYSCILIA Gold Standard proteins known to localize to cilia. Of these 8 proteins, only one localized to cilia when overexpressed in IMCD3 cells. The remaining 7 SYSCILIA Gold Standard proteins did not localize to cilia, indicating that the sensitivity of this test is low, and that overexpression assays imperfectly recapitulate the localization of cilia proteins. Alternatively, some human homologs that did not localize to IMCD3 cilia may not have a conserved ciliary function. Based on the proportion of candidate ciliary proteins that localized to cilia and the low sensitivity of the localization assay, greater than 20% of the proteins in the high-confidence ciliome are likely to localize to human cilia.
We hypothesized that some proteins in the ciliome localize specifically to motile cilia, and not to primary cilia. To test this hypothesis, we determined whether proteins that did not localize to IMCD3 primary cilia can localize to the motile cilia of the zebrafish Kupffer’s vesicle. CCDC37 (CFAP100) and PIN1, two proteins that did not localize to primary cilia in IMCD3 cells, localized to motile cilia of the zebrafish embryo (Figure 3D and S1C). Unlike CCDC37, PIN1 localized to some, but not all primary cilia in the zebrafish embryo. Conversely, CCDC170 localized to the base of primary cilia in IMCD3 cells and in the zebrafish embryo, but did not localize to the motile cilia of Kupffer’s vesicle. These data reveal that some proteins localize specifically to either motile or primary cilia.
Comparison of evolutionarily diverse ciliomes identifies signaling proteins
Many ciliary components show a taxonomic distribution consistent with being present in the last common eukaryotic ancestor and lost from organisms that have lost cilia, such as many plants and fungi (Li et al., 2004). To test whether components of the sea urchin, sea anemone and choanoflagellate ciliomes display a taxonomic distribution paralleling the distribution of cilia, we used a computational algorithm, CLustering by Inferred Models of Evolution (CLIME), to map proteins onto a phylogeny that includes prokaryotes and 136 ciliated and unciliated eukaryotes (Li et al., 2014). 15% of ciliome components displayed a taxonomic distribution closely mirroring the presence of cilia (Figure 4A, S2 and Table S6). In addition to many recognized ciliary components, such as IFT and BBSome, high-confidence ciliome components, such as ENKUR, TRPM3, Zinc finger MYND-type containing 12 (ZMYND12) and Sperm tail PG rich repeat containing 2 (STPG2) showed distributions consistent with co-evolving with cilia. The presence of these genes in the genomes of diverse ciliated eukaryotes suggests that they may have evolutionarily ancient functions in cilia.
Figure 4. The distribution of signal transduction components detected in ciliomes.
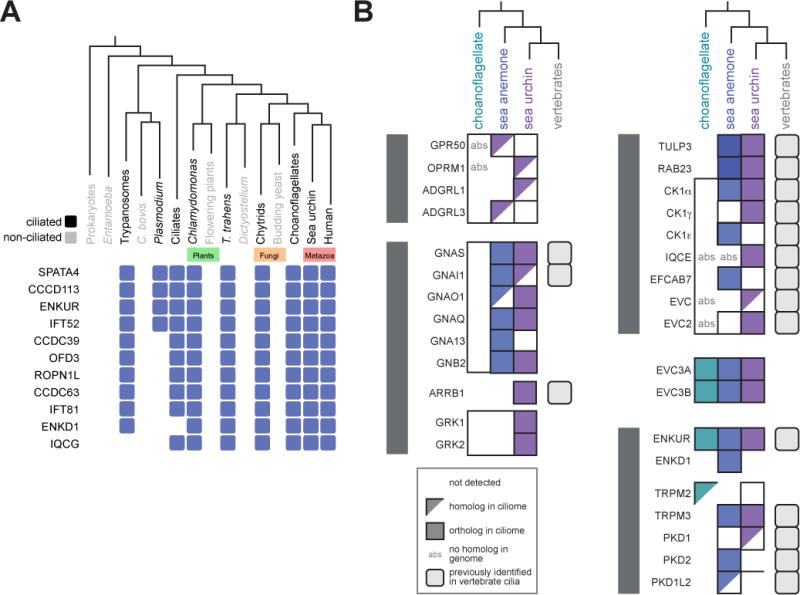
(A) Select ciliome proteins display a phylogenetic profile closely reflecting the distribution of cilia as based on CLIME analysis. Ciliated organisms are shown in black and non-ciliated organisms are shown in grey. A blue box indicates that a homolog is present in the organism or group of organisms represented in the phylogeny. For the complete list of ciliome proteins with distributions overlapping with ciliation within a phylogeny of 136 organisms, see Figure S2. For clades represented by more than one organism (i.e. Choanoflagellates, Budding yeast, Chytrids, Flowering plants, Ciliates, Plasmodium, Trypanosomes, Entamoeba and Prokaryotes) a protein was considered to be present in the clade if one or more organisms possessed the protein. (B) The ciliome of each organism contains diverse signal transduction components, most of which have homologs in vertebrates and some of which have not been previously associated with cilia. Proteins were considered orthologs if they were reciprocal best BLAST hits. The top BLAST hit in M. musculus was considered a homolog of the S. purpuratus, N. vectensis and S. rosetta query protein if the two proteins were not reciprocal BLAST matches (E value ≤ 1e-5). (See also Figure S2 and Table S6).
To trace the ancestry of known ciliary signaling pathways, we also examined whether previously identified components of these pathways were present in the sea urchin, sea anemone and choanoflagellate ciliomes. Choanoflagellate genomes do not contain genes for most Hh pathway components, suggesting that they do not use Hh signaling for intercellular communication (King et al., 2008). Analysis of whether ciliary Hh pathway components were present in the sea urchin and sea anemone ciliomes revealed that, although canonical Hh pathway proteins such Patched1, Smoothened, and the GLIs were not detected, both positive regulators of ciliary Hh signaling, such as Casein Kinase 1 isoform γ (CK1γ) (Li et al., 2016) and negative regulators of ciliary Hh signaling, such as TULP3 (Chávez et al., 2015; Garcia-Gonzalo et al., 2015; Li et al., 2016; Mukhopadhyay et al., 2013) were detected (Figure 4B). Similarly, we detected Ellis van Creveld protein 2 (EVC2) and a homolog of EVC in the sea urchin ciliome. In mammals, EVC and EVC2 localize to the proximal cilium and act as tissue-specific positive regulators of the Hh pathway (Caparrós-Martín et al., 2013; Dorn et al., 2012; Yang et al., 2012). Mutations in the genes that encode these proteins cause Ellis–van Creveld syndrome and Weyers acrofacial dysostosis, ciliopathies characterized by skeletal and craniofacial defects and polydactyly (Ruiz-Perez et al., 2000; Ye et al., 2006). Two EVC and EVC2 interacting proteins, IQ domain-containing protein E (IQCE) and EF-hand calcium binding domain-containing protein 7 (EFCAB7), regulate Hh signaling by anchoring EVC and EVC2 to the proximal cilium (Pusapati et al., 2014). IQCE was present in the sea urchin ciliome and EFCAB7 was present in the sea anemone ciliome.
In addition to EVC and EVC2, we identified two paralogs, EVC3.1 and EVC3.2 (Pusapati et al., 2014), in the choanoflagellate, sea anenome and sea urchin ciliomes (Figure 4B). The presence of EVC3 in the ciliomes suggests that the association between cilia and the EVC family extends beyond metazoans to early-branching eukaryotes. As EVC3.1 and EVC3.2 are missing from the genomes of some mammals, including humans, it appears that, whereas mammals have preserved much of the ciliary repertoire of basal organisms, some have selectively lost at least two ciliary proteins.
Several of the largest class of receptors, GPCRs, localize to cilia. For example, odorant receptors act at olfactory epithelia cilia (Goetz and Anderson, 2010). We identified four GPCRs that have mouse homologs, none of which have been previously reported in cilia (Figure 4B). Other members of the GPCR signaling pathway, including G proteins, Arrestins and GPCR kinases (GRKs), were identified in both the sea urchin and sea anemone ciliomes, suggesting that not just GPCRs, but GPCR signal transduction has an ancient evolutionary connection to cilia that precedes the advent of bilateria.
To assess whether some of the identified GPCR signaling proteins can localize to mammalian cilia, we expressed a GFP-tagged version of a sea urchin homolog of Opioid receptor μ1 (OPRM1) that we named OPRM1L in RPE-1 cells and found that it localized to cilia (Figure S3A). The GPCR signal transduction component β-Arrestin-1/2 can localize to one end of cilia (Pal et al., 2016). As β-Arrestin-1 (ARRB1) was detected in the sea urchin ciliome, we also examined the localization of sea urchin ARRB1-GFP in RPE-1 cells and found that, like the mammalian ortholog, it was enriched at one ciliary end (Figure S3B).
Unlike Hh and GPCR signaling proteins, TRP channels and TRP channel-associated protein were detected in all three ciliomes (Figure 4B). PKD family members, previously known to localize to cilia, were present in sea anemone and sea urchin cilia, as was TRPM3, a channel that has multiple proposed functions, including heat sensation (Held et al., 2015). A homolog of TRPM2 was identified in the choanoflagellate cilia, suggesting that the association of TRP channels with cilia arose before the emergence of animals. Also, Enkurin (ENKUR), a TRP channel interacting protein (Sutton et al., 2004), was detected in the ciliomes of all three organisms and the Enkurin domain-containing protein, ENKD1, was detected in the sea anemone ciliome. ENKUR was originally identified as a TRP channel interactor expressed by sperm (Sutton et al., 2004). The identification of ENKUR orthologs in choanoflagellate, sea anemone and sea urchin ciliomes suggests a conserved ciliary function. As evolutionary conservation is associated with increased likelihood of affecting fitness and disease (Hirsh and Fraser, 2001; Wan et al., 2015), we hypothesized that ENKUR may have important biological functions in animals.
ENKUR is a ciliary protein critical for left-right axis specification in Xenopus and mice
From the analysis of cilia of diverse organisms, we sought to uncover conserved proteins whose functions in ciliary biology had been unappreciated. As mammalian ENKUR has been detected at the sperm flagellum (Sutton et al., 2004), we wondered if ENKUR had functions in cilia and if those functions were conserved in earlier branching animals. In addition to identifying ENKUR in the ciliomes of choanoflagellates, sea anemones and sea urchins we found Enkur in the genome of diverse ciliated eukaryotes suggesting that it may have an evolutionarily ancient function in cilia (Figure S4).
To determine where in the invertebrate embryo Enkur is expressed we used in situ hybridization to identify Enkur expression in sea anemone and sea urchin embryos throughout gastrulation. In sea anemone embryos, early in gastrulation, Enkur was expressed in most cells, with higher expression in a subset of cells distributed throughout the embryo (Figure 5A and S5A). Midway through gastrulation and into the late gastrula stage, Enkur expression was maintained in the ectoderm and became enriched at the aboral end of the sea anemone embryo, coincident with the apical organ, a group of cells that bear long cilia (termed the “ciliary tuft”) and is hypothesized to have sensory function (Rentzsch et al., 2008).
Figure 5. ENKUR is a conserved ciliary protein expressed by cells with motile cilia.
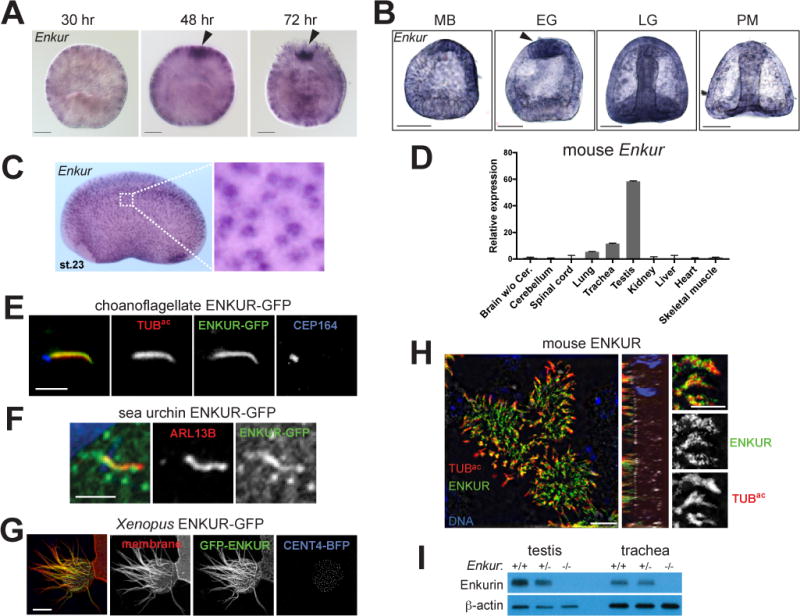
(A) Whole mount in situ hybridization for Enkur in N. vectensis embryos at various developmental stages. Enkur is expressed throughout the embryo and is enriched at the aboral pole (arrowhead) in 48 and 74 hour embryos. Scale bar, 50 μm. (B) In situ hybridization for Enkur in S. purpuratus embryos at mesenchyme blastula (MB), early gastrula (EG), late gastrula (LG) and prism (PM) stages. Scale bar, 50 μm. Enkur is expressed in all cells and enriched at the apical pole in EG embryos. (C) In situ hybridization of stage 23 X. laveis embryo shows expression of Enkur in epidermal cells. (D) qRT-PCR measurement of Enkur expression in isolated adult mouse lungs, trachea and testis. Error bars represent SDs from 6 technical replicates. Expression was validated using 2 distinct primer pairs. (E) Immunofluorescent staining of S. rosetta ENKUR fused to GFP (green), cilia (TUBac, red) and the basal body (CEP164, blue) expressed in IMCD3 cells. Scale bar, 2.5 μm. (F) Immunofluorescent staining of cilia (ARL13B, red) and a fusion of S. purpuratus ENKUR with GFP (green) expressed in RPE-1 cells. ENKUR-GFP localizes to cilia. Nuclei are stained with Hoechst (blue). Scale bar, 2.5 μm. (G) A multi-ciliated epidermal cell of a stage 23 X. laevis embryo expressing X. laevis ENKUR fused to GFP (green), membrane-red fluorescent protein (red), marking the plasma and ciliary membranes, and Centrin 4 (CENT4)-blue fluorescent protein (BFP, blue) to mark the basal bodies. ENKUR localizes along the length of cilia. Scale bar, 10 μm. (H) Immunofluorescent staining of primary cultured mouse tracheal epithelial cells for ENKUR (green), cilia (TUBac, red), and the basal body (CEP164, white), and imaged using structured illumination microscopy. ENKUR localizes to mouse tracheal epithelial cilia. Scale bar for whole cells (top and center panels), 5 μm. Scale bar for cilia (bottom panel), 2.5 μm. (I) Immunoblotting for ENKUR protein in testis and trachea lysates from littermate control and Enkur−/− mice. ENKUR is expressed in testis and trachea, whereas Enkur−/− mice do not produce detectable ENKUR. (See also Figure S4 and S5).
In the sea urchin embryo, Enkur is expressed in all cells from the mesenchyme blastula stage, throughout gastrulation and into the prism stage, with peak expression during gastrulation. Strikingly, in early gastrulation, Enkur expression is enriched at the apical end of the embryo where the ciliary tuft is located (Figure 5B and S5B). The expression pattern of Enkur in sea urchin and sea anemone embryos suggests a conserved function for ENKUR in the ciliary tuft that extends from early-branching eumazoans (all animals except sponges and placozoans) to dueterostomes.
To determine if, as in the sea urchin and sea anemone, Enkur is expressed in motile ciliated cells in vertebrate embryos, we used in situ hybridization to examine its expression in Xenopus laevis embryos. We found that Enkur is expressed in motile ciliated cells distributed throughout the epidermis (Figure 5C). In mouse, we confirmed by quantitative PCR that Enkur is expressed exclusively in mouse tissues that possess motile cilia, such as the testes and trachea (Figure 5D and (Sutton et al., 2004)).
To begin to assess the subcellular localization of sea urchin, sea anemone and choanoflagellate ENKUR, we GFP-tagged ENKUR and analyzed its localization in ciliated mammalian cells. We found that GFP-tagged sea urchin and choanoflagellate ENKUR proteins localized to cilia if expressed in mammalian cells (Figure 5E and F). To determine if ENKUR localizes to cilia in vertebrates, we expressed GFP-ENKUR in X. laevis embryos and found that it localized to the epidermal cell motile cilia (Figure 5G). Similarly, mouse ENKUR localized to the motile cilia of tracheal epithelial cells (Figure 5H and S5C) and the mammalian ortholog of an ENKUR-related protein, ENKD1, localized predominantly to the base of cilia (Figure S5D). To further analyze ENKUR expression in the mouse, we utilized Enkur−/− mice. Western blot corroborated the ENKUR immunofluorescent staining, indicating that the protein is expressed in trachea, and is absent from the trachea of Enkur−/− mice (Figure 5I).
In mammals, specification of the left-right axis requires both ciliary motility and PKD2-dependent ciliary signaling (McGrath et al., 2003; Nonaka et al., 1998; Pennekamp et al., 2002; Yoshiba et al., 2012). PKD2, a member of the TRP family of ion channel proteins, forms a ciliary complex with PKD1. A homologs of PKD1 was detected in the ciliome of sea urchin and an ortholog of PKD2 was detected in the ciliome of sea anenomes (Figure 4B). The localization of ENKUR to motile ciliated cells of diverse organisms, as well as its connection to TRP channels, led us to hypothesize that it might play a role in left-right axis patterning. In Xenopus, left-right patterning requires leftward flow generated by motile cilia on the gastrocoel roof plate (GRP) to induce genes such as Pitx2c specifically in the left lateral plate mesoderm (Schweickert et al., 2010). In situ hybridization revealed that Enkur expression is restricted to the GRP in stage 17 embryos and ENKUR-GFP localized to the cilia of GRP cells (Figure 6A and B).
Figure 6. ENKUR is required for left-right axis patterning in mice.
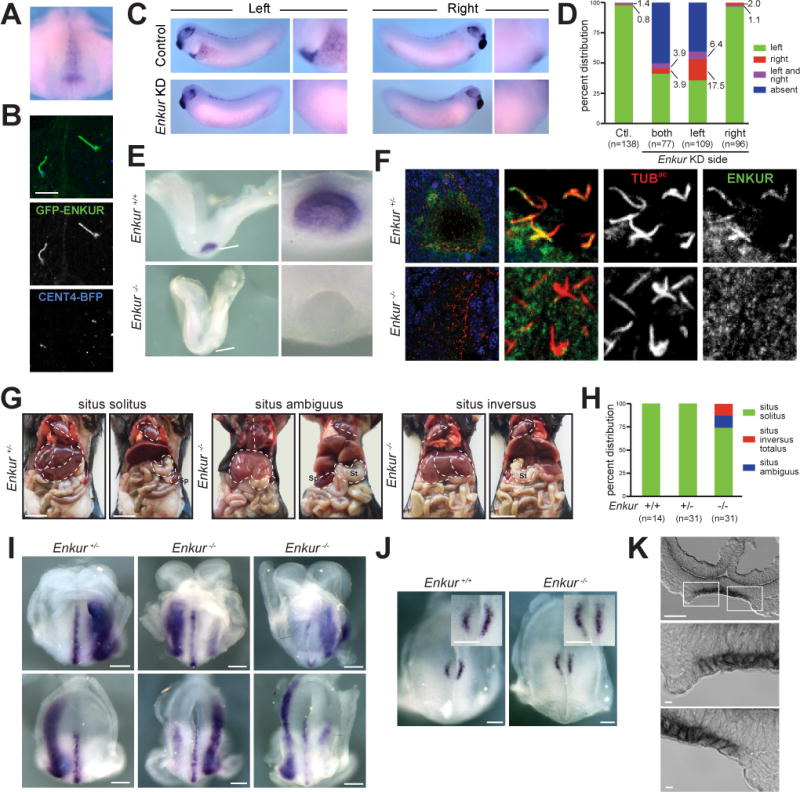
(A) Whole mount in situ hybridization of a stage 17 X. laevis embryo for Enkur. Ventral view of dorsal resection of embryo. Only the posterior region of the embryo is shown. Enkur is expressed in the gastrocoel roof plate (GRP). (B) Fluorescence imaging of X. laevis GRP cilia expressing GFP-ENKUR (green) and CENT4-BFP (blue). CENT4-BFP marks basal bodies. Scale bar, 5 μm. (C) In situ hybridization for Pitx2c of a stage 28 X. laevis control embryo and an Enkur knockdown (KD) embryo. Pitx2c is expressed in the left lateral plate (arrowhead and high magnification image) of control embryos but is absent in the Enkur KD embryo. (D) Quantification of Pitx2c expression patterns in control and Enkur KD embryos. (E) In situ hybridization of 2–4 somite stage littermate control and Enkur−/− mouse embryos for Enkur. At this stage, Enkur is expressed exclusively in the node. Enkur−/− embryos do not express detectable Enkur. Scale bar for left panel, 50μm. Scale bar for right panel, 25 μm. (F) Immunofluorescence staining of 2–4 somite stage mouse embryos for ENKUR (green) and cilia (TUBac, red). ENKUR localizes to the cilia of the node and is not detectable in the cilia of Enkur−/− nodes. Nuclei are stained with Hoechst (blue). Scale bar for left panels, 10 μm. Scale bar for right 6 panels, 2.5 μm. (G) Photographs of thoracic and abdominal organ positions. The right (R) and left (L) side of the body are indicated. Some Enkur−/− mice display situs ambiguus, illustrated here by abnormal heart apex orientation, midline liver and right-sided spleen. Some Enkur−/− mice display situs inversus, a complete reversal of the left-right axis. Scale bar, 1 cm. (H) Quantification of situs in littermate control and Enkur−/− mice. (I) In situ hybridization of 3–5 somite stage littermate control and Enkur−/− embryos for Lefty2. Upper panels are rostral views. Lower panels are caudal views. The right (R) and left (L) side of the embryo are indicated. Control embryos exhibit Lefty2 expression in the midline and left lateral plate mesoderm. Enkur−/− embryos exhibit variable patterns of Lefty2 expression, including expression predominantly in the right lateral plate mesoderm (middle) or partially in the right lateral plate mesoderm (right). Scale bar, 50 μm. (J) In situ hybridization of 3–5 somite stage littermate control and Enkur−/− embryos for Cerl2. The right (R) and left (L) side of the embryo are indicated. Control embryos display an enrichment of Cerl2 expression on the right side of the node. Enkur−/− embryos express equal levels of Cerl2 on both sides of the node. Scale bar, 100 μm. (K) Cryosectioned in situ hybridization of 2–4 somite stage mouse embryo for Enkur. Top panel depicts the entire node and lower two panels depict areas indicated by white boxes. Enkur is expressed predominantly within the pit cells (pc) and not the crown cells (cc) of the node. Scale bar top panel, 50 μm. Scale bar bottom two panels, 5 μm. (See also Figure S5 and Movie S2).
To determine if ENKUR function is required for establishing the left-right axis, we inhibited Enkur expression using a morpholino (Figure S5G). Whereas 98% of control embryos displayed Pitx2c in the left lateral plate mesoderm, Pitx2c expression was absent in 51% of Enkur morphants and bilateral or on the right side in 8% of morphants, suggesting that ENKUR is required for left-right axis patterning in X. laevis (Figure 6C and D). Co-injection of a Enkur-GFP mRNA with the morpholino restored of Pitx2c expression on the left side in 90% of embryos (Figure S5H), indicating that the morpholino specifically targets Enkur. Inhibiting Enkur expression did not affect ciliation of GRP cells, indicating that ENKUR does not participate in left-right axis patterning through promoting ciliogenesis (Figure S5I).
In Xenopus, expression of some cilia motility and Nodal pathway members is required on one side of the embryo but is dispensable on the other (Schweickert et al., 2010; Vick et al., 2009). To determine if ENKUR is required unilaterally, we inhibited Enkur on either the right or left side of X. laevis embryos. Similar to embryos with bilateral Enkur knockdown, 60% of embryos with inhibition of Enkur expression specifically on the left side displayed abnormal Pitx2c expression. Strikingly, embryos with inhibition of Enkur expression on the right side were indistinguishable from the controls, indicating that ENKUR is required on the left, but not the right side of the GRP for Xenopus left-right axis patterning. (Figure 6D and S5J).
The left-right axis defect in Enkur morphant Xenopus led us to investigate if the requirement for ENKUR in left-right patterning was conserved in mammals. We examined the developmental expression of mouse Enkur by situ hybridization, which revealed that, similar to X. laevis, 2–4 somite stage mouse embryos express Enkur exclusively in the node (Figure 6E and S5K). Immunofluorescent staining indicated that, again like X. laevis, ENKUR localizes to nodal cilia, suggesting that mouse ENKUR may function in mouse left-right patterning (Figure 6F).
We analyzed visceral organ placement in adult Enkur−/− mice and found that 26% displayed abnormal situs (Figure 6G and H). Half of the affected mice had situs inversus totalis, a complete reversal of the left-right axis, and half displayed situs ambiguus, a variably abnormal positioning of organs that includes misorientation of the heart, right-sided stomach or spleen, asplenia, left-sided liver, and abnormal hepatic lobulation. Embryos that lack nodal cilia or have non-motile nodal cilia exhibit a higher incidence of abnormal situs than do Enkur−/− embryos (Nonaka et al., 1998; Takeda et al., 1999). The presence of left-right axis defects in a minority of Enkur−/− mice indicates that axis specification is not entirely randomized in the absence of ENKUR function.
An early event in left-right axis specification is the generation of leftward flow by nodal cilia which activates Nodal signaling specifically in the left lateral plate mesoderm (Collignon et al., 1996; Lowe et al., 1996; Saijoh et al., 2003). To determine if ENKUR participates in this step in left-right axis patterning, we examined the expression of Lefty2, a Nodal target gene (Meno et al., 1996). In situ hybridization revealed that in Enkur−/− embryos, Lefty2 expression in the lateral plate mesoderm was bilateral, and variably enriched on the left or right side (Figure 6I), indicating that ENKUR functions in an early step in left-right axis specification.
To test if ENKUR is acting upstream of the Nodal signaling pathway in left-right axis patterning, we analyzed the expression of Cerberus like-2 (Cerl2), a secreted protein that antagonizes Nodal (Marques, 2004). In response to nodal fluid flow, Cerl2 is downregulated on the left side of the node (Nakamura et al., 2012). In contrast to littermate control embryos, Enkur−/− embryos displayed equal, bilateral expression of Cerl2, suggesting that ENKUR may be acting before Nodal signaling is activated, perhaps by generating or sensing leftward nodal flow (Figure 6J).
One model of nodal flow sensation contends that there are two types of monocilia present at the node: motile cilia of nodal pit cells generate flow and crown cell cilia on the periphery of the node detect the flow to distinguish left from right (Babu and Roy, 2013; McGrath et al., 2003). To investigate whether Enkur is expressed in one or both types of nodal cells, we examined Enkur expression in sectioned 2–4 somite stage embryos. Enkur was expressed by nodal pit cells but absent or only weakly expressed by crown cells (Figure 6K). The predominant expression of Enkur by pit cells suggests that ENKUR may contribute to leftward flow.
Mutation of human ENKUR affects left-right axis specification
A hallmark of human ciliopathies affecting nodal cilia is situs inversus (Afzelius, 1976). We identified a consanguineous Azerbijaini kindred with two progeny that display situs inversus totalis (Figure 7A and B, S5L). Notably, neither affected individual exhibited recurrent airway infections or bronchiectasis, hallmarks of primary ciliary dyskinesia (PCD). Homozygosity mapping of the mother (OP-1605 I2) and one affected individual (OP-1605 II3) identified a short segment of homozygosity by descent on chromosome 10 containing ENKUR (Figure 7C). Whole exome sequencing of one affected sibling (OP-1605 II3) excluded previously identified mutations in all genes causative for PCD and heterotaxia but identified a homozygous variant, c.224-1delG, that alters the splice acceptor site of the second ENKUR intron (Figure 7D, Table S7). Sanger sequencing confirmed that this variant co-segregated with the phenotype and showed a recessive pattern of inheritance in the kindred (Figure 7E). Together, these data suggest that homozygous mutations in ENKUR are a cause of situs inversus in humans.
Figure 7. An inherited human ENKUR mutation causes situs inversus.
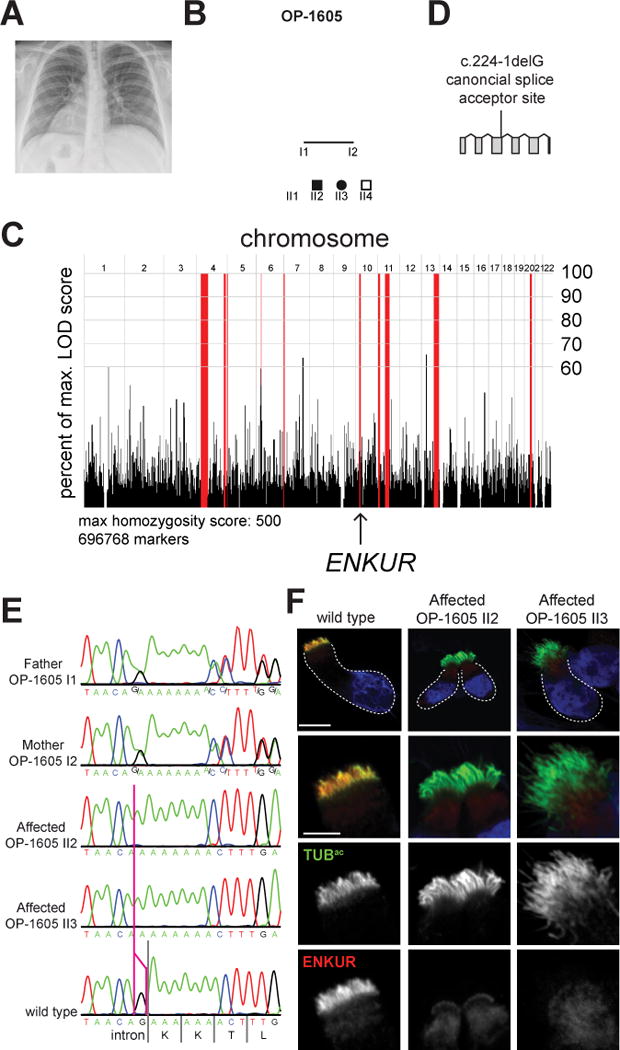
(A) A chest X-ray of OP-1605 II3. The heart is indicated with an “H”, revealing dextrocardia. The right (R) and left (L) side of the body are indicated. (B) Pedigree of family OP-1605. Third degree consanguineous individuals are the parents of 2 siblings, individuals II2 and II3, affected with situs inversus. (C) Homozygosity mapping of the mother (OP-1605 I2) and one affected individual (OP 1605-II3) identified a short homozygous region on chromosome 10 containing ENKUR. (D) Schematic of the human ENKUR gene. The identified 1 bp deletion, c.224-1delG, occurs in the splice acceptor of the second intron. (E) Sanger sequence chromatograms of the ENKUR intron-exon boundary of the two affected individuals, their parents and an unrelated wild type individual. The pink line identifies the position of the last nucleotide of ENKUR intron 2 affected by the deletion. Both affected individuals are homozygous for c.2241-delG. Both parents are heterozygous for the mutation. (F) Immunofluorescence imaging of nasal epithelial cells from an unaffected control and two affected individuals for ENKUR (red) and cilia (TUBac, green). Nuclei are stained with DAPI (blue). ENKUR localizes to cilia of control cells, and is missing from the cilia of affected individuals. The dotted line highlights the cell border. Scale bar for whole cells (top panel), 10 μm. Scale bar for cilia (bottom 3 panels), 5 μm. (See also Figure S5, S6, S7, Table S7, S8 and Movie S1).
To assess the effect of the homozygous mutation on ENKUR, we examined the motile cilia of nasal epithelial cells isolated from the respiratory tracts of both affected individuals and an unaffected control. We found that human ENKUR localizes to nasal epithelial cilia (Figure 7F). In contrast, neither individual with situs inversus exhibited ciliary localization of ENKUR (Figure 7F), suggesting that the human mutation abrogates ENKUR expression.
To determine whether ENKUR affects the localization of other ciliary proteins associated with situs inversus, we analyzed their localization in human nasal epithelia cells of an ENKUR mutant individual. Outer dynein arm (ODA) complex components DNAH5 and DNAH11, the ODA-docking complex component CCDC151, the inner dynein arm component DNALI1, the nexin-dynein regulatory complex component GAS8, the axonemal components CCDC11 and CCDC39, and the radial spoke component RSPH9 (Dougherty et al., 2016; Fliegauf et al., 2005; Hjeij et al., 2014; Kastury et al., 1997; LeDizet and Piperno, 1995; Merveille et al., 2011; Olbrich et al., 2015) all localized equivalently to the cilia of wild type control and homozygous ENKUR mutant cells (Figure S6). Likewise, ENKUR localized normally in human nasal epithelial cells from PCD-affected individuals with mutations in CCDC40, CCDC11 or DNAAF2 (Becker-Heck et al., 2011; Omran et al., 2008a) (Figure S7). Thus, ENKUR and several proteins associated with situs inversus are mutually dispensable for each other’s localization to cilia.
As neither homozygous ENKUR mutant individual exhibited the respiratory manifestations of PCD, we analyzed the motility of their nasal epithelial cell cilia. The cilia of both individuals with situs inversus displayed coordinated, wavelike beating, comparable to those of unaffected control individuals (Supplemental movie S1). The ciliary beat frequencies of the affected individuals were 5.7±3.8 Hz and 5.6±1.3 Hz, within the normal range (Raidt et al., 2014) (Table S8). Whereas individuals with disrupted ciliary motility produce reduced levels of nasal nitric oxide (Lundberg et al., 1994), the nasal nitric oxide production rates of the two individuals with situs inversus were 155 ml/min and 234 ml/min, exceeding the 77 ml/min production rate below which is consistent with PCD (Table S8). According to these measures, the respiratory ciliary function of both individuals with homozygous ENKUR mutations was normal.
To determine if, like humans, ENKUR is dispensable for ciliary motility in the respiratory tract of mice, we analyzed airway cilia of Enkur−/− mice. We analyzed the beating of cilia on tracheal epithelial cells of Enkur−/− mice and discovered that, like humans, the motility of mutant cilia was not distinguishable from wild type (Supplemental movie S2).
Together, these data demonstrate that ENKUR is a highly conserved ciliary protein that is not required for ciliary motility in the airway, but that is required for left-right axis determination in Xenopus and mice. Furthermore, when mutated, Enkur may be a cause of situs inverus in humans.
DISCUSSION
Communication of environmental or intercellular information is a critical function of the cilia of organisms from diverse phyla throughout Eukarya. In vertebrates, the signaling functions of cilia are especially important for sight, olfaction and development. At what points in animal evolution did different signaling pathways become associated with cilia? Whereas the structural proteins that make up cilia are conserved among most ciliated Eukaryotes, including humans, few metazoan signaling proteins are conserved outside of the animal kingdom. Therefore, we identified ciliary proteins from organisms representing major steps in animal evolution: choanoflagellates, whose phylogenetic position informs the origin of multicellular animals, sea anemones, radially symmetric sister group to bilaterally symmetric animals, and sea urchins, basal Deuterostomes that provide insights into the ancestor of chordates.
The ciliomes indicate that proteins involved in GPCR and Hh signaling were associated with cilia before bilateria arose and TRP channels were associated with cilia before the emergence of animals. Many of the identified proteins with homologs in mammals, the conserved ciliome, had a phylogenetic distribution paralleling the presence of cilia: present in ciliated organism of the Animal, Plant, Fungi and Protist kingdoms but lost from unciliated organisms within these groups. These ciliary proteins are therefore likely to have been present in the last common ancestor of all extant eukaryotes, a ciliated organism.
One protein that we identified in the ciliomes of choanoflagellates, sea anenomes and sea urchins, suggesting that it became associated with ciliary function before the emergence of animals, was ENKUR, a highly conserved protein found in diverse ciliated eukaryotes. We found that Enkur is expressed in tissues with motile ciliated cells, including those with single cilia (i.e., Xenopus and mouse nodal cells, sea anemone and sea urchin embryonic epithelial cells) and those with multiple cilia (i.e., mouse tracheal epithelial cells, Xenopus embryonic epidermal cells). In addition, ENKUR from animals and choanoflagellates localizes to cilia, raising the possibility that it acts within cilia to generate or respond to fluid flow. Mutation of Enkur in the mouse did not compromise ciliary beat frequency in tracheal epithelial cells, indicating that, unlike many ciliary proteins with expression patterns and phylogenetic distributions similar to ENKUR (e.g., outer arm dyneins), it is not essential for ciliary motility. Instead, ENKUR is required for patterning of the left-right axis in both Xenopus and mouse, suggesting that it is required for some aspect of ciliary beating or signaling in the embryonic node. Significantly, humans with a homozygous mutation in ENKUR displayed inversion of their left-right axis, but no signs of defective mucociliary clearance, suggesting that human ENKUR loss of function does not cause PCD, but may be a cause situs inversus.
ENKUR has previously been shown to interact with TRP channels and calcium signaling proteins, suggesting that it may bridge the gap between TRP channels and downstream signaling components (Sutton et al., 2004). Calcium signaling and the ciliary TRP channel PKD2 have been implicated in left-right axis patterning, although their exact roles remain unclear (McGrath et al., 2003; Pennekamp et al., 2002; Yoshiba et al., 2012). In the sea urchin, PKD2 is expressed at the tip of the archenteron (Tisler et al., 2016), where we find Enkur to also be expressed. The archenteron tip possesses motile cilia that beat rotationally, similar to cilia of the node, although how cilia in sea urchin left-right axis patterning function remains a subject of investigation (Tisler et al., 2016; Warner et al., 2016). PKD2 has also been shown to be expressed in the ciliary tuft of sea urchin embryos, a structure hypothesized to have sensory function (Tisler et al., 2016). We found that, like PKD2, Enkur mRNA is enriched in the cells of both the sea urchin and sea anemone ciliary tuft. It will be of great interest to assess whether ENKUR regulates or interprets calcium responses in nodal, archenteron or tuft cilia.
In addition to ENKUR, we identified 130 other proteins in the ciliomes of all three organisms examined here. As expected, these proteins included many recognized to have evolutionarily ancient ciliary roles, including structural components (e.g., Tektin-1, β-Tubulin), intraflagellar transport (e.g., IFT57, IFT80, IFT81, IFT122, IFT172) and ciliary movement (e.g., axonemal dyneins, Nexin-Dynein regulatory complex components, radial spoke proteins, SPAG17, HYDIN). Other highly conserved ciliary proteins, such as components of the transition zone and basal body, were not detected as our methods amputated cilia distal to the basal bodies and transition zones (Sanders and Salisbury, 1994; Stephens, 1995). Similarly, we did not detect ciliopathy-associated proteins that are not ciliary components, such as those PCD-associated proteins that function within the cytoplasm to assembly dynein arms (Kott et al., 2012; Loges et al., 2009; Mitchison et al., 2012; Omran et al., 2008b). Like ENKUR, we predict that many of the uncharacterized or poorly characterized proteins present in the ciliomes of all three organisms (e.g., C9orf116, C4orf22, C10orf107, C5orf49) will localize to cilia and have ciliary functions.
The sea anemone and sea urchin ciliomes share 250 proteins not identified in the choanoflagellate ciliome. Some of these proteins, such as EVC2, have functions associated with Hh signaling, a pathway present in many multicellular animals including sea anemones and sea urchins but absent, at least in its canonical form, from choanoflagellates (Adamska et al., 2007). EVC2 is part of a complex comprised of four proteins, EVC, EVC2, IQCE and EFCAB7, each of which were detected in at least one ciliome (Pusapati et al., 2014). Orthologs of the genes encoding these proteins are not present in the choanoflagellate genome, suggesting that they emerged during animal evolution in parallel with the development of ciliary Hh signaling.
In addition to EVC and EVC2, we identified a structurally related protein called EVC3 in the ciliomes of sea urchins, sea anemone and choanoflagellates. The phylogenetic distribution of the EVC complex components and EVC3 suggests that EVC3 may represent an ancestral ciliary protein, with EVC and EVC2 emerging in multicellular animals as regulators of Hh signaling (Pusapati et al., 2014). The identification of EVC3 proteins in cilia suggests that EVC proteins likely have ancient functions at cilia where EVC3 presumably had Hh-independent functions.
Other known ciliary proteins such as TULP3, a regulator of Hh signaling, were identified exclusively in the sea urchin ciliome. Although homologs of TULPs are present in the genomes of both choanoflagellates and sea anemones, an ortholog of TULP3 is missing, suggesting that the TULP family expanded in animals and TULP3 may be a Deuterostome innovation.
Beyond Hh signaling components, we detected proteins involved in other pathways, such as GPCR signaling, in the ciliomes of both sea anemones and sea urchins. Homologs of four mouse GPCRs were present in the sea urchin or sea anemone ciliome. In addition to GPCRs, orthologs of multiple G protein components were identified in these ciliomes, including GNAS, GNAQ, GNAO1 and GNB2. The roles of the G protein Transducin in phototransduction at the photoreceptor outer segment (a modified cilium) and of the G protein GNAL in olfaction at the cilia of olfactory sensory neurons are well appreciated (Gießl et al., 2004; Kuhlmann et al., 2014). The identification of multiple G proteins in the ciliomes of sea anemones and sea urchins suggests that their association with cilia arose early in animal evolution. The co-existence of GPCR and Hh signaling proteins in cilia of early-branching animals may have facilitated the evolution of crosstalk between the two pathways, exemplified by the involvement of the GPCR GPR161, β-Arrestins and GRKs in mammalian Hh signal transduction (Chen et al., 2011; Evron et al., 2011; Mukhopadhyay et al., 2013; Pal et al., 2016). As the ciliomes contained previously identified members of Hh, GPCR and TRP channel signaling, we hypothesize that they also contained unrecognized ciliary regulators of these signaling pathways.
The ciliomes identified 73 proteins encoded by genes that, when mutated, cause human ciliopathies such as PCD (e.g., HYDIN, CCDC39, TTC25), Bardet-Biedl syndrome (e.g., BBS1, BBS2, BBS3/ARL6), retinal degeneration (e.g., LCA5, ARL3, CLUAP1) and nephronophthisis (e.g., DCDC2A, TRAF3IP1) (Hildebrandt et al., 2011). Another 241 genes represented in these ciliomes are associated with human diseases with no established connection to cilia. Perhaps some of these diseases are caused by defects in cilia, as discussed for WDR65 and van der Woude syndrome, above. Beyond WDR65, we identified RAB28 in the sea anemone ciliome, mutations in which are associated with a form of retinitis pigmentosa called progressive rod-cone dystrophy 18 (Cord18) (Roosing et al., 2013). Therefore, we hypothesize that Cord18 is caused by RAB28-associated dysfunction of the photoreceptor outer segment. Similarly, we identified NEK9, in the ciliome, which is linked to a form of skeletal dysplasia recently proposed to be a ciliopathy (Casey et al., 2016). We predict that, like ENKUR and situs inversus, other ciliome members identified here will prove to underlie orphan ciliopathies.
The identification of an extensive compilation of ciliary proteins from organisms at key phylogenetic nodes has shed light on the evolutionary history of ciliary signaling proteins, suggesting that ciliary signaling pathways, such as Hh and GPCR signaling, evolved before the emergence of Bilaterians or, in the case of TRP channel signaling, before the emergence of animals. Using evolutionary proteomics, we identified previously uncharacterized ciliary proteins, including ENKUR, which our data suggest may underlie a human disease, demonstrating promise for further studies of ciliome members and for future applications of evolutionary proteomics. The use of the ciliomes to identify an evolutionarily conserved function for ENKUR illustrates how a protein’s evolutionary association with an organelle can help elucidate its function.
Our cilia proteomics approach has provided insights into the evolutionary history of ciliary signaling proteins and identified previously unknown cilia proteins. Similar to the analysis brought to bear on cilia here, we propose that proteomic profiling of other organelles, such as mitochondria or lysosomes, from multiple, diverse organisms will help to define their evolutionary trajectories and elucidate their core components.
STAR METHODS
CONTACT FOR REAGENT AND RESOURCE SHARING
Further information and requests for resources and reagents should be directed to and will be fulfilled by the Lead Contact, Jeremy Reiter (jeremy.reiter@ucsf.edu)
EXPERIMENTAL MODELS AND SUBJECT DETAILS
Animal husbandry and embryo culture
Sea urchins
Adult male and female S. purpuratus were obtained from UC Davis Bodega Marine Laboratory (Bodega Bay, CA) or Kerckhoff Marine Laboratory (Corona Del Mar, CA) and housed in tanks containing artificial seawater (Instant Ocean, Blacksburg, VA) at 12–15°C. Gametes were collected by bathing the gonads with 0.5M KCl to stimulate release of eggs and sperm. Eggs were washed 3 times with natural seawater and approximately 2,000,000 eggs were fertilized with a drop of sperm in 500ml of natural seawater. The embryos were cultured at approximately 14°C with constant, gentle stirring.
Sea anemones
Adult male and female N. vectensis were maintained in 33% artificial seawater at 18°C and spawning was induced as described (Fritzenwanker and Technau, 2002). Briefly, adult animals were maintained in the dark for at least 4 days and switched to light to induce release of gametes. Embryos were obtained by in vitro fertilization and were cultured at 21°C in 33% artificial seawater.
Choanoflagellates
An environmental isolate of S. rosetta (ATCC50818) that had been treated with antibiotics to reduce bacterial diversity and subsequently supplemented with Algoriphagus machipongonensis to induce colonies (Fairclough et al., 2010) was cultured in cereal grass infused artificial seawater (Tropic Marine, Montague, MA) diluted to 10% in artificial seawater (King et al., 2009) at approximately 22°C.
Zebrafish
Adult male and female Danio rerio of the Ekkwill strain were reared at 28°C and embryos were obtained from natural matings. Embryos were cultured at 28°C for 4–6 hours post fertilization and then maintained at approximately 22°C.
Xenopus laevis
Adult male and female Xenopus laevis were maintained at 18°C in reverse-osmosis water adjusted to pH6.5 with buffer (Crystal Sea Marinemix, Marin Enterprises international). Female adult X. laevis were injected hCG (human chorionic gonadotropin) to induce ovulation. To collect sperm, adult male frogs were euthanized in 0.05 % benzocaine and testes were surgically removed and homogenized. Embryos were fertilized in vitro and maintained at 18°C. X. laevis husbandry and experiments were performed using standard conditions and following animal ethics guidelines of the University of Texas at Austin, protocol number AUP-2015-00160..
Mouse strains
Enkur mutant mice were generated using a targeting vector consisting of pBluescript KS(-) plasmid containing a 5′ homology arm spanning exon 2 and 3 kb of intron 1, a neomycin resistance-thymidine kinase fusion, and a 3′ homology arm containing 4 kb of intron 2. The targeting vector was designed to delete a region of exon 2 of the Enkur gene upon homologous recombination and create a frameshift within any messages that splice around the selection cassette (Figure S5E). Linear vector was tranfected into 129/SvJ embryonic stem cells and placed under positive and negative selection with G418 and ganciclovir. Correctly targeted Enkur−/+ embryonic stem cell clones were identified using Southern blotting with a 5′ external probe that detects an 8 kb PstI fragment in the wild type allele and a 6.5 kb PstI fragment in the mutant allele (Figure S5F). Enkur−/+ embryonic stem cells were injected into C57BL/6J blastocycts to generate chimeric mice (University of Massachusetts Medical School Transgenic Animal Modeling facility). Chimeric mice were crossed to C57BL/6J mice and Enkur−/+ progeny were identified using PCR genotyping with primers listed in Table S9. Mice were maintained on a mixed C57BL/6J-129 genetic background. The Institutional Animal Care and Use Committee at the University of California, San Francisco approved all protocols involving Enkur mutant mice.
A C57BL/6J male mouse was used for the isolation of RNA from testis for generation of the Enkur in situ hybridization plasmid. CD-1 wild type embryos were used for Enkur in situ hybridization (Figure S5K). All animal experiments with the CD-1 mice complied with ethical regulations and were approved by local government authorities (Landesamt für Natur, Umwelt und Verbraucherschutz Nordrhein-Westfalen, Germany; AZ 84-.05.20.12.164, AZ 84-02.05.20.12.163, AZ 84-02.05.50.15.025 and AZ 84-02.05.50.15.012).
Human Subjects
We obtained signed and informed consent from patients fulfilling all PCD diagnostic criteria as well as their family members using protocols approved by the Institutional Ethics Review Board of the University of Muenster (Germany). In the Azerbaijani, consanguineous family OP-1605 two of four children of the parents, who are first degree cousins, display situs inversus, OP-1605 II1 and OP-1605 II2. OP-1605 II1 is a 24 years old individual of male and OP-1605 II3 is a 20 years old female individual.
Mammalian cell culture
RPE-1 cells (female) (ATCC CRL-4000) were cultured in Dulbecco’s modified Eagle’s medium (DMEM) High Glucose/F-12 50:50 (Cell Culture Facility (CCF)), University of California, San Francisco, CA) supplemented with 10% fetal bovine serum (FBS) (Gibco) and Glutamax (Gibco). IMCD3 cells (ATCC CRL-2123) were cultured in DMEM:F12 (Gibco) supplemented with 10% FBS and Glutamax.
METHOD DETAILS
Cilia isolation
Sea urchins
Gastrula stage S. purpuratus embryos were concentrated by centrifugation at 170–200 g for 4–10 minutes at 4°C and washed 3–4 times with artificial seawater. To amputate cilia, embryos were gently resuspended in a high salt solution (artificial seawater + 0.5M NaCl) approximately 10 times the volume of the embryo pellet. The samples were immediately spun at 400 g for 5 minutes at 4°C to pellet deciliated embryos. The supernatant was transferred to a fresh tube and spun a second time to pellet any remaining embryos. The supernatant containing cilia was then spun at 10,000 g for 20 minutes at 4°C and the resulting cilia pellet was collected for subsequent analysis. Cilia samples for mass spectrometry were resuspended in 0.1% RapiGest SF Surfactant (Waters, Milford, MA).
To separate the axonemes from the membrane plus matrix fraction, pelleted cilia were resuspended in extraction buffer (1% Nonidet NP-40, 30mM Hepes, pH7.4, 5mM MgSO4, 0.5mM EDTA, 25mM KCl, 1mM DTT) and centrifuged at 30,000 g for 20 minutes at 4°C. The supernatant (membrane plus matrix fraction) was separated from the pellet (axonemes) and the pellet was resuspended in SDS extraction buffer (0.5% SDS, 50mM NaCl, 50mM Tris, pH 7.4). Both samples were precipitated in methanol:chloroform (4:1) and resuspended in 0.1% RapiGest SF Surfactant for mass spectrometry.
Sea anemones
N. vectensis planula larva (day 3 of development) were washed twice with 33% artificial seawater containing 20mM DTT and then transferred to high salt solution (artificial seawater, 0.5M NaCl, 100mM DTT, Complete Mini protease inhibitor without EDTA (Roche)) and incubated with gentle agitation at 4°C for 5 minutes. The embryos were removed by centrifugation at 400 g for 2 minutes at 4°C. The supernatant containing cilia was transferred to LoBind microcentifuge tubes (Eppendorf, Hamburg, Germany) and centrifuged at 10,000 g for 10 minutes at 4°C to pellet cilia. The pellet was gently resuspended and diluted to 600 μl with 33% artificial seawater containing 100mM DTT. The cilia sample was overlain onto a sucrose step gradient from 80−30% sucrose (sucrose solution contained 50mM Tris, pH8.0, 10mM DTT), step size 10%, 1ml per step. The sample was spun at 100,000 g in a swinging bucket rotor for 3 hours at 4°C and fractions were collected from the bottom of the tube by puncturing with a 30 gauge needle and allowing the sample to flow by gravity. A portion of each fraction was analyzed by immunoblot to determine which fractions contained high levels of TUBac and low levels of Actin (Figure 1C, e.g. fractions 6 and 7). To concentrate the samples and remove the sucrose, the protein was precipitated using 16% trichloroacetic acid (TCA) and washed 2 times with acetone, then resuspended in RapiGest SF Surfactant for mass spectrometry.
Choanoflagellates
Before flagellar amputation, 8L of S. rosetta culture were harvested at peak density by centrifugation at 4,000 g for 15 minutes at 4°C to pellet colonies. Colonies were concentrated into approximately 250ml and passed through a 40 μm filter to remove clumps of bacteria. S. rosetta were then centrifuged at 2,000 g for 15 minutes at 4°C. The pellet was resuspended in 20ml of artificial seawater (Tropic Marin). The sample was split in half and overlain onto 2ml of Percoll solution (8% Percoll - GE Healthcare, 0.5M sorbitol, 50mM Tris, pH8.0, 15mM MgCl2, 1% artificial seawater) and spun at 1,000 g for 10 minutes at room temperature. The supernatant containing bacteria was removed and the pellet of S. rosetta colonies was gently resuspended in 50ml of artificial seawater. The culture was incubated for 20 hours to allow the S. rosetta to eat the residual bacteria.
To amputate flagella, S. rosetta colonies were concentrated by centrifugation at 2,000 g for 15 minutes and resuspended in 10 ml of HMSA (10mM Hepes, pH7.4, 5mM MgSO4, 10% sucrose, 5% artificial seawater). The colonies were transferred to a 10cm dish and 700 μM dibucaine was added. The dish was agitated gently for 5 minutes and deflagellation was visually followed using a stereomicroscope. Additional dibucaine was added as needed until the majority of flagella were amputated. Immediately after flagellar amputation, 5ml of 10mM Hepes, pH7.4, 5mM MgSO4, 1mM EGTA was added to the sample.
To separate the flagella from the cell bodies, the sample was split in half and purified over Percoll as described above. The top, clear layer containing the flagella was collected and the pellet and bottom 2 ml containing most of the cells were discarded. The flagellar fraction was spun at 16,000 g for 20 minutes at 4°C to pellet the flagella. To further purify the sample, the flagellar pellet was gently resuspended in ~800μl of artificial seawater and overlain onto a sucrose step gradient. The sucrose was dissolved in 10mM Hepes, pH7.4, 5mM MgSO4, 5% artificial seawater and a step gradient from 40–80% sucrose was prepared using 10% steps, 1ml of each step. The sample was spun at 100,000 g for 3 hours at 4°C. To collect fractions, a hole was punctured in the bottom of the tube using a 25 gauge needle and fractions between 100 and 700μl were captured.
A small portion of each fraction was analyzed by immunoblot to determine which fractions contained high levels of TUBac and low levels of Actin (Figure 1G, Fractions 4 and 5). Samples from 2 experiments were pooled for mass spectrometry. Fraction 1 and 10 were also analyzed by mass spectrometry to use for comparison (see below). The samples were TCA precipitated, washed and resuspended for mass spectrometry as described above.
Mass spectrometry and protein identification
Purified cilia or flagella were lysed in a buffer containing 8M urea, 150mM NaCl, and protease inhibitors (Complete, EDTA-free tablet, Roche) and digested with Trypsin (Ramage et al., 2015). For samples that were fractionated, the digested peptides (100 μg) were fractionated using hydrophilic interaction chromatography (HILIC). The samples were injected onto a TSKgel amide-80 column (Tosoh Biosciences, 2.0 mm × 15 cm packed with 5 μm particles) equilibrated with 10% HILIC buffer A (2% acetonitrile [ACN], 0.1% trifluoroacetic acid [TFA]) and 90% HILIC buffer B (98% ACN, 0.1% TFA) using an AKTA P10 purifier system. The samples were then separated using a one-hour gradient from 90% HILIC buffer B to 55% HILIC buffer B at a flow rate of 0.3 ml/min. Fractions were collected every 1.5 min and combined into 12 fractions based on the 280 nm absorbance chromatogram. Fractions were evaporated to dryness and reconstituted in 20 μl of 0.1% formic acid for mass spectrometry analysis.
All samples were analyzed on an Orbitrap Elite mass spectrometry system equipped with an Easy-nLC 1000 HPLC and autosampler. HILIC fractionated samples were injected onto a pre-column (2 cm × 100 μm I.D. packed with 5 μm C18 particles) in 100% buffer A (0.1% formic acid in water) and separated on an analytical column (10 cm × 75 μm I.D. packed with 1.9 μm C18 particles) with a 60 minute reverse phase gradient from 5% to 30% buffer B (0.1% formic acid in 100% ACN) at a flow rate of 400 nl/min. The mass spectrometer continuously collected spectra in a data-dependent manner, acquiring a full scan in the Orbitrap (at 120,000 resolution with an automatic gain control target of 1,000,000 and a maximum injection time of 100 ms), followed by collision-induced dissociation spectra for the 20 most abundant ions in the ion trap (with an automatic gain control target of 10,000, a maximum injection time of 10 ms, a normalized collision energy of 35.0, activation Q of 0.250, isolation width of 2.0 m/z, and an activation time of 10.0). Singly and unassigned charge states were rejected for data-dependent selection. Dynamic exclusion was enabled to data-dependent selection of ions with a repeat count of 1, a repeat duration of 20.0 s, an exclusion duration of 20.0 s, an exclusion list size of 500, and exclusion mass width of +/− 10.00 parts per million (ppm).
Samples that were not HILIC fractionated were injected onto a high resolution C18 column (25 cm × 75 μm I.D. packed with ReproSil Pur C18 AQ 1.9 μm particles) in 0.1% formic acid and then separated with a two-hour gradient from 5% to 30% ACN in 0.1% formic acid at a flow rate of 300 nl/min. The mass spectrometer collected data in a data-dependent fashion, collecting one full scan in the Orbitrap at 120,000 resolution with an AGC target of 1,000,000 followed by 20 collision-induced dissociation MS/MS scans in the dual linear ion trap with an AGC target of 30,000 for the 20 most intense peaks from the full scan. Dynamic exclusion was enabled to exclude masses within +/− 10 ppm for 30 s a repeat count of 1. Charge state screening was employed to reject analysis of singly charged species or species for which a charge could not be assigned.
Raw mass spectrometry data were analyzed by the Protein Prospector suite (Clauser et al., 1999). Data were matched to S. purpuratus, N. vectensis and S. rosetta protein sequences downloaded from UniProt containing 28,593, 24,435, and 11,698 protein sequences, respectively, concatenated to a decoy database where each sequence was randomized in order to estimate the false positive rate. The searches considered a precursor mass tolerance of +/− 20 ppm and fragment ion tolerances of 0.8 da, and considered variable modifications for protein N-terminal acetylation, protein N-terminal acetylation and oxidation, glutamine to pyroglutamate conversion for peptide N-terminal glutamine residues, protein N-terminal methionine loss, protein N-terminal acetylation and methionine loss, and methionine oxidation, and constant modifications for carbamidomethyl cysteine. Prospector data was filtered using a maximum protein expectation value of 0.01 and a maximum peptide expectation value of 0.05.
Membrane plus matrix enrichment analysis
To identify proteins that were enriched in the membrane + matrix fraction of sea urchin cilia, the unique peptide count (the number of distinct peptide sequences identified for each protein) was used as a proxy for protein abundance. [M/M+1/total+1]−[Ax+1/total+1] = enrichment score. The membrane plus matrix enrichment score for cilia from early gastrula embryos and late gastrula embryos was summed to determine the final enrichment score.
Choanoflagellate ciliome subtractive analysis
To identify proteins that were enriched in the cilia of S. rosetta, we compared the unique peptide count of two cilia samples (Figure 1G, fractions 4 and 5) to the cell body sample (fraction 1) and the microvilli sample (fraction 10) and discounted proteins that did not have a unique peptide count in either fraction 4 or 5 that was greater than fraction 1 and 10.
Identification of the conserved ciliome
To identify ciliome proteins with a homolog in M. musculus, we used the BLAST+ suite of executables (Camacho et al., 2009). For each organism analyzed by mass specrometry, full predicted protein sequences of proteins associated with 2 or more unique peptide hits were used to query the M. musculus proteome (ensembl.org) using blastp (Expected value cutoff 1e−5). The top hit was classified as the mouse homolog. If reciprocal blast of the mouse protein homolog to the source organism’s proteome (downloaded from unprot.org) retrieved the original query protein (best reciprocal BLAST method), we considered the two proteins to be orthologs.
CRAPome analysis
To remove common protein contaminants from the conserved ciliome, we used the CRAPome database (crapome.org) (Mellacheruvu et al., 2013) to determine the number of times each protein was identified in another control proteomics experiment. We removed proteins from the conserved ciliome that were identified in over 70 control experiments (Table S1).
SYSCILIA gold standard analysis
To determine the proportion of ciliary SYSCILIA gold standard proteins (SCGSv1) (van Dam et al., 2013), with localization distal to the transition zone, that was present in the ciliome of each organisms, we determined the number of human ciliary SCGSv1 proteins had an ortholog in the proteome of S. purpuratus, N. vectensis and S. rosetta using InParanoid8 (http://inparanoid.sbc.su.se/cgi-bin/index.cgi) (Sonnhammer and Östlund, 2015). We then counted the number of proteins in the ciliome of each organism with an ortholog to a human ciliary SCGSv1 protein. To calculate the percentage of ciliary SCGSv1 proteins in previously published ciliomes, we downloaded data sets from Cildb V2.0 using the low stringency threshold (Avidor-Reiss et al., 2004; Ishikawa et al., 2012; Li et al., 2004, Mick et al., 2015; Ostrowski et al., 2002; Pazour et al., 2005).
Choanoflagellate-Chlamydomonas ciliome comparison
We used blastp (Expected value cutoff 1e−5) to determine which protein homologs in the S. rosetta ciliome were present in the Chlamydomonas reinhardtii ciliary proteome (Pazour et al., 2005). Proteins with 2 or more peptides in the C. reinhardtii ciliary data set were included in the analysis.
Identification of known ciliary proteins and disease classification
To identify the ciliome proteins previously implicated to be involved in ciliary biology, the Biomart tool in Cildb V2.0 (cildb.cgm.cnrs-gif.fr) was used to obtain the mouse ortholog of all cilia in 15 studies using the medium threshold (Avidor-Reiss et al., 2004; Blacque et al., 2005; Boesger et al., 2009; Broadhead et al., 2006; Cao et al., 2006; Chen et al., 2006; Efimenko et al., 2005; Laurençon et al., 2007; Li et al., 2004; Liu et al., 2007; Mayer et al., 2008; Merchant et al., 2007; Ostrowski et al., 2002; Pazour et al., 2005; Smith et al., 2005). For 4 studies that were not included in Cildb but used in our comparison, we obtained protein identifiers directly (Choksi et al., 2014; Ishikawa et al., 2012; Mick et al., 2015; Narita et al., 2010). See Table S4 for details on each study.
Online Mendelian Inheritance in Man (OMIM; omim.org), Orphanet (orpha.net) and Developmental Disorders Genotype-to-Phenotype database (DDG2P) (Wright et al., 2015) databases were used to identify genes associated with human disease.
CLIME analysis
The phylogenetic distributions of ciliome members with mouse homologs was assessed by a computational algorithm, CLustering by Inferred Models of Evolution (CLIME) (Li et al., 2014). We evaluated how closely the ciliome member matched the phylogenetic distribution of cilia by assigning it a positive point for every ciliated organism in which it has a detected homolog (listed in Figure S2 legend), and a negative point for every unciliated organism in which it has a detected homolog, with a prokaryote homolog being weighted tenfold more. Genes that scored greater than 29 in this metric were considered to be co-evolved with cilia. Genes that scored less than 1 were considered to be not co-evolved with cilia. Genes with intermediate scores were considered to be neither.
Protein sequences alignments
Alignments were built using MUSCLE and displayed using Jalview. The ClustalX color scheme was used to indicate residues with similar chemical properties.
Random selection of proteins for ciliary localization screen
To select proteins for subcellular localization studies, 49 proteins from the high-confidence ciliome (Table S1) and 30 human genes not present in the ciliomes were selected by the RANDBTWN function of Excel (Microsoft) from the ENSEMBL list of human protein coding genes. Of these genes, 40 were represented by Gateway-compatible clones of the human ortholog present in the hORFeome v8.1 (Yang et al., 2011). We used Gateway-mediated subcloning to insert the open reading frame of the remaining genes in frame with the EGFP open reading frame of pCS-EGFP-DEST (Villefranc et al., 2007), as described below in Expression constructs and in situ probe plasmid generation. The list of the genes cloned is included in Table S5.
Mammalian cell line transfection
All cell lines were transfected using jetPRIME (Polyplus-stransfection, New York, NY). Cells were grown on a coverslip in a 24-well plate. 500ng of plasmid DNA was diluted in 50μl of jetPRIME buffer. 1μl of jetPrime was added to the DNA. The solutions was vortexed and incubated at room temperature for 10 minutes. Transfection mix was added dropwise to the culture medium and cells were analyzed at least 24 hours later.
Mouse tracheal epithelial cell culture and infection
Mouse tracheal epithelial cell (mTECs) were isolated from C57BL/6J mice and cultured as described previously (You and Brody, 2012). Trachea were harvested from mice at least 8 weeks of age and incubated with 0.3% Pronase (Roche) dissolved in Ham’s F-12 (Gibco) for 24 hours at 4°C. Trachea were gently agitated to dislodge cells and Ham’s F-12 + 10% FBS was added to the pronase solution. Trachea were removed, rinsed with Ham’s F-12 + 10% FBS to remove any remained cells and cells were pelleted by centrifugation at 500 g for 10 minutes, at 4°C. The cells were resuspended in mTEC/Basic medium (DMEM/F12 supplemented with 15mM Hepes, 1.5mM L-Glutamine, 14mM NaHCO3, 100μg/mL Pen/Strep) containing 10% FBS (Invitrogen) and fibroblasts were removed by incubating in a Primaria™ tissue cultures dish (Corning) for 1–4 hours at 37°C with 5% CO2. Nonattached epithelial cells were collected by swirling and removing supernatant and cells were pelleted by centrifugation at 500 g for 5 minutes, at 4°C. Cells were resuspended in mTEC/Plus (mTEC/Basic supplemented with 10ug/mL insulin (Sigma-Aldrich), 5μg/mL transferrin (Sigma-Aldrich), 0.1μg/mL Cholera toxin (Sigma-Aldrich), 25ng/mL epidermal growth factor (Invitrogen), 10μg/mL bovine pituitary extract (Sigma-Aldrich), 5% FBS) containing 0.05μM retinoic acid (Sigma-Aldrich) and plated onto collagen-coated, permeable polycarbonate membranes (Transwell®, Corning) with 0.4μm pores.
For mTECs that were infected with lentivirus carrying Enkurin shRNAs (See Table S9 for shRNA sequences; virus produced by UCSF Viracore, San Francisco, CA), two days after plating cells, proliferating mTECs were infected as described previously (Vladar and Brody, 2013). For each well (0.33 cm2 surface area) 5ul of concentrated virus (titer not known) was diluted in 150ul of mTEC/Plus containing 0.05μM retinoic acid and 5ug/mL Polybrene. To select for infected cells, starting 2 days after infection, mTECs were cultured with 2–4mg/ml Puromycin for 10 days before initiating differentiation by culturing cells at the air-liquid interface.
To initiate differentiation of mTECS, after the cells grew to confluency, the media was removed from the apical surface of the cells and the media in the basal chamber was changed to mTEC/NS (mTEC/Basic supplemented with NuSerum™ (Corning)) containing 0.05μM retinoic acid. After approximately 7 days beating cilia were visible and cells were used for immunofluorescent staining.
Immunofluorescent staining and imaging
Sea urchin embryos
S. purpuratus embryos were fixed in 2% paraformaldehyde (PFA) in PEM (20mM PIPES, 0.5mM EGTA, 20mM MgCl2) + 0.1% Triton X-100 for 3 days, blocked in PBST (PBS + 0.1% Triton X-100) containing 10% donkey serum for 1 hour, and incubated with primary antibodies overnight at 4°C. Embryos were incubated with secondary antibodies and Hoechst 33342 (1μg/ml) for 1 hour, then incubated for 10 minutes with increasing concentrations of glycerol (10%, 25%, 50% in PBS; 10 minutes for each glycerol solution). Embryos were mounted in 50% glycerol in PBS for imaging.
Sea anemone embryos
To visualize Actin and TUBac, N. vectensis embryos were fixed for 1.5 minutes in 3.7% Formaldehyde, 0.25% Gluteraldehyde in 33% artificial seawater and then in 3.7% Formaldehyde, 0.1% Tween-20 for 1 hour at 4°C. Embryos were blocked in PBST containing 10% donkey serum for 1 hour and subsequently incubated with primary antibodies and Alexa Fluor 555 Phalloidin (Invitrogen) overnight at 4°C. After washing with PBST, the embryos were incubated with secondary antibodies and DAPI (1μg/ml) for 1 hour. Primary and secondary antibodies were diluted in PBST + 2% BSA. Embryos were mounted in ProLong Gold Antifade Mounant (Invitrogen).
Choanoflagellate colonies
S. rosetta colonies were Percoll purified as described above to remove bacteria, placed on poly-L-lysine coated coverslips and incubated for 15 minutes to allow cells to attach. 6% acetone diluted in PEM was applied to the cells for 5 minutes, removed and the cells were subsequently fixed in 4% PFA in PEM for 10 minutes. Cells were blocked with 2% BSA in PEM + 0.1% Triton X-100. To stain for Actin and β-tubulin, embryos were incubated with primary antibodies overnight and secondary antibodies, Alexa Fluor 568 Phalloidin (Invitrogen) and DAPI (1μg/ml) for 1 hour. Coverslips were mounted in ProLong Gold Antifade Mounant (Invitrogen).
Mammalian cells
Cells were cultured on coverslips, fixed for 8–10 minutes with 4% PFA in PBS, and blocked with 5% Donkey Serum in PBST for 30 minutes. Cells were incubated with primary antibodies overnight at 4°C and secondary antibodies and Hoechst 33342 for 1 hour. All antibodies were diluted in 2% BSA, 1% donkey serum in PBST. Coverslips were mounted in ProLong Gold or Diamond Antifade mountant (Invitrogen).
Isolated cilia
Isolated cilia were applied to poly-L-lysine coated coverslips and incubated for 15 minutes to allow cilia to attach to the surface of the coverslip, then fixed with 4% PFA in PBS for 10 minutes and immunostained as described for mammalian cells.
Mouse embryos
Pregnant female mice were sacrificed, embryos isolated in PBS and fixed in 4% PFA in PBS for 30 minutes. The embryos were washed with PBST three times, 5 minutes each. After blocking in 1% BSA and PBST for two hours, the embryos were incubated in primary antibodies overnight in blocking solution at 4°C. Following washes with PBST, the samples were incubated with secondary antibodies and Hoechst 33342 in blocking solution for 1 hour. The embryos washed with PBST and mounted in ProLong Diamond Antifade mountant (Invitrogen).
mTECs
mTEC cells were fixed on culture membranes in 4% PFA in PBS for 10 minutes. The cells were incubated in 1% SDS, PBST for 5 minutes, washed with PBST and then stained as described above for mammalian cells. Structured illumination microscopy (SIM) data for mTECs (Figure 5H) were collected on a Nikon N-SIM microscope in 3D-SIM mode using an Apo TIRF 100×/1.49 Oil objective.
Zebrafish
D. rerio embryos were fixed in 4% PFA in PBS for 2 hours, washed 3 times in PBS, blocked in PBDT (PBS + 1% BSA, 1% DMSO, 0.5% Triton X-100) containing 10% donkey for 1 hour serum and stained with primary antibody diluted in PBDT overnight at 4°C. Embryos were incubated with secondary antibodies and Hoechst 33342 (1μg/ml) for 1 hour and mounted in 50% glycerol for imaging.
Human nasal brush biopsies
Nasal brush biopsies were obtained from the middle turbinate with a cytology brush and suspended in RPMI cell culture medium (GIBCO) (Wallmeier et al., 2014). Cells were spread on glass slides, air dried and stored at −80°C until use. Defrosted samples were fixed in 4% PFA in PBS for 15 minutes. After washing with PBS, the cells were permeabilized with 0.2%Triton-X 100 in PBS for 15 minutes. Following washes with PBS, samples were blocked in blocking solution (1–5% skim milk in PBS) at 4°C overnight. Samples were incubated for at least 3 hours with primary antibodies diluted in blocking solution. Slides were rinsed with PBST, washed with blocking solution and incubated with secondary antibodies in blocking solution for 30 minutes. After washes with PBS, the nuclei were stained with Hoechst 33342 for 10 minutes. High-resolution fluorescence images were acquired either with a Zeiss LSM880 using ZEN2 software or with a Zeiss AxioObserver Z1 Apotome with AxioVision 4.8 software (Carl Zeiss, Jena, Germany) and processed with ZEN2 Software and Adobe Creative Suite 4 (Adobe Systems Incorporated, San Jose, CA).
All other images were acquired on the Leica TCS SPE laser scanning confocal microscope and processed using FIJI and Adobe Photoshop CS5.1 unless otherwise specified.
Expression of GFP-tagged proteins in Zebrafish embryos
Capped mRNAs were synthesized using mMESSAGE mMACHINE SP6 transcription kit (Invitrogen Ambion). Embryos were injected at the 1–2 cell stage with 125–250pg of RNA.
Xenopus ENKUR-GFP expression, morpholino knockdown and imaging
Embryos dejellied in 1/3X modified Marc’s Ringer (MMR) with 2.5%(W/V) cysteine at pH7.8 and were microinjected with mRNA or morpholino in 2% Ficoll (W/V) in 1/3X MMR at the 4 cell stage. Injected embryos were washed and were incubated in 1/3X MMR until the appropriate stages.
For expression of X. laevis and S. purpuratus ENKUR-GFP, capped mRNA was synthesized using mMESSAGE mMACHINE SP6 transcription kit (Invitrogen Ambion). A morpholino antisense oligonucleotide (MO) against Enkurin was designed to block splicing (Gene Tools). Its sequence was 5′- AATGACTATCCACTTACTTTCAGCC - 3′. mRNA and MOs were injected into two ventral blastomeres or two dorsal blastomeres at the 4-cell stage to target the epidermis or the gastrocoel roof plate (GRP), respectively. Each mRNA or MO was used at the following dosages: GFP-Enkurin (60 pg), centrin4-BFP (40 pg), memRFP (50 pg) and Enkurin MO (20 ng). To verify the efficiency of Enkurin MO, MO was injected into the all cells at 4-cell stage and then RT-PCR was performed as described in the “Quantitative RT-PCR” section of the STAR methods.
Confocal images were captured with LSM700 inverted confocal microscope (Carl Zeiss) with a Plan-APOCHROMAT 63×/1.4 oil immersion objective. Bright field images were captured on a Zeiss Axio Zoom. V16 stereo microscope with Carl Zeiss Axiocam HRc color microscope camera.
Immunoblotting
Tissue was lysed using RIPA buffer (50mM Tris, pH 7.4, 150mM NaCl, 1% NP-40, 0.5% sodium deoxycholate) supplemented with protease inhibitors (Calbiochem, Billerica, MA). Protein samples were separated on 4–15% gradient TGX precast gels (Bio-Rad, Hercules, CA), transferred to nitrocellulose membrane (Whattman, Pittsburgh, PA). Membranes were blocked and antibodies were diluted in 5% milk in TBST (50mM Tris, pH 7.6, 150mM NaCl, 0.1% Tween 20) and analyzed using ECL Lightening Plus (Perkin–Elmer, Waltham, MA).
Quantitative RT-PCR
For RT-PCR of mouse tissues, RNA was extract from cells using the RNeasy Mini or Micro Kit (Qiagen, Hilden, Germany) and cDNA was synthesized using iScript cDNA Synthesis Kit (BioRad). Quantitative PCR was performed using EXPRESS SYBR GreenER with Premixed ROX (Invitrogen) and the 7900HT Fast Real-Time PCR System (ThermoFisher Scientific). Relative expression was calculated using the delta-delta CT method (Livak and Schmittgen, 2001). For measuring expression of Enkur, the geometric mean of Ubiquitin C (Ubc) and Hydroxymethylbilane synthase (Hmbs) expression was used as the endogenous control for normalization. See Table S9 for primer sequences. The data were analyzed using Microsoft Excel and plotted using Prism7.
To verify the efficiency of Enkurin MO, MO was injected into the all cells at 4-cell stage and total RNA was isolated using TRIZOL reagent (Invitrogen) at stage 20. cDNA was synthesized using M-MLV Reverse Transcriptase (Invitrogen) and random hexamers. Enkurin cDNA was amplified by taq polymerase (NEB) (see table S9 for primers).
Expression constructs and in situ probe plasmid generation
To construct the GFP-tagged expression plasmids for S. purpuratus ENKUR, ARRB1 and OPRM1L, gene specific cDNA was made from RNA of gastrula stage embryos using AccuScript (Agilent) or SuperScriptIII (Thermo Fisher Scientific), PCR amplified using primers containing the cutsites indicated below and TOPO-TA cloned into PCR2.1 (Invitrogen). The following restriction enzymes were used to insert cloned cDNA in the pCS2+8CeGFP (Gökirmak et al., 2012): for ENKUR - AscI and ClaI, for ARRB1 - AscI and PacI, OPRM1L -BamHI and ClaI. Unless otherwise indicated, the reverse primer for each gene was used to make gene specific cDNA. To construct the L. variegatus in situ probe, 480bp fragment of L. variegatus Enkurin synthesized using gBlocks Gene Fragments (IDT, San Diego, CA).
To generate the X. laevis ENKUR-GFP expression construct, full length of Enkurin cDNA was amplified from X. laevis RNA and cloned into pCS10R vector fused with N-terminal GFP using SalI and NotI. To generate the X. laevis in situ probe, the above plasmid was cut with SalI and synthesized using the T7 promoter. The Pitx2c in situ probe, membrane-RFP (CAAX motif fused to RFP) and Centrin 4-BFP plasmids are described in (Toriyama et al., 2016).
To create GFP fusions of human proteins to screen for ciliary localization in IMCD3s and D. rerio embryos human cDNA was cloned into pCS-eGFP-DEST using the Gateway system.
To construct the S. rosetta ENKUR-GFP expression plasmid, full-length cDNA (gift from Nicole King) was amplified, subcloned into pDONR221 and then cloned into pCS-eGFP-DES using the Gateway system.
To generated the mouse Enkur in situ probe, cDNA from M. musculus testis served as template for PCR for cloning a 598 bp fragment of Enkur. Via TOPO cloning, the fragment was ligated into the pCRII-TOPO vector (K4610, ThermoFisher Scientific,). The plasmid for the Lefty2 in situ probe was a gift from R. Harland (Meno et al., 1997). The IMAGE clone ID 790229
The mouse Enkur shRNAs were expressed in pLKO.1 and were purchased from Sigma-Aldrich, MISSION shRNA collection (see Table S9 for clone numbers).
All primer and shRNA sequences are listed in Table S9.
In situ hybridization
Mus musculus
For the mouse Enkur in situ probe, plasmid was digested with NotI for antisense probes and BamHI for sense control probes and purified using phenol and chloroform (see Table S9 for primers). Digested plasmid DNA served as template for in vitro transcription with Sp6 (antisense) or T7 (sense) RNA polymerases to generate digoxigenin (DIG) labeled RNA probes (Roche). For the Lefty2 probe, plasmid was digested with EcoRI and in vitro transcribed using T7 RNA polymeras. For the Cerl2 probe (IMAGE clone ID 790229), plasmid was digested with NotI and in vitro transcribed using T7 RNA polymerase.
Embryos were fixed in 4% PFA in PBS for at least 24 hours, transferred to methanol and stored at −80°C until use or, if in situ was performed within 2 weeks of dissection, embryos were stored in fixative at 4°C. If in methanol (Fig S5 only), embryos were rehydrated to PBST, bleached with 6% H2O2 for 1 hour, digested with 10μg/ml proteinase K (Roche) for 8 minutes and fixed with 4% PFA and 0.2% glutaraldehyde. The embryos were incubated in hybridization solution (50% formamide, 0.5% CHAPS, 0.2% Tween, 1.3× SSC, 5mM EDTA, 50μg/ml yeast t-RNA; 700U/ml Heparin) at 65°C for several hours. Hybridization with the DIG-labeled RNA probes was performed overnight at 65°C in hybridization solution. The following day, embryos were washed two times with fresh hybridization solution for 1hr each, transferred to MABT (100mM Maleic acid, pH7.5, 150 mM NaCl, 0.5%Tween) and washed 3 times with MABT for 15 minutes each. After incubating with blocking solution (2% Boehringer Blocking Reagent (Roche), 20% heat-treated sheep serum in MABT) for 1 hour the embryos were incubated overnight at 4°C with AP-anti-DIG antibody diluted in blocking solution. Following 4 washing steps in MABT for 1 hour each, and 1 wash overnight at 4°C the embryos were transferred to NTMT (100mM NaCl, 100 Tris, pH9.5, 50mM MgCl2, 0.1% Tween). Color was developed using NBT/BCIP or MB Purple Substrate (Roche). Embryos were imaged using a Zeiss Discovery.V12 stereomicroscope and AxioCam MRc camera or a Nikon Digital Sight DS-L3 camera mounted on a Nikon SMZ1000 stereomicroscope. Images were processed using creative suite (Adobe).
Xenopus
Whole mount in situ hybridization of X. laevis embryos was performed as described previously (Sive et al., 2000). Briefly, embryos were fixed in MEMFA (MOPS/EGTA/Magnesium Sulfate/Formaldehyde Buffer) at stage 30, were dehydrated overnight by 100% Methanol at −20°C and then were rehydrated sequentially. The fixed transcripts were hybridized with DIG-labeled probes against Enkurin and Pitx2c (see Table S9 for primers) and were visualized using an anti-Digoigenin antibody conjugated to alkaline phosphatase (AP) (Roche) and BM purple, a chromogenic substrate for AP.
Sea urchin
Whole mount in situ hybridization of Lytechinus variegatus embryos was performed on embryos fixed in 4% PFA diluted in artificial seawater overnight and stored in methanol. Embryos were washed 2 times in 50% methanol/50% TBST (TBS containing 0.1% Tween-20) and 1 time in TBST. Embryos were transferred to hybridization buffer (50% Formamide (Sigma-Aldrich), 4X SSC, 50μg/mL heparin, 50μg/mL yeast tRNA, 0.1% Tween-20) and incubated at 65°C for 1hr. The hybridization buffer was replaced with hybridization buffer containing 5% dextran sulfate (Thermo Fisher Scientific) and 1ng/μl of DIG-labeled single-stranded RNA probe against a Enkur (see Table S9 for primers). After incubation at 65°C overnight, embryos were washed at 65°C 2 times with hybridization buffer, 1 time with 50% hybridization buffer, 2X SSCT (2X SSCT, 0.1% Tween-20), 1 time with 0.2X SSCT, 1 time with 0.1X SSCT. The embryos were moved to room temperature and washed one time with TBST and incubated for 1 hour in blocking solution (5mg/mL bovine serum albumen, 2% heat inactivated sheep serum in TBST) then overnight in Anti-DIG antibody (1:15,000) diluted in blocking solution at 4°C. Washed the embryos 6 times in TBST, 1 time in NTMT (100mM Tris pH9.5; 100mM NaCl; 50mM MgCl2; 0.1% Tween 20), 1 time in NTMT containing 337.5ng/μL NBT (Roche) and 175ng/μL BCIP (Roche), 2 times in NTMT containing 337.5ng/μL NBT, 175ng/μL BCIP, 5mM Levamisole, then incubated at 37°C for 15 minutes. Embryos were moved to room temperature and when color was developed, quenched with 0.1M Glycine, pH 2.2. Embryos were imaged using a Zeiss Discovery.V12 stereomicroscope and AxioCam MRc camera or a Nikon Digital Sight DS-L3 camera mounted on a Nikon SMZ1000 stereomicroscope. Images were processed using creative suite (Adobe).
Sea anemone
Whole mount in situ hybridization of N. vectensis embryos was carried out using DIG-labeled single-stranded RNA probes against Enkurin (see Table S9 for primers) as following: Embryos were fixed for 90 s in ice cold 0.25% glutaraldehyde+3.7% formaldehyde in 33% artificial seawater, followed by 1 h in 3.7% formaldehyde in PBT (PBS+0.1%Tween20) at 4°C. After 4 washes in PBT, and one in deionized water, embryos were stored at −20 °C in MeOH. Animals were rehydrated in a PBT-MeOH dilution series and washed tree times in PBT. After proteinase K treatment (20 mg/ml for 10 min), they were washed twice in 4 mg/ml glycine in PBT, then 3x in 0.1M TEA pH7.8, with 0, 0.25% and 0.5% acetic anhydride, respectively. After three washes in PBT the samples were refixed in 3.7% formaldehyde in PBT for 30 min and washed five times in PBT. Prehybridization was at 60 °C for at least 2 hours in Hybridization solution made with 50% formamide, 5x SSC, 1% SDS, 0.1% Tween20, 50 μg/ml heparin, 100 μg/ml salmon sperm DNA, 9mM citric acid; Hybridization at 60 °C lasted for at least 60 h. In 30 min washes hybridization solution was substituted in a dilution series by 25%, 50%, 75%, 100% 2xSSCT followed by two 20 min washes with 0.2x SSCT and 0.1x SSCT respectively, all at 60 °C. Samples were subsequently washed into PBT with 0.1x SSCT in a 25%, 50%, 75%, 100% dilution series at RT. After 2 h of blocking in 1% Boehringer Blocking Solution in Maleic acid buffer (100mM maleic acid, 150mM NaCl, pH7.5), animals were incubated with anti-DIG-AP antibody (Roche) 1:4000 in blocking solution at 4 °C overnight. Excess antibody was removed by 10 × 15 min washes in PBT+0.2% TritonX100+0.1%BSA. After equilibration in NTMT (100mM Tris pH9.5; 100mM NaCl; 50mM MgCl2; 0.1% Tween 20) buffer, staining with NBT/BCiP (Roche) in NTMT was carried out at RT. Imaging was conducted on a Nikon Eclipse E800 compound microscope with a Nikon Digital Sight DSU3 camera.
High speed video microscopy of cilia of the mouse tracheal epithelium
Mouse trachea were dissected and imaged as described in (Francis and Lo, 2013). Trachea were removed from mice and submerged in L15 medium (Gibco). The lumen was flushed with L15 medium 2–3 times and the trachea was cut into 3–4 rings using a transverse cut. The rings were cut longitudinally through the middle of the trachealis muscle and then through he tracheal cartilage opposite the trachealis muscle leaving two half-circle pieces of tissue for imaging.
The C-shaped tissue samples were transferred, lumen side down, to a glass bottom dish. A 0.5mm silicone sheet with a hole in the center was used as a spacer to create a well for the tissue. A coverslip was placed on top of the sample and videos of beating cilia were captured on a Nikon Ti with PFS3 inverted microscope using a Andor Zyla 5.2 camera.
Human subject phenotyping
PCD phenotype was characterized by standard clinical diagnostic criteria and documentation of typical symptoms such as neonatal respiratory distress and signs of chronic oto-sinu-pulmonary infections with development of bronchiectasis. Clinical diagnosis included nasal nitric oxide (NO) measurement, medical imaging (X-Ray), high speed video microscopy (HVMA), transmission electron microscopy (TEM) as well as immunofluorescence analysis (IF) to analyze ciliary structure and function. The value of nasal NO was measured using a CLD88 chemiluminescence NO analyzer (EcoMedics, Duernten, Switzerland) during an exhalation-against-resistance maneuver. Nasal NO production rate in nl/min was calculated as follows: nasal NO (nl/min) = measured NO value (parts per billion) × sampling rate (ml/min) (American Thoracic Society and European Respiratory Society, 2005). For HVMA, epithelial cells obtained by nasal brush biopsy were washed in cell culture medium and spread on glass slides. Ciliary beating was immediately recorded at a 640 × 480 pixel resolution and 120–150 frames per second using a scA640-120 fm digital high speed video camera (Basler, Ahrensburg, Germany) mounted on an Axio Vert. A1 inverted phase-contrast microscope (Carl Zeiss, Jena, Germany). Analysis of ciliary beat frequency and beating pattern were performed using the SAVA imaging analysis system (Sisson et al., 2003) (Ammons Engineering, Mt. Morris, MI).
Haplotype analysis, genome-wide SNP mapping, whole exome sequencing and Sanger sequencing
DNA was isolated using standard methods directly from blood samples. Haplotype analysis and genome-wide single nucleotide polymorphism (SNP) mapping were performed as previously described (Olbrich et al., 2012): Genotyping was performed with the GeneChip Human Mapping 10K Array v.2.0 (Affymetrix, Santa Clara, CA). Exome sequencing of genomic DNA was performed at the Cologne Center for Genomics (CCG). For enrichment, the NimbleGen SeqCap EZ Human Exome Library v2.0 was used. Enriched preparations were sequenced with the HiSeq2000 platform (Illumina, San Diago, CA) as paired end 2× 100 bp reads. Sequencing reads that passed quality filtering were mapped to the reference genome sequence (hg19). Variants were analyzed using the varbank software (Cologne Center for Genomics) (Olbrich et al., 2015). In addition to the c224-1delG mutation described above (see Results), two other SNPs were detected in ENKUR that segregated with the disease phenotype (Table S7). These SNPs have allele frequencies of 3% and 5%, indicating that they do not cause rare phenotypes like situs inversus. To analyze all ENKUR exons including the exon intron boundaries PCR amplification of genomic fragments was performed with 30 ng DNA using 30 pmol of primers (see Table S9 for primers), 120 μmol of dNTPs, 1.5mM MgCl2, and 1.5 U GoTaq DNA polymerase (Promega, Madison, WI) in a total volume of 50 μl under the following cycling conditions: Initial denaturation for 4 minutes at 94°C, 30 cycles comprising denaturation at 94°C for 30 seconds, annealing of primers for 30 seconds at 60°C, and elongation of primers for 1 minute at 72°C, additionally a final elongation at 72°C for 10 minutes was performed. Products were checked for the right size by agarose gel electrophoresis and purified using ExoSap-IT (Affymetrix, Santa Clara, CA). Bidirectional Sanger sequencing reaction was performed using BigDye Terminator v3.1 Cycle Sequencing kit (Applied Biosystems, Foster City, CA) and sequences were read out on a 3730xl DNA Analyzer (Applied Biosystems, Foster City, CA) (Tarkar et al., 2013).
QUANTIFICATION AND STATISTICAL ANALYSIS
GraphPad Prism software was used to perform statistical analysis for qPCR data. Error bars represent standard deviations from 6 technical replicates. For mass spectrometry analysis, ProteinProspector data was filtered using a maximum protein expectation value of 0.01 and a maximum peptide expectation value of 0.05. For homozygosity matting, the program Graphical Relationship Representation (Abecasis et al., 2001a) was used to calculate relationship errors. Mendelian and non-Mendelian errors were detected using PedCheck (O’Connell and Weeks, 1998)and MERLIN (Abecasis et al., 2001b), respectively. For linkage analysis a disease gene frequency of 0.0001, an autosomal-recessive inheritance and full penetrance were assumed. The programs ALLEGRO (Gudbjartsson et al., 2000) and HaploPainter (Thiele and Nürnberg, 2005) were utilized for calculation of multipoint LOD scores and graphical presentation, respectively. The ALOHOMORA (Rüschendorf and Nürnberg, 2005) interface served as platform for all data handling.
DATA AND SOFTWARE AVAILABILITY
Raw LC-MS data is available for download at PRIDE Archive: https://www.ebi.ac.uk/pride/archive/
Submission reference: 1-20170531-41317
Supplementary Material
Table S1. Candidate ciliary proteins identified by mass spectrometry, Related toFigure 1 and Table 1.
Descriptions of the source of samples analyzed by mass spectrometry and the type of chromatography applied are listed in the ‘Sample Key’ sheet. The protein accession numbers and associated number of unique peptides identified from each indicated sample by mass spectrometry analysis are listed in the sheets ‘S. purpuratus,’ ‘N. vectensis’ and ‘S. rosetta.’ The ENSEMBL IDs, gene names, descriptions and number of control experiments in which the corresponding protein was detected is listed in the sheet ‘Crapome proteins removed.’ Proteins identified in over 70 control proteomics experiments were not considered further. The mouse and human ENSEMBL IDs, gene names and descriptions of the protein homologs of the proteins identified in the sea urchin, sea anemone and choanoflagellate ciliomes are listed in the ‘Mammalian homologs’ sheet. Genes corresponding to proteins detected in the ciliomes of at least two of the three organisms analyzed are considered to be high confidence ciliome members (blue background). Also listed are heritable diseases associated with each gene according to OMIM, Orphanet and DDG2P, whether it is a member of the SYSCILIA Gold Standard gene set, and whether it has been previously implicated in ciliary biology by the 19 publications listed in Table S4. These data are summarized in Table 1.
Table S2. Sea urchin membrane plus matrix enrichment analysis, Related to Figure 2.
The accession numbers of the S. purpuratus proteins identified in the cilia fractions with the number of unique peptides per fraction. The membrane plus matrix enrichment score and mouse homolog for each S. purpuratus protein represented in the heat map in Figure 2. See methods for explanation of score calculation. ‘Early’ indicates early gastrula stage, ‘Late’ indicates late gastrula stage, ‘Wh’ indicates whole cilia, ‘Ax’ indicates axoneme, and ‘M/M’ indicates membrane plus matrix.
Table S3. SYSCILIA Gold Standard and Chlamydomonas ciliome comparisons, Related to Table 1.
The human ciliary SYSCILIA Gold Standard proteins and the InParanoid orthogroup number for for S. purpuratus (Spur), N. vectensis (Nvec), S. rosetta (Sros) containing the human ortholog are listed in the ‘SYSCILIA’ sheet. The accession number of the ortholog is listed if present in the ciliome. Accession numbers and descriptions of all S. rosetta ciliome proteins are listed in the ‘Choano-Chlamy’ sheet. Also included are the gene model numbers, descriptions and alternative names of their C. reinhardtii homologs (as defined by BLAST expected value ≥ e−5), if present in the C. reinhardtii ciliary proteome (Pazour et al., 2005).
Table S4. 19 studies used to compare conserved ciliome to previously identified ciliary proteins, Related to Table 1.
A list of the 19 publications used for comparison to the conserved ciliome. Included are the organisms used for each study and the organism’s classification.
Table S5. Proteins screened for ciliary localization, Related to Figure 3.
A list of the proteins randomly selected, as described in Methods, from the high-confidence ciliome or human proteome for fusion with GFP and assessment of subcellular localization in IMCD3 cells. Human and mouse gene symbols, description, ENSEMBL number of the mouse gene are included.
Table S6. Comparison of the phylogenetic distribution of ciliome genes, Related to Figure 4
CLustering by Inferred Models of Evolution (CLIME) analysis of ciliome genes to define a phylogenetic distribution among ciliated and unciliated organisms listed in Figure S2. Ciliome members that display a profile closely aligned with ciliation are listed as “Coevolved with cilia.” Ciliome members whose phylogenetic distribution moderately align with ciliation are listed as “Intermediate.” Ciliome members whose phylogenetic distribution do not align with ciliation are listed as “Not coevolved with cilia.”
Table S7. Enkur sequencing in human patients and PCD genes sequenced, Related to Figure 7.
Sanger sequencing results of Enkur and PCD genes from two human individuals with situs inversus and their parents.
Table S8. Ciliary beat frequencies and nasal NO measurements in affected Enkur individuals, Related to Figure 7.
Nasal nitric oxide (NO) production rates and ciliary beat frequencies from nasal epithelial cell cilia of the two human individuals with situs inversus. The normal range and cut-off level for PCD are listed.
Table S9. Primers used in this study, Related to STAR methods.
Movie S1. High-speed video microscopy of human nasal epithelial cell cilia from healthy control individual and OP-1605 II3, Related to Figure 7.
Movie S2. High-speed video microscopy of Enkur+/− and Enkur−/− mouse tracheal epithelial cell cilia, Related to Figure 6.
Highlights.
Evolutionary proteomics identifies conserved ciliary proteins
Ciliary regulators of Hh, GPCR and TRP channel signaling evolved before bilateria
ENKUR localizes to motile cilia and is required for left/rigth axis patterning
Mutation of ENKUR causes situs inversus in humans
Acknowledgments
We thank Fred Wilt and Christopher Killian for providing sea urchin embryos for initial experiments and for guidance with sea urchin husbandry, Stefan Materna for sea urchin husbandry assistance, Nicole King for providing the choanoflagellate culture line and for experimental advice, Daniel Richter, Tera Levin and Pawel Burkhardt for counsel on choanoflagellate culture and experiments, Hannah Elzinga for cloning a choanoflagellate gene, Harvey Florman for sharing the ENKUR mutant mice, David R. McClay and Esther Miranda for L. variegatus embryos and the UCSF Nikon Imaging Center for providing microscopes and imaging assistance. We thank the PCD individuals and their families for participating in this study and acknowledge the German patient support group “Kartagener Syndrom und Primaere Ciliaere Dyskinesie e.V.” We thank H. Olbrich and N.T. Loges for fruitful discussions and M. Herting, B. Lechtape, A. Robbers, D. Ernst, L. Overkamp, K. Wohlgemuth and F.J. Seesing for excellent technical assistance, G. Nürnberg and P. Nürnberg for homozygosity mapping data, and the Exome Aggregation Consortium (ExAC) for creating their exome variant database.
This work was supported by grants from the NIH (AR054396 and GM095941) and from the Burroughs Wellcome Fund, the Packard Foundation, and the Sandler Family Supporting Foundation to J.F.R. Work in the lab of H.O. was supported by the Deutsche Forschungsgemeinschaft (OL/450-1 (H. Olbrich) and OM 6/4, OM 6/7, and OM6/8 (H. Omran), Interdisziplinären Zentrum für Klinische Forschung Muenster grant Om2/009/12 and Om2/015/16 (H. Omran), European Commission grant FP7/2007–2013 grant agreement (GA) 262055 (H. Omran) as a Transnational Access project of the European Sequencing and Genotyping Infrastructure, EU-FP7 programs SYSCILIA GA 241955 and BESTCILIA GA 305404 (H. Omran), the Eva Luise und Horst Köhler Stiftung and Kindness for Kids.
Footnotes
Publisher's Disclaimer: This is a PDF file of an unedited manuscript that has been accepted for publication. As a service to our customers we are providing this early version of the manuscript. The manuscript will undergo copyediting, typesetting, and review of the resulting proof before it is published in its final citable form. Please note that during the production process errors may be discovered which could affect the content, and all legal disclaimers that apply to the journal pertain.
Author Contributions
Conceptualization, M.A.S. and J.F.R.
Methodology, M.A.S., H.O., J.J., N.K. F.R., J.B.W., H.M.F. and J.F.R.
Investigation, M.A.S., T.M., J.J., C.L., M.K.J., S.P.C., G.G.3rd, H.B., G.D., P.P., C.W.
Resources, H.O., N.K. F.R., J.B.W. and J.F.R.
Writing – Original Draft, M.A.S. and J.F.R.
Writing – Review & Editing, M.A.S., J.F.R., T.M., and F.R.
References
- Abecasis GR, Cherny SS, Cookson WOC, Cardon LR. GRR: graphical representation of relationship errors. Bioinformatics. 2001a;17:742–743. doi: 10.1093/bioinformatics/17.8.742. [DOI] [PubMed] [Google Scholar]
- Abecasis GAR, Cherny SS, Cookson WO, Cardon LR. Merlin: rapid analysis of dense genetic maps using sparse gene flow trees. Nat Genet. 2001b;30:97–101. doi: 10.1038/ng786. [DOI] [PubMed] [Google Scholar]
- Adamska M, Matus DQ, Adamski M, Green K, Rokhsar DS, Martindale MQ, Degnan BM. The evolutionary origin of hedgehog proteins. Curr Biol. 2007;17:R836–R837. doi: 10.1016/j.cub.2007.08.010. [DOI] [PubMed] [Google Scholar]
- Afzelius BA. A human syndrome caused by immotile cilia. Science. 1976;193:317–319. doi: 10.1126/science.1084576. [DOI] [PubMed] [Google Scholar]
- American Thoracic Society and European Respiratory Society. ATS/ERS Recommendations for Standardized Procedures for the Online and Offline Measurement of Exhaled Lower Respiratory Nitric Oxide and Nasal Nitric Oxide, 2005. Am J Respir Crit Care Med. 2005;171:912–930. doi: 10.1164/rccm.200406-710ST. [DOI] [PubMed] [Google Scholar]
- Ansley SJ, Badano JL, Blacque OE, Hill J, Hoskins BE, Leitch CC, Kim JC, Ross AJ, Eichers ER, Teslovich TM, et al. Basal body dysfunction is a likely cause of pleiotropic Bardet-Biedl syndrome. Nature. 2003;425:628–633. doi: 10.1038/nature02030. [DOI] [PubMed] [Google Scholar]
- Auclair W, Siegel BW. Cilia regeneration in the sea urchin embryo: evidence for a pool of ciliary proteins. Science. 1966;154:913–915. doi: 10.1126/science.154.3751.913. [DOI] [PubMed] [Google Scholar]
- Avidor-Reiss T, Maer AM, Koundakjian E, Polyanovsky A, Keil T, Subramaniam S, Zuker CS. Decoding cilia function: defining specialized genes required for compartmentalized cilia biogenesis. Cell. 2004;117:527–539. doi: 10.1016/s0092-8674(04)00412-x. [DOI] [PubMed] [Google Scholar]
- Babu D, Roy S. Left-right asymmetry: cilia stir up new surprises in the node. Open Biology. 2013;3:130052–130052. doi: 10.1098/rsob.130052. [DOI] [PMC free article] [PubMed] [Google Scholar]
- Becker-Heck A, Zohn IE, Okabe N, Pollock A, Lenhart KB, Sullivan-Brown J, McSheene J, Loges NT, Olbrich H, Haeffner K, et al. The coiled-coil domain containing protein CCDC40 is essential for motile cilia function and left-right axis formation. Nat Genet. 2011;43:79–84. doi: 10.1038/ng.727. [DOI] [PMC free article] [PubMed] [Google Scholar]
- Blacque OE, Perens EA, Boroevich KA, Inglis PN, Li C, Warner A, Khattra J, Holt RA, Ou G, Mah AK, et al. Functional genomics of the cilium, a sensory organelle. Curr Biol. 2005;15:935–941. doi: 10.1016/j.cub.2005.04.059. [DOI] [PubMed] [Google Scholar]
- Bloodgood RA. Sensory reception is an attribute of both primary cilia and motile cilia. Journal of Cell Science. 2010;123:505–509. doi: 10.1242/jcs.066308. [DOI] [PubMed] [Google Scholar]
- Boesger J, Wagner V, Weisheit W, Mittag M. Analysis of flagellar phosphoproteins from Chlamydomonas reinhardtii. Eukaryotic Cell. 2009;8:922–932. doi: 10.1128/EC.00067-09. [DOI] [PMC free article] [PubMed] [Google Scholar]
- Broadhead R, Dawe HR, Farr H, Griffiths S, Hart SR, Portman N, Shaw MK, Ginger ML, Gaskell SJ, McKean PG, et al. Flagellar motility is required for the viability of the bloodstream trypanosome. Nature. 2006;440:224–227. doi: 10.1038/nature04541. [DOI] [PubMed] [Google Scholar]
- Camacho C, Coulouris G, Avagyan V, Ma N, Papadopoulos J, Bealer K, Madden TL. BLAST+: architecture and applications. BMC Bioinformatics. 2009;10:421. doi: 10.1186/1471-2105-10-421. [DOI] [PMC free article] [PubMed] [Google Scholar]
- Cao W, Gerton GL, Moss SB. Proteomic profiling of accessory structures from the mouse sperm flagellum. Mol Cell Proteomics. 2006;5:801–810. doi: 10.1074/mcp.M500322-MCP200. [DOI] [PubMed] [Google Scholar]
- Caparrós-Martín JA, Valencia M, Reytor E, Pacheco M, Fernandez M, Perez-Aytes A, Gean E, Lapunzina P, Peters H, Goodship JA, et al. The ciliary Evc/Evc2 complex interacts with Smo and controls Hedgehog pathway activity in chondrocytes by regulating Sufu/Gli3 dissociation and Gli3 trafficking in primary cilia. Hum Mol Genet. 2013;22:124–139. doi: 10.1093/hmg/dds409. [DOI] [PubMed] [Google Scholar]
- Carvalho-Santos Z, Azimzadeh J, Pereira-Leal JB, Bettencourt-Dias M. Evolution: Tracing the origins of centrioles, cilia, and flagella. The Journal of Cell Biology. 2011;194:165–175. doi: 10.1083/jcb.201011152. [DOI] [PMC free article] [PubMed] [Google Scholar]
- Casey JP, Brennan K, Scheidel N, McGettigan P, Lavin PT, Carter S, Ennis S, Dorkins H, Ghali N, Blacque OE, et al. Recessive NEK9 mutation causes a lethal skeletal dysplasia with evidence of cell cycle and ciliary defects. Hum Mol Genet. 2016;25:1824–1835. doi: 10.1093/hmg/ddw054. [DOI] [PubMed] [Google Scholar]
- Chávez M, Ena S, Van Sande J, de Kerchove d’Exaerde A, Schurmans S, Schiffmann SN. Modulation of Ciliary Phosphoinositide Content Regulates Trafficking and Sonic Hedgehog Signaling Output. Developmental Cell. 2015;34:338–350. doi: 10.1016/j.devcel.2015.06.016. [DOI] [PubMed] [Google Scholar]
- Chen N, Mah A, Blacque OE, Chu J, Phgora K, Bakhoum MW, Newbury CRH, Khattra J, Chan S, Go A, et al. Identification of ciliary and ciliopathy genes in Caenorhabditis elegans through comparative genomics. Genome Biol. 2006;7:R126. doi: 10.1186/gb-2006-7-12-r126. [DOI] [PMC free article] [PubMed] [Google Scholar]
- Chen Y, Sasai N, Ma G, Yue T, Jia J, Briscoe J, Jiang J. Sonic Hedgehog dependent phosphorylation by CK1α and GRK2 is required for ciliary accumulation and activation of smoothened. PLoS Biol. 2011;9:e1001083. doi: 10.1371/journal.pbio.1001083. [DOI] [PMC free article] [PubMed] [Google Scholar]
- Choksi SP, Babu D, Lau D, Yu X, Roy S. Systematic discovery of novel ciliary genes through functional genomics in the zebrafish. Development. 2014;141:3410–3419. doi: 10.1242/dev.108209. [DOI] [PMC free article] [PubMed] [Google Scholar]
- Clauser KR, Baker P, Burlingame AL. Role of accurate mass measurement (+/−10 ppm) in protein identification strategies employing MS or MS/MS and database searching. Anal Chem. 1999;71:2871–2882. doi: 10.1021/ac9810516. [DOI] [PubMed] [Google Scholar]
- Collignon J, Varlet I, Robertson EJ. Relationship between asymmetric nodal expression and the direction of embryonic turning. Nature. 1996;381:155–158. doi: 10.1038/381155a0. [DOI] [PubMed] [Google Scholar]
- Chung MIl, Peyrot SM, LeBoeuf S, Park TJ, McGary KL, Marcotte EM, Wallingford JB. RFX2 is broadly required for ciliogenesis during vertebrate development. Dev Biol. 2012 Mar 1;363(1):155–65. doi: 10.1016/j.ydbio.2011.12.029. Epub 2011 Dec 29. [DOI] [PMC free article] [PubMed] [Google Scholar]
- Dayel MJ, Alegado RA, Fairclough SR, Levin TC, Nichols SA, Mcdonald K, King N. Cell differentiation and morphogenesis in the colony-forming choanoflagellate Salpingoeca rosetta. Dev Biol. 2011 doi: 10.1016/j.ydbio.2011.06.003. [DOI] [PMC free article] [PubMed] [Google Scholar]
- Deane JA, Cole DG, Seeley ES, Diener DR, Rosenbaum JL. Localization of intraflagellar transport protein IFT52 identifies basal body transitional fibers as the docking site for IFT particles. Curr Biol. 2001;11:1586–1590. doi: 10.1016/s0960-9822(01)00484-5. [DOI] [PubMed] [Google Scholar]
- Delling M, DeCaen PG, Doerner JF, Febvay S, Clapham DE. Primary cilia are specialized calcium signalling organelles. Nature. 2013;504:311–314. doi: 10.1038/nature12833. [DOI] [PMC free article] [PubMed] [Google Scholar]
- Dorn KV, Hughes CE, Rohatgi R. A smoothened-evc2 complex transduces the hedgehog signal at primary cilia. Developmental Cell. 2012;23:823–835. doi: 10.1016/j.devcel.2012.07.004. [DOI] [PMC free article] [PubMed] [Google Scholar]
- Dougherty GW, Loges NT, Klinkenbusch JA, Olbrich H, Pennekamp P, Menchen T, Raidt J, Wallmeier J, Werner C, Westermann C, et al. DNAH11 Localization in the Proximal Region of Respiratory Cilia Defines Distinct Outer Dynein Arm Complexes. Am J Respir Cell Mol Biol. 2016;55:213–224. doi: 10.1165/rcmb.2015-0353OC. [DOI] [PMC free article] [PubMed] [Google Scholar]
- Efimenko E, Bubb K, Mak HY, Holzman T, Leroux MR, Ruvkun G, Thomas JH, Swoboda P. Analysis of xbx genes in C. elegans. Development. 2005;132:1923–1934. doi: 10.1242/dev.01775. [DOI] [PubMed] [Google Scholar]
- Evron T, Philipp M, Lu J, Meloni AR, Burkhalter M, Chen W, Caron MG. Growth Arrest Specific 8 (Gas8) and G protein-coupled receptor kinase 2 (GRK2) cooperate in the control of Smoothened signaling. J Biol Chem. 2011;286:27676–27686. doi: 10.1074/jbc.M111.234666. [DOI] [PMC free article] [PubMed] [Google Scholar]
- Fairclough SR, Dayel MJ, King N. Multicellular development in a choanoflagellate. Curr Biol. 2010;20:R875–R876. doi: 10.1016/j.cub.2010.09.014. [DOI] [PMC free article] [PubMed] [Google Scholar]
- Fliegauf M, Olbrich H, Horvath J, Wildhaber JH, Zariwala MA, Kennedy M, Knowles MR, Omran H. Mislocalization of DNAH5 and DNAH9 in respiratory cells from patients with primary ciliary dyskinesia. Am J Respir Crit Care Med. 2005;171:1343–1349. doi: 10.1164/rccm.200411-1583OC. [DOI] [PMC free article] [PubMed] [Google Scholar]
- Francis R, Lo C. Ex vivo method for high resolution imaging of cilia motility in rodent airway epithelia. J Vis Exp. 2013 doi: 10.3791/50343. [DOI] [PMC free article] [PubMed] [Google Scholar]
- Fritzenwanker JH, Technau U. Induction of gametogenesis in the basal cnidarian Nematostella vectensis(Anthozoa) Dev Genes Evol. 2002;212:99–103. doi: 10.1007/s00427-002-0214-7. [DOI] [PubMed] [Google Scholar]
- Garcia-Gonzalo FR, Phua SC, Roberson EC, Garcia G, Abedin M, Schurmans S, Inoue T, Reiter JF. Phosphoinositides Regulate Ciliary Protein Trafficking to Modulate Hedgehog Signaling. Developmental Cell. 2015;34:400–409. doi: 10.1016/j.devcel.2015.08.001. [DOI] [PMC free article] [PubMed] [Google Scholar]
- Gießl A, Pulvermüller A, Trojan P, Park JH, Choe HW, Ernst OP, Hofmann KP, Wolfrum U. Differential expression and interaction with the visual G-protein transducin of centrin isoforms in mammalian photoreceptor cells. J Biol Chem. 2004;279:51472–51481. doi: 10.1074/jbc.M406770200. [DOI] [PubMed] [Google Scholar]
- Goetz SC, Anderson KV. The primary cilium: a signalling centre during vertebrate development. Nat Rev Genet. 2010;11:331–344. doi: 10.1038/nrg2774. [DOI] [PMC free article] [PubMed] [Google Scholar]
- Gökirmak T, Campanale JP, Shipp LE, Moy GW, Tao H, Hamdoun A. Localization and substrate selectivity of sea urchin multidrug (MDR) efflux transporters. J Biol Chem. 2012;287:43876–43883. doi: 10.1074/jbc.M112.424879. [DOI] [PMC free article] [PubMed] [Google Scholar]
- Gong Yl, Mo C, Fraser SE. Planar cell polarity signalling controls cell division orientation during zebrafish gastrulation. Nature. 2004;430:689–93. doi: 10.1038/nature02796. [DOI] [PubMed] [Google Scholar]
- Gudbjartsson DF, Jonasson K, Frigge ML, Kong A. Allegro, a new computer program for multipoint linkage analysis. Nat Genet. 2000;25:12–13. doi: 10.1038/75514. [DOI] [PubMed] [Google Scholar]
- Hand C, Uhlinger K. The culture, sexual and asexual reproduction, and growth of the sea anemone Nematostella vectensis. Biological Bulletin. 1992;182:169–176. doi: 10.2307/1542110. [DOI] [PubMed] [Google Scholar]
- Held K, Voets T, Vriens J. TRPM3 in temperature sensing and beyond. Temperature (Austin) 2015;2:201–213. doi: 10.4161/23328940.2014.988524. [DOI] [PMC free article] [PubMed] [Google Scholar]
- Hildebrandt F, Benzing T, Katsanis N. Ciliopathies. N Engl J Med. 2011;364:1533–1543. doi: 10.1056/NEJMra1010172. [DOI] [PMC free article] [PubMed] [Google Scholar]
- Hilgendorf KI, Johnson CT, Jackson PK. The primary cilium as a cellular receiver: organizing ciliary GPCR signaling. Current Opinion in Cell Biology. 2016;39:84–92. doi: 10.1016/j.ceb.2016.02.008. [DOI] [PMC free article] [PubMed] [Google Scholar]
- Hirsh AE, Fraser HB. Protein dispensability and rate of evolution. Nature. 2001;411:1046–1049. doi: 10.1038/35082561. [DOI] [PubMed] [Google Scholar]
- Hjeij R, Onoufriadis A, Watson CM, Slagle CE, Klena NT, Dougherty GW, Kurkowiak M, Loges NT, Diggle CP, Morante NFC, et al. CCDC151 mutations cause primary ciliary dyskinesia by disruption of the outer dynein arm docking complex formation. Am J Hum Genet. 2014;95:257–274. doi: 10.1016/j.ajhg.2014.08.005. [DOI] [PMC free article] [PubMed] [Google Scholar]
- Ishikawa H, Thompson J, Yates JR, III, Marshall WF. Proteomic Analysis of Mammalian Primary Cilia. Curr Biol. 2012:1–6. doi: 10.1016/j.cub.2012.01.031. [DOI] [PMC free article] [PubMed] [Google Scholar]
- Kastury K, Taylor WE, Shen R, Arver S, Gutierrez M, Fisher CE, Coucke PJ, Van Hauwe P, Van Camp G, Bhasin S. Complementary deoxyribonucleic acid cloning and characterization of a putative human axonemal dynein light chain gene. J Clin Endocrinol Metab. 1997;82:3047–3053. doi: 10.1210/jcem.82.9.4242. [DOI] [PubMed] [Google Scholar]
- King N, Westbrook MJ, Young SL, Kuo A, Abedin M, Chapman J, Fairclough S, Hellsten U, Isogai Y, Letunic I, et al. The genome of the choanoflagellate Monosiga brevicollis and the origin of metazoans. Nature. 2008;451:783–788. doi: 10.1038/nature06617. [DOI] [PMC free article] [PubMed] [Google Scholar]
- King N, Young SL, Abedin M, Carr M, Leadbeater BSC. Starting and maintaining Monosiga brevicollis cultures. Cold Spring Harb Protoc. 2009;2009 doi: 10.1101/pdb.prot5148. pdb.prot5148. [DOI] [PubMed] [Google Scholar]
- Kott E, Duquesnoy P, Copin B, Legendre M, Dastot-Le Moal F, Montantin G, Jeanson L, Tamalet A, Papon JF, Siffroi JP, et al. Loss-of-function mutations in LRRC6, a gene essential for proper axonemal assembly of inner and outer dynein arms, cause primary ciliary dyskinesia. Am J Hum Genet. 2012;91:958–964. doi: 10.1016/j.ajhg.2012.10.003. [DOI] [PMC free article] [PubMed] [Google Scholar]
- Kuhlmann K, Tschapek A, Wiese H, Eisenacher M, Meyer HE, Hatt HH, Oeljeklaus S, Warscheid B. The membrane proteome of sensory cilia to the depth of olfactory receptors. Mol Cell Proteomics. 2014;13:1828–1843. doi: 10.1074/mcp.M113.035378. [DOI] [PMC free article] [PubMed] [Google Scholar]
- Laurençon A, Dubruille R, Efimenko E, Grenier G, Bissett R, Cortier E, Rolland V, Swoboda P, Durand B. Identification of novel regulatory factor X (RFX) target genes by comparative genomics in Drosophila species. Genome Biol. 2007;8:R195. doi: 10.1186/gb-2007-8-9-r195. [DOI] [PMC free article] [PubMed] [Google Scholar]
- LeDizet M, Piperno G. The light chain p28 associates with a subset of inner dynein arm heavy chains in Chlamydomonas axonemes. Mol Biol Cell. 1995;6:697–711. doi: 10.1091/mbc.6.6.697. [DOI] [PMC free article] [PubMed] [Google Scholar]
- Li JB, Gerdes JM, Haycraft CJ, Fan Y, Teslovich TM, May-Simera H, Li H, Blacque OE, Li L, Leitch CC, et al. Comparative genomics identifies a flagellar and basal body proteome that includes the BBS5 human disease gene. Cell. 2004;117:541–552. doi: 10.1016/s0092-8674(04)00450-7. [DOI] [PubMed] [Google Scholar]
- Li S, Li S, Han Y, Tong C, Wang B, Chen Y, Jiang J. Regulation of Smoothened Phosphorylation and High-Level Hedgehog Signaling Activity by a Plasma Membrane Associated Kinase. PLoS Biol. 2016;14:e1002481. doi: 10.1371/journal.pbio.1002481. [DOI] [PMC free article] [PubMed] [Google Scholar]
- Li Y, Calvo SE, Gutman R, Liu JS, Mootha VK. Expansion of biological pathways based on evolutionary inference. Cell. 2014;158:213–225. doi: 10.1016/j.cell.2014.05.034. [DOI] [PMC free article] [PubMed] [Google Scholar]
- Liu Q, Tan G, Levenkova N, Li T, Pugh EN, Rux JJ, Speicher DW, Pierce EA. The proteome of the mouse photoreceptor sensory cilium complex. Mol Cell Proteomics. 2007;6:1299–1317. doi: 10.1074/mcp.M700054-MCP200. [DOI] [PMC free article] [PubMed] [Google Scholar]
- Livak KJ, Schmittgen TD. Analysis of relative gene expression data using real-time quantitative PCR and the 2(-Delta Delta C(T)) Method. Methods. 2001;25:402–408. doi: 10.1006/meth.2001.1262. [DOI] [PubMed] [Google Scholar]
- Loges NT, Olbrich H, Becker-Heck A, Häffner K, Heer A, Reinhard C, Schmidts M, Kispert A, Zariwala MA, Leigh MW, et al. Deletions and point mutations of LRRC50 cause primary ciliary dyskinesia due to dynein arm defects. Am J Hum Genet. 2009;85:883–889. doi: 10.1016/j.ajhg.2009.10.018. [DOI] [PMC free article] [PubMed] [Google Scholar]
- Lowe LA, Supp DM, Sampath K, Yokoyama T, Wright CV, Potter SS, Overbeek P, Kuehn MR. Conserved left-right asymmetry of nodal expression and alterations in murine situs inversus. Nature. 1996;381:158–161. doi: 10.1038/381158a0. [DOI] [PubMed] [Google Scholar]
- Lundberg JO, Weitzberg E, Nordvall SL, Kuylenstierna R, Lundberg JM, Alving K. Primarily nasal origin of exhaled nitric oxide and absence in Kartagener’s syndrome. Eur Respir J. 1994;7:1501–1504. doi: 10.1183/09031936.94.07081501. [DOI] [PubMed] [Google Scholar]
- Malicki JJ, Johnson CA. The Cilium: Cellular Antenna and Central Processing Unit. Trends Cell Biol. 2016 doi: 10.1016/j.tcb.2016.08.002. [DOI] [PMC free article] [PubMed] [Google Scholar]
- Marques S. The activity of the Nodal antagonist Cerl-2 in the mouse node is required for correct L/R body axis. Genes & Development. 2004;18:2342–2347. doi: 10.1101/gad.306504. [DOI] [PMC free article] [PubMed] [Google Scholar]
- Marszalek JR, Ruiz-Lozano P, Roberts E, Chien KR, Goldstein LS. Situs inversus and embryonic ciliary morphogenesis defects in mouse mutants lacking the KIF3A subunit of kinesin-II. Proc Natl Acad Sci USA. 1999;96:5043–5048. doi: 10.1073/pnas.96.9.5043. [DOI] [PMC free article] [PubMed] [Google Scholar]
- Mayer U, Ungerer N, Klimmeck D, Warnken U, Schnölzer M, Frings S, Möhrlen F. Proteomic analysis of a membrane preparation from rat olfactory sensory cilia. Chem Senses. 2008;33:145–162. doi: 10.1093/chemse/bjm073. [DOI] [PubMed] [Google Scholar]
- McGrath J, Somlo S, Makova S, Tian X, Brueckner M. Two populations of node monocilia initiate left-right asymmetry in the mouse. Cell. 2003;114:61–73. doi: 10.1016/s0092-8674(03)00511-7. [DOI] [PubMed] [Google Scholar]
- Mellacheruvu D, Wright Z, Couzens AL, Lambert JP, St-Denis NA, Li T, Miteva YV, Hauri S, Sardiu ME, Low TY, et al. The CRAPome: a contaminant repository for affinity purification-mass spectrometry data. Nat Methods. 2013;10:730–736. doi: 10.1038/nmeth.2557. [DOI] [PMC free article] [PubMed] [Google Scholar]
- Meno C, Ito Y, Saijoh Y, Matsuda Y, Tashiro K, Kuhara S, Hamada H. Two closely-related left-right asymmetrically expressed genes, lefty-1 and lefty-2: their distinct expression domains, chromosomal linkage and direct neuralizing activity in Xenopus embryos. Genes Cells. 1997;2:513–524. doi: 10.1046/j.1365-2443.1997.1400338.x. [DOI] [PubMed] [Google Scholar]
- Meno C, Saijoh Y, Fujii H, Ikeda M, Yokoyama T, Yokoyama M, Toyoda Y, Hamada H. Left-right asymmetric expression of the TGF beta-family member lefty in mouse embryos. Nature. 1996;381:151–155. doi: 10.1038/381151a0. [DOI] [PubMed] [Google Scholar]
- Merchant SS, Prochnik SE, Vallon O, Harris EH, Karpowicz SJ, Witman GB, Terry A, Salamov A, Fritz-Laylin LK, Maréchal-Drouard L, et al. The Chlamydomonas genome reveals the evolution of key animal and plant functions. Science. 2007;318:245–250. doi: 10.1126/science.1143609. [DOI] [PMC free article] [PubMed] [Google Scholar]
- Merveille AC, Davis EE, Becker-Heck A, Legendre M, Amirav I, Bataille G, Belmont J, Beydon N, Billen F, Clément A, et al. CCDC39 is required for assembly of inner dynein arms and the dynein regulatory complex and for normal ciliary motility in humans and dogs. Nat Genet. 2011;43:72–78. doi: 10.1038/ng.726. [DOI] [PMC free article] [PubMed] [Google Scholar]
- Mick DU, Rodrigues RB, Leib RD, Adams CM, Chien AS, Gygi SP, Nachury MV. Proteomics of Primary Cilia by Proximity Labeling. Developmental Cell. 2015:1–17. doi: 10.1016/j.devcel.2015.10.015. [DOI] [PMC free article] [PubMed] [Google Scholar]
- Mitchison HM, Schmidts M, Loges NT, Freshour J, Dritsoula A, Hirst RA, O’Callaghan C, Blau H, Dabbagh Al M, Olbrich H, et al. Mutations in axonemal dynein assembly factor DNAAF3 cause primary ciliary dyskinesia. Nat Genet. 2012;44:381–389. S1–S2. doi: 10.1038/ng.1106. [DOI] [PMC free article] [PubMed] [Google Scholar]
- Mukhopadhyay S, Wen X, Ratti N, Loktev A, Rangell L, Scales SJ, Jackson PK. The ciliary G-protein-coupled receptor Gpr161 negatively regulates the Sonic hedgehog pathway via cAMP signaling. Cell. 2013;152:210–223. doi: 10.1016/j.cell.2012.12.026. [DOI] [PubMed] [Google Scholar]
- Nakamura T, Saito D, Kawasumi A, Shinohara K, Asai Y, Takaoka K, Dong F, Takamatsu A, Belo JA, Mochizuki A, et al. Fluid flow and interlinked feedback loops establish left-right asymmetric decay of Cerl2 mRNA. Nature Communications. 2012;3:1322. doi: 10.1038/ncomms2319. [DOI] [PubMed] [Google Scholar]
- Narita K, Kozuka-Hata H, Nonami Y, Ao-Kondo H, Suzuki T, Nakamura H, Yamakawa K, Oyama M, Inoue T, Takeda S. Proteomic analysis of multiple primary cilia reveals a novel mode of ciliary development in mammals. Biology Open. 2012 doi: 10.1242/bio.20121081. [DOI] [PMC free article] [PubMed] [Google Scholar]
- Narita K, Kawate T, Kakinuma N, Takeda S. Multiple Primary Cilia Modulate the Fluid Transcytosis in Choroid Plexus Epithelium. Traffic. 2010;11:287–301. doi: 10.1111/j.1600-0854.2009.01016.x. [DOI] [PubMed] [Google Scholar]
- Nonaka S, Tanaka Y, Okada Y, Takeda S, Harada A, Kanai Y, Kido M, Hirokawa N. Randomization of left-right asymmetry due to loss of nodal cilia generating leftward flow of extraembryonic fluid in mice lacking KIF3B motor protein. Cell. 1998;95:829–837. doi: 10.1016/s0092-8674(00)81705-5. [DOI] [PubMed] [Google Scholar]
- O’Connell JR, Weeks DE. PedCheck: a program for identification of genotype incompatibilities in linkage analysis. Am J Hum Genet. 1998;63:259–266. doi: 10.1086/301904. [DOI] [PMC free article] [PubMed] [Google Scholar]
- Olbrich H, Cremers C, Loges NT, Werner C, Nielsen KG, Marthin JK, Philipsen M, Wallmeier J, Pennekamp P, Menchen T, et al. Loss-of-Function GAS8 Mutations Cause Primary Ciliary Dyskinesia and Disrupt the Nexin-Dynein Regulatory Complex. Am J Hum Genet. 2015;97:546–554. doi: 10.1016/j.ajhg.2015.08.012. [DOI] [PMC free article] [PubMed] [Google Scholar]
- Olbrich H, Schmidts M, Werner C, Onoufriadis A, Loges NT, Raidt J, Banki NF, Shoemark A, Burgoyne T, Turki Al S, et al. Recessive HYDIN mutations cause primary ciliary dyskinesia without randomization of left-right body asymmetry. Am J Hum Genet. 2012;91:672–684. doi: 10.1016/j.ajhg.2012.08.016. [DOI] [PMC free article] [PubMed] [Google Scholar]
- Omran H, Kobayashi D, Olbrich H, Tsukahara T, Loges NT, Hagiwara H, Zhang Q, Leblond G, O’Toole E, Hara C, et al. Ktu/PF13 is required for cytoplasmic pre-assembly of axonemal dyneins. Nature. 2008a;456:611–616. doi: 10.1038/nature07471. [DOI] [PMC free article] [PubMed] [Google Scholar]
- Omran H, Kobayashi D, Olbrich H, Tsukahara T, Loges NT, Hagiwara H, Zhang Q, Leblond G, O’Toole E, Hara C, et al. Ktu/PF13 is required for cytoplasmic pre-assembly of axonemal dyneins. Nature. 2008b;456:611–616. doi: 10.1038/nature07471. [DOI] [PMC free article] [PubMed] [Google Scholar]
- Ostrowski LE, Blackburn K, Radde KM, Moyer MB, Schlatzer DM, Moseley A, Boucher RC. A proteomic analysis of human cilia: identification of novel components. Mol Cell Proteomics. 2002;1:451–465. doi: 10.1074/mcp.m200037-mcp200. [DOI] [PubMed] [Google Scholar]
- Pal K, Hwang SH, Somatilaka B, Badgandi H, Jackson PK, DeFea K, Mukhopadhyay S. Smoothened determines β-arrestin-mediated removal of the G protein-coupled receptor Gpr161 from the primary cilium. The Journal of Cell Biology. 2016;212:861–875. doi: 10.1083/jcb.201506132. [DOI] [PMC free article] [PubMed] [Google Scholar]
- Pan J, Snell WJ. Signal transduction during fertilization in the unicellular green alga, Chlamydomonas. Current Opinion in Microbiology. 2000;3:596–602. doi: 10.1016/s1369-5274(00)00146-6. [DOI] [PubMed] [Google Scholar]
- Pazour GJ, Agrin N, Leszyk J, Witman GB. Proteomic analysis of a eukaryotic cilium. The Journal of Cell Biology. 2005;170:103–113. doi: 10.1083/jcb.200504008. [DOI] [PMC free article] [PubMed] [Google Scholar]
- Pennekamp P, Karcher C, Fischer A, Schweickert A, Skryabin B, Horst J, Blum M, Dworniczak B. The ion channel polycystin-2 is required for left-right axis determination in mice. Curr Biol. 2002;12:938–943. doi: 10.1016/s0960-9822(02)00869-2. [DOI] [PubMed] [Google Scholar]
- Pincus D, Letunic I, Bork P, Lim WA. Evolution of the phospho-tyrosine signaling machinery in premetazoan lineages. Proc Natl Acad Sci USA. 2008;105:9680–9684. doi: 10.1073/pnas.0803161105. [DOI] [PMC free article] [PubMed] [Google Scholar]
- Pires-daSilva A, Sommer RJ. The evolution of signalling pathways in animal development. Nat Rev Genet. 2003;4:39–49. doi: 10.1038/nrg977. [DOI] [PubMed] [Google Scholar]
- Pusapati GV, Hughes CE, Dorn KV, Zhang D, Sugianto P, Aravind L, Rohatgi R. EFCAB7 and IQCE regulate hedgehog signaling by tethering the EVC-EVC2 complex to the base of primary cilia. Developmental Cell. 2014;28:483–496. doi: 10.1016/j.devcel.2014.01.021. [DOI] [PMC free article] [PubMed] [Google Scholar]
- Raidt J, Wallmeier J, Hjeij R, Onnebrink JG, Pennekamp P, Loges NT, Olbrich H, Häffner K, Dougherty GW, Omran H, et al. Ciliary beat pattern and frequency in genetic variants of primary ciliary dyskinesia. Eur Respir J. 2014;44:1579–1588. doi: 10.1183/09031936.00052014. [DOI] [PubMed] [Google Scholar]
- Ramage HR, Kumar GR, Verschueren E, Johnson JR, Dollen Von J, Johnson T, Newton B, Shah P, Horner J, Krogan NJ, et al. A combined proteomics/genomics approach links hepatitis C virus infection with nonsense-mediated mRNA decay. Mol Cell. 2015;57:329–340. doi: 10.1016/j.molcel.2014.12.028. [DOI] [PMC free article] [PubMed] [Google Scholar]
- Rentzsch F, Fritzenwanker JH, Scholz CB, Technau U. FGF signalling controls formation of the apical sensory organ in the cnidarian Nematostella vectensis. Development. 2008;135:1761–1769. doi: 10.1242/dev.020784. [DOI] [PubMed] [Google Scholar]
- Roosing S, Rohrschneider K, Beryozkin A, Sharon D, Weisschuh N, Staller J, Kohl S, Zelinger L, Peters TA, Neveling K, et al. Mutations in RAB28, encoding a farnesylated small GTPase, are associated with autosomal-recessive cone-rod dystrophy. Am J Hum Genet. 2013;93:110–117. doi: 10.1016/j.ajhg.2013.05.005. [DOI] [PMC free article] [PubMed] [Google Scholar]
- Rorick NK, Kinoshita A, Weirather JL, Peyrard-Janvid M, de Lima RLLF, Dunnwald M, Shanske AL, Moretti-Ferreira D, Koillinen H, Kere J, et al. Genomic strategy identifies a missense mutation in WD-repeat domain 65 (WDR65) in an individual with Van der Woude syndrome. Am J Med Genet A. 2011;155A:1314–1321. doi: 10.1002/ajmg.a.33980. [DOI] [PMC free article] [PubMed] [Google Scholar]
- Ruiz-Perez VL, Ide SE, Strom TM, Lorenz B, Wilson D, Woods K, King L, Francomano C, Freisinger P, Spranger S, et al. Mutations in a new gene in Ellis-van Creveld syndrome and Weyers acrodental dysostosis. Nat Genet. 2000;24:283–286. doi: 10.1038/73508. [DOI] [PubMed] [Google Scholar]
- Rüschendorf F, Nürnberg P. ALOHOMORA: a tool for linkage analysis using 10K SNP array data. Bioinformatics. 2005;21:2123–2125. doi: 10.1093/bioinformatics/bti264. [DOI] [PubMed] [Google Scholar]
- Saijoh Y, Oki S, Ohishi S, Hamada H. Left-right patterning of the mouse lateral plate requires nodal produced in the node. Dev Biol. 2003;256:160–172. doi: 10.1016/s0012-1606(02)00121-5. [DOI] [PubMed] [Google Scholar]
- Sanders MA, Salisbury JL. Centrin plays an essential role in microtubule severing during flagellar excision in Chlamydomonas reinhardtii. Jcb. 1994;124:795–805. doi: 10.1083/jcb.124.5.795. [DOI] [PMC free article] [PubMed] [Google Scholar]
- Satir P, Christensen ST. Overview of structure and function of mammalian cilia. Annu Rev Physiol. 2007;69:377–400. doi: 10.1146/annurev.physiol.69.040705.141236. [DOI] [PubMed] [Google Scholar]
- Schweickert A, Vick P, Getwan M, Weber T, Schneider I, Eberhardt M, Beyer T, Pachur A, Blum M. The nodal inhibitor Coco is a critical target of leftward flow in Xenopus. Curr Biol. 2010;20:738–743. doi: 10.1016/j.cub.2010.02.061. [DOI] [PubMed] [Google Scholar]
- Shah AS, Ben-Shahar Y, Moninger TO, Kline JN, Welsh MJ. Motile cilia of human airway epithelia are chemosensory. Science. 2009;325:1131–1134. doi: 10.1126/science.1173869. [DOI] [PMC free article] [PubMed] [Google Scholar]
- Sisson JH, Stoner JA, Ammons BA, Wyatt TA. All-digital image capture and whole-field analysis of ciliary beat frequency. Journal of Microscopy. 2003;211:103–111. doi: 10.1046/j.1365-2818.2003.01209.x. [DOI] [PubMed] [Google Scholar]
- Sive HL, Grainger RM, Harland RM. Early Development of Xenopus laevis: A Laboratory Manual 2000 [Google Scholar]
- Smith JC, Northey JGB, Garg J, Pearlman RE, Siu KWM. Robust method for proteome analysis by MS/MS using an entire translated genome: demonstration on the ciliome of Tetrahymena thermophila. J Proteome Res. 2005;4:909–919. doi: 10.1021/pr050013h. [DOI] [PubMed] [Google Scholar]
- Solter KM, Gibor A. Evidence for role of flagella as sensory transducers in mating of Chlamydomonas reinhardi. Nature. 1977;265:444–445. doi: 10.1038/265444a0. [DOI] [PubMed] [Google Scholar]
- Sonnhammer ELL, Östlund G. In Paranoid 8: orthology analysis between 273 proteomes, mostly eukaryotic. Nucleic Acids Res. 2015;43:D234–D239. doi: 10.1093/nar/gku1203. [DOI] [PMC free article] [PubMed] [Google Scholar]
- Stephens RE. Isolation of embryonic cilia and sperm flagella. Methods Cell Biol. 1986;27:217–227. doi: 10.1016/s0091-679x(08)60350-7. [DOI] [PubMed] [Google Scholar]
- Stephens RE. Ciliogenesis in sea urchin embryos–a subroutine in the program of development. Bioessays. 1995;17:331–340. doi: 10.1002/bies.950170409. [DOI] [PubMed] [Google Scholar]
- Supp DM, Brueckner M, Kuehn MR, Witte DP, Lowe LA, McGrath J, Corrales J, Potter SS. Targeted deletion of the ATP binding domain of left-right dynein confirms its role in specifying development of left-right asymmetries. Development. 1999;126:5495–5504. doi: 10.1242/dev.126.23.5495. [DOI] [PMC free article] [PubMed] [Google Scholar]
- Sutton KA, Jungnickel MK, Wang Y, Cullen K, Lambert S, Florman HM. Enkurin is a novel calmodulin and TRPC channel binding protein in sperm. Dev Biol. 2004;274:426–435. doi: 10.1016/j.ydbio.2004.07.031. [DOI] [PubMed] [Google Scholar]
- Takeda S, Yonekawa Y, Tanaka Y, Okada Y, Nonaka S, Hirokawa N. Left-right asymmetry and kinesin superfamily protein KIF3A: new insights in determination of laterality and mesoderm induction by kif3A−/− mice analysis. Jcb. 1999;145:825–836. doi: 10.1083/jcb.145.4.825. [DOI] [PMC free article] [PubMed] [Google Scholar]
- Tarkar A, Loges NT, Slagle CE, Francis R, Dougherty GW, Tamayo JV, Shook B, Cantino M, Schwartz D, Jahnke C, et al. DYX1C1 is required for axonemal dynein assembly and ciliary motility. Nat Genet. 2013;45:995–1003. doi: 10.1038/ng.2707. [DOI] [PMC free article] [PubMed] [Google Scholar]
- Thiele H, Nürnberg P. HaploPainter: a tool for drawing pedigrees with complex haplotypes. Bioinformatics. 2005;21:1730–1732. doi: 10.1093/bioinformatics/bth488. [DOI] [PubMed] [Google Scholar]
- Thompson GA, Baugh LC, Walker LF. Nonlethal deciliation of Tetrahymena by a local anesthetic and its utility as a tool for studying cilia regeneration. Jcb. 1974;61:253–257. doi: 10.1083/jcb.61.1.253. [DOI] [PMC free article] [PubMed] [Google Scholar]
- Tisler M, Wetzel F, Mantino S, Kremnyov S, Thumberger T, Schweickert A, Blum M, Vick P. Cilia are required for asymmetric nodal induction in the sea urchin embryo. BMC Dev Biol. 2016;16:28. doi: 10.1186/s12861-016-0128-7. [DOI] [PMC free article] [PubMed] [Google Scholar]
- Toriyama M, Lee C, Taylor SP, Duran I, Cohn DH, Bruel AL, Tabler JM, Drew K, Kelly MR, Kim S, et al. The ciliopathy-associated CPLANE proteins direct basal body recruitment of intraflagellar transport machinery. Nat Genet. 2016;48:648–656. doi: 10.1038/ng.3558. [DOI] [PMC free article] [PubMed] [Google Scholar]
- Uhlén M, Fagerberg L, Hallström BM, Lindskog C, Oksvold P, Mardinoglu A, Sivertsson Å, Kampf C, Sjöstedt E, Asplund A, et al. Proteomics. Tissue-based map of the human proteome. Science. 2015;347:1260419. doi: 10.1126/science.1260419. [DOI] [PubMed] [Google Scholar]
- van Dam TJ, Wheway G, Slaats GG, SYSCILIA Study Group. Huynen MA, Giles RH. The SYSCILIA gold standard (SCGSv1) of known ciliary components and its applications within a systems biology consortium. Cilia. 2013;2:7. doi: 10.1186/2046-2530-2-7. [DOI] [PMC free article] [PubMed] [Google Scholar]
- Vick P, Schweickert A, Weber T, Eberhardt M, Mencl S, Shcherbakov D, Beyer T, Blum M. Flow on the right side of the gastrocoel roof plate is dispensable for symmetry breakage in the frog Xenopus laevis. Dev Biol. 2009;331:281–291. doi: 10.1016/j.ydbio.2009.05.547. [DOI] [PubMed] [Google Scholar]
- Villefranc JA, Amigo J, Lawson ND. Gateway compatible vectors for analysis of gene function in the zebrafish. Dev Dyn. 2007;236:3077–3087. doi: 10.1002/dvdy.21354. [DOI] [PMC free article] [PubMed] [Google Scholar]
- Vladar EK, Brody SL. Analysis of ciliogenesis in primary culture mouse tracheal epithelial cells. Meth Enzymol. 2013;525:285–309. doi: 10.1016/B978-0-12-397944-5.00014-6. [DOI] [PubMed] [Google Scholar]
- Wallmeier J, Al-Mutairi DA, Chen CT, Loges NT, Pennekamp P, Menchen T, Ma L, Shamseldin HE, Olbrich H, Dougherty GW, et al. Mutations in CCNO result in congenital mucociliary clearance disorder with reduced generation of multiple motile cilia. Nat Genet. 2014;46:646–651. doi: 10.1038/ng.2961. [DOI] [PubMed] [Google Scholar]
- Wan C, Borgeson B, Phanse S, Tu F, Drew K, Clark G, Xiong X, Kagan O, Kwan J, Bezginov A, et al. Panorama of ancient metazoan macromolecular complexes. Nature. 2015;525:339–344. doi: 10.1038/nature14877. [DOI] [PMC free article] [PubMed] [Google Scholar]
- Wang Q, Pan J, Snell WJ. Intraflagellar transport particles participate directly in cilium-generated signaling in Chlamydomonas. Cell. 2006;125:549–562. doi: 10.1016/j.cell.2006.02.044. [DOI] [PubMed] [Google Scholar]
- Warner JF, McCarthy AM, Morris RL, McClay DR. Hedgehog signaling requires motile cilia in the sea urchin. Molecular Biology and Evolution. 2013 doi: 10.1093/molbev/mst176. [DOI] [PMC free article] [PubMed] [Google Scholar]
- Warner JF, Miranda EL, McClay DR. Contribution of hedgehog signaling to the establishment of left-right asymmetry in the sea urchin. Dev Biol. 2016;411:314–324. doi: 10.1016/j.ydbio.2016.02.008. [DOI] [PMC free article] [PubMed] [Google Scholar]
- Witman GB. Isolation of Chlamydomonas flagella and flagellar axonemes. Meth Enzymol. 1986;134:280–290. doi: 10.1016/0076-6879(86)34096-5. [DOI] [PubMed] [Google Scholar]
- Witman GB, Carlson K, Berliner J, Rosenbaum JL. Chlamydomonas flagella. I. Isolation and electrophoretic analysis of microtubules, matrix, membranes, and mastigonemes. Jcb. 1972;54:507–539. doi: 10.1083/jcb.54.3.507. [DOI] [PMC free article] [PubMed] [Google Scholar]
- Wright CF, Fitzgerald TW, Jones WD, Clayton S, McRae JF, van Kogelenberg M, King DA, Ambridge K, Barrett DM, Bayzetinova T, et al. Genetic diagnosis of developmental disorders in the DDD study: a scalable analysis of genome-wide research data. Lancet. 2015;385:1305–1314. doi: 10.1016/S0140-6736(14)61705-0. [DOI] [PMC free article] [PubMed] [Google Scholar]
- Yang C, Chen W, Chen Y, Jiang J. Smoothened transduces Hedgehog signal by forming a complex with Evc/Evc2. Cell Res. 2012;22:1593–1604. doi: 10.1038/cr.2012.134. [DOI] [PMC free article] [PubMed] [Google Scholar]
- Yang X, Boehm JS, Yang X, Salehi-Ashtiani K, Hao T, Shen Y, Lubonja R, Thomas SR, Alkan O, Bhimdi T, et al. A public genome-scale lentiviral expression library of human ORFs. Nat Methods. 2011;8:659–661. doi: 10.1038/nmeth.1638. [DOI] [PMC free article] [PubMed] [Google Scholar]
- Ye X, Song G, Fan M, Shi L, Jabs EW, Huang S, Guo R, Bian Z. A novel heterozygous deletion in the EVC2 gene causes Weyers acrofacial dysostosis. Hum Genet. 2006;119:199–205. doi: 10.1007/s00439-005-0129-2. [DOI] [PubMed] [Google Scholar]
- Yoshiba S, Shiratori H, Kuo IY, Kawasumi A, Shinohara K, Nonaka S, Asai Y, Sasaki G, Belo JA, Sasaki H, et al. Cilia at the Node of Mouse Embryos Sense Fluid Flow for Left-Right Determination via Pkd2. Science. 2012 doi: 10.1126/science.1222538. [DOI] [PMC free article] [PubMed] [Google Scholar]
- You Y, Brody SL. Culture and Differentiation of Mouse Tracheal Epithelial Cells In Methods in Molecular Biology. Totowa, NJ: Humana Press; 2012. pp. 123–143. [DOI] [PubMed] [Google Scholar]
- Young SAM, Miyata H, Satouh Y, Kato H, Nozawa K, Isotani A, Aitken RJ, Baker MA, Ikawa M. CRISPR/Cas9-Mediated Rapid Generation of Multiple Mouse Lines Identified Ccdc63 as Essential for Spermiogenesis. Int J Mol Sci. 2015;16:24732–24750. doi: 10.3390/ijms161024732. [DOI] [PMC free article] [PubMed] [Google Scholar]
Associated Data
This section collects any data citations, data availability statements, or supplementary materials included in this article.
Supplementary Materials
Table S1. Candidate ciliary proteins identified by mass spectrometry, Related toFigure 1 and Table 1.
Descriptions of the source of samples analyzed by mass spectrometry and the type of chromatography applied are listed in the ‘Sample Key’ sheet. The protein accession numbers and associated number of unique peptides identified from each indicated sample by mass spectrometry analysis are listed in the sheets ‘S. purpuratus,’ ‘N. vectensis’ and ‘S. rosetta.’ The ENSEMBL IDs, gene names, descriptions and number of control experiments in which the corresponding protein was detected is listed in the sheet ‘Crapome proteins removed.’ Proteins identified in over 70 control proteomics experiments were not considered further. The mouse and human ENSEMBL IDs, gene names and descriptions of the protein homologs of the proteins identified in the sea urchin, sea anemone and choanoflagellate ciliomes are listed in the ‘Mammalian homologs’ sheet. Genes corresponding to proteins detected in the ciliomes of at least two of the three organisms analyzed are considered to be high confidence ciliome members (blue background). Also listed are heritable diseases associated with each gene according to OMIM, Orphanet and DDG2P, whether it is a member of the SYSCILIA Gold Standard gene set, and whether it has been previously implicated in ciliary biology by the 19 publications listed in Table S4. These data are summarized in Table 1.
Table S2. Sea urchin membrane plus matrix enrichment analysis, Related to Figure 2.
The accession numbers of the S. purpuratus proteins identified in the cilia fractions with the number of unique peptides per fraction. The membrane plus matrix enrichment score and mouse homolog for each S. purpuratus protein represented in the heat map in Figure 2. See methods for explanation of score calculation. ‘Early’ indicates early gastrula stage, ‘Late’ indicates late gastrula stage, ‘Wh’ indicates whole cilia, ‘Ax’ indicates axoneme, and ‘M/M’ indicates membrane plus matrix.
Table S3. SYSCILIA Gold Standard and Chlamydomonas ciliome comparisons, Related to Table 1.
The human ciliary SYSCILIA Gold Standard proteins and the InParanoid orthogroup number for for S. purpuratus (Spur), N. vectensis (Nvec), S. rosetta (Sros) containing the human ortholog are listed in the ‘SYSCILIA’ sheet. The accession number of the ortholog is listed if present in the ciliome. Accession numbers and descriptions of all S. rosetta ciliome proteins are listed in the ‘Choano-Chlamy’ sheet. Also included are the gene model numbers, descriptions and alternative names of their C. reinhardtii homologs (as defined by BLAST expected value ≥ e−5), if present in the C. reinhardtii ciliary proteome (Pazour et al., 2005).
Table S4. 19 studies used to compare conserved ciliome to previously identified ciliary proteins, Related to Table 1.
A list of the 19 publications used for comparison to the conserved ciliome. Included are the organisms used for each study and the organism’s classification.
Table S5. Proteins screened for ciliary localization, Related to Figure 3.
A list of the proteins randomly selected, as described in Methods, from the high-confidence ciliome or human proteome for fusion with GFP and assessment of subcellular localization in IMCD3 cells. Human and mouse gene symbols, description, ENSEMBL number of the mouse gene are included.
Table S6. Comparison of the phylogenetic distribution of ciliome genes, Related to Figure 4
CLustering by Inferred Models of Evolution (CLIME) analysis of ciliome genes to define a phylogenetic distribution among ciliated and unciliated organisms listed in Figure S2. Ciliome members that display a profile closely aligned with ciliation are listed as “Coevolved with cilia.” Ciliome members whose phylogenetic distribution moderately align with ciliation are listed as “Intermediate.” Ciliome members whose phylogenetic distribution do not align with ciliation are listed as “Not coevolved with cilia.”
Table S7. Enkur sequencing in human patients and PCD genes sequenced, Related to Figure 7.
Sanger sequencing results of Enkur and PCD genes from two human individuals with situs inversus and their parents.
Table S8. Ciliary beat frequencies and nasal NO measurements in affected Enkur individuals, Related to Figure 7.
Nasal nitric oxide (NO) production rates and ciliary beat frequencies from nasal epithelial cell cilia of the two human individuals with situs inversus. The normal range and cut-off level for PCD are listed.
Table S9. Primers used in this study, Related to STAR methods.
Movie S1. High-speed video microscopy of human nasal epithelial cell cilia from healthy control individual and OP-1605 II3, Related to Figure 7.
Movie S2. High-speed video microscopy of Enkur+/− and Enkur−/− mouse tracheal epithelial cell cilia, Related to Figure 6.