

Summary
Metabolism is an emerging stem cell hallmark tied to cell fate, pluripotency and self-renewal, yet systems-level understanding of stem cell metabolism has been limited by the lack of genome-scale network models. Here we develop a systems approach to integrate time-course metabolomics data with a computational model of metabolism to analyze the metabolic state of naïve and primed murine pluripotent stem cells. Using this approach, we find that one-carbon metabolism involving phosphoglycerate dehydrogenase, folate-synthesis and nucleotide-synthesis is a key pathway that differs between the two states, resulting in differential sensitivity to anti-folates. The model also predicts that the pluripotency factor Lin28 regulates this one-carbon metabolic pathway, which we validate using metabolomics data from Lin28-deficient cells. Moreover, we identify and validate metabolic reactions related to S-adenosyl-methionine production that can differentially impact histone methylation in naïve and primed cells. Our network-based approach provides a framework for characterizing metabolic changes influencing pluripotency and cell-fate.
Keywords: Systems biology, Stem cell biology, Metabolism, Genome-scale modeling, Pluripotency, Histone methylation
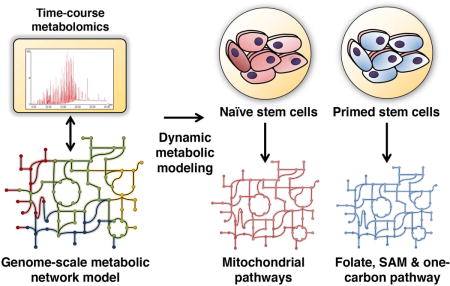
Graphical abstract
Introduction
Pluripotent stem cells are able to self-renew and have the capacity to regenerate all tissues in the human body. Recently, there has been a resurgence of interest in stem cell metabolism due to its role in affecting signaling pathways and epigenetic processes, apart from synthesizing precursors and generating energy for stem cell renewal. Understanding the metabolism of pluripotent stem cells holds promise for understanding early development as well as for regenerative medicine.
Two distinct states of pluripotent stem cells that differ in their developmental potential have been recently described. Naïve murine embryonic stem (ES) cells that closely mirror the inner cell mass of the pre-implantation embryo are maintained in culture with ERK/MEK inhibitor and GSK3 inhibitor (2i) (Nichols and Smith, 2009), whereas primed ES cells derived from the post-implantation embryo are maintained in the presence of FGF2 and Activin (Brons et al., 2007; Tesar et al., 2007). These states also show distinct patterns of metabolism. Naïve cells predominantly employ mitochondrial oxidative metabolism (Huang et al., 2014; Takashima et al., 2014; Zhou et al., 2012), and utilize more glucose and less glutamine to make a-ketoglutarate, which in turn influences histone and DNA methylation (Carey et al., 2015). Human naïve-like cells derived with different protocols also consistently exhibit high oxidative metabolism (Gafni et al., 2013; Takashima et al., 2014; Theunissen et al., 2014; Ware et al., 2014), as well as low S-adenosyl-methionine (SAM) levels due to high consumption that presumably leads to histone hypomethylation (Sperber et al., 2015), a characteristic of the naïve state (Marks et al., 2012). It has been shown that mouse ES cells in LIF/serum media (a metastable state between naïve and primed) utilize threonine to feed the SAM pool for H3K4 methylation (Shyh-Chang et al., 2013), and human ES cells require methionine to maintain pluripotency (Shiraki et al., 2014). However, the role and activity of enzymes involved in one-carbon metabolism, which impacts nucleotide biosynthesis, redox homeostasis and methylation reactions, in two clearly defined naïve and primed pluripotency states of mouse ES cells has not been explored from a systems perspective.
The enormous size and complexity of the mammalian metabolic networks has so far limited systems-level understanding of stem cell metabolism. Expression analysis of metabolic genes or metabolomics can provide a snapshot of the metabolic status, but is limited because gene or metabolite changes often do not reflect the flux of the metabolic reactions. Isotope tracing analysis can determine flux, but only focus on specific metabolic pathways and do not give a systems perspective of the entire network. Pathway enrichment analysis is another commonly used approach to characterize metabolic changes at the systems level (Subramanian et al., 2005; Xia et al., 2015). However, given the highly inter-connected nature of the metabolic network, the underlying assumption behind pathway enrichment analysis that each pathway is independent of each other does not hold for metabolism (Shlomi et al., 2008). Adjacent pathways on the network can influence each other’s activity and altered flux activity can arise due to perturbations upstream of a given pathway. Further, individual enzymes in a pathway do not change coherently as a whole and can have different levels of activity. A systems-level model is thus needed to understand metabolic differences between different cell states at both the individual reaction level and the network level.
Here we use genome-scale computational modeling to comprehensively characterize the metabolism of different pluripotent stem cell states. Genome-scale metabolic network models are manually curated and represent the mechanistic relationships among thousands of genes, proteins and metabolites within a biological system (Bordbar et al., 2014). Recently, genome-scale metabolic models have been integrated with transcriptomics data to identify a subset of metabolic genes that are active in a system. Such transcriptomics-constrained models have been applied successfully to predict metabolic behaviors of human tissues and cancer cells at steady state (Frezza et al., 2011; Uhlén et al., 2015).
Since stem cell metabolic rewiring is dynamic (i.e., not at steady state) and has been known to be regulated at the post-transcriptional level (Zhang et al., 2016), we developed a genome-scale modeling approach to directly infer metabolic states based on time-course metabolomics data. Similar to pathway enrichment analysis where increased levels of metabolites in a pathway suggests increased pathway activity in a condition, we assume that the accumulation or depletion of a metabolite over time as evidence for increased or decreased overall flux activity of the set of reactions involving the metabolite. By integrating data from several metabolites into a unified genome-scale model, we can identify reactions whose differential activity will most likely explain the observed pattern of metabolomic changes.
We first validate this approach by identifying metabolic vulnerabilities of the NCI-60 cancer cell lines. This approach is then applied to characterize murine naïve and primed ES cell metabolic states, and track the metabolic effect of Lin28, a pluripotency factor (Viswanathan and Daley, 2010) associated with the primed state (Zhang et al., 2016). We confirm a transition of mitochondrial metabolism and uncovered an elevation of one-carbon metabolism pathways from naïve to primed state. Using Lin28 knockout pluripotent stem cells as a surrogate of the naive state, we demonstrate a pivotal role of Lin28 in conferring the unique one-carbon and nucleotide metabolism associated with primed pluripotency.
Results
Construction of a dynamic genome-scale metabolic model
Our proposed approach integrates time-course metabolomics data with a genome-scale metabolic network model, and makes use of the flux balance analysis (FBA) framework to infer the metabolic state of a condition (Orth et al., 2010). The FBA approach identifies the optimal flux through each reaction in the metabolic network that maximizes a specific objective such as the growth rate, while satisfying stoichiometric and mass-balance constraints.
The integration of metabolite levels with genome-scale metabolic models has been a significant challenge due to the lack of thermodynamic and kinetic parameters (Cotten et al., 2013; Yizhak et al., 2015). In addition, integrating metabolomics measurements from mammalian systems poses additional challenges due to noise in the data, the undefined nature of serum components in the media, and compartment-specific metabolism. In microbial dynamic flux-balance models, time-course metabolomics measurements are used to explicitly determine metabolite accumulation/depletion rates (Kleessen et al., 2015; Schmidt et al., 2013). In contrast, given the complexity associated with eukaryotic metabolic measurements due to cellular heterogeneity and compartmentalization, our approach uses time-course metabolomics measurements as cues for likelihood of altered flux activity around a metabolite. Our approach tries to identify a metabolic state that best fits the metabolomics data while allowing for deviations from observed pattern of accumulation or depletion of metabolites. Network integration is then used to combine these cues into a global, consistent metabolic state (see Experimental Procedures; Figure 1).
Figure 1. Overview of our approach to integrate time-course metabolomics (intracellular or extracellular) with genome-scale metabolic models to reconstruct the metabolic network of different cell fates.
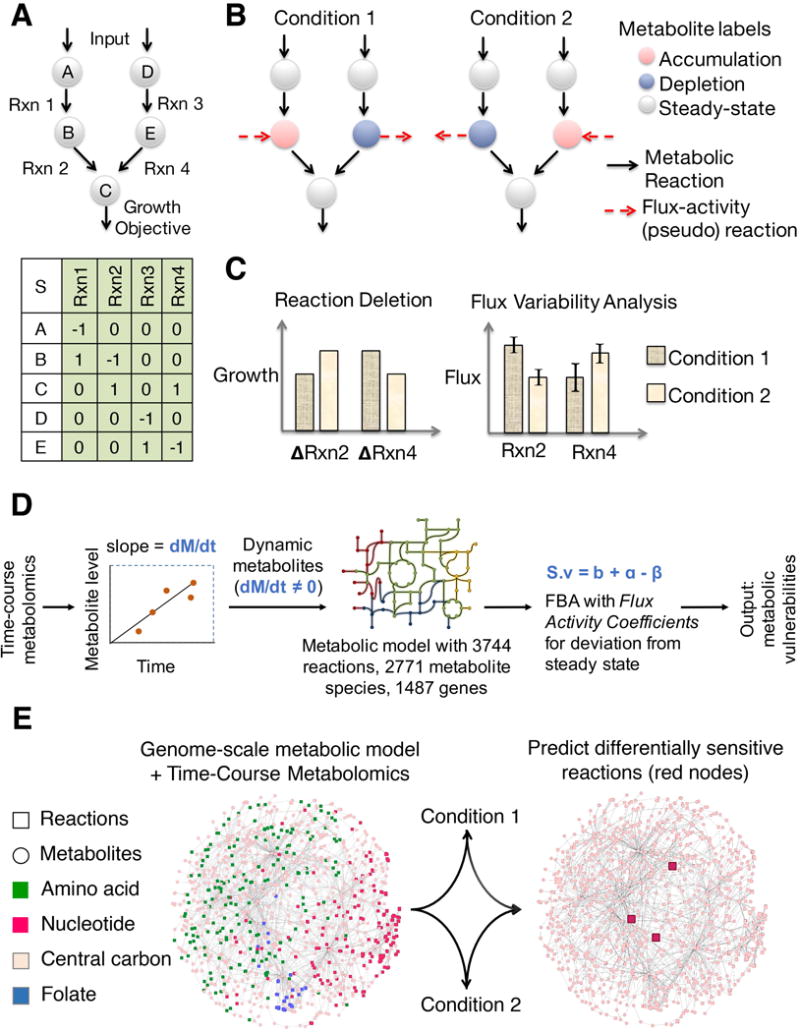
A. A simple metabolic network consisting of two parallel pathways to produce the growth-associated metabolite C is shown, along with its corresponding stoichiometric matrix representation. Deleting Reactions 2 or 4 should impact the biomass production equally in this model. B. Time-course metabolomics data from two different conditions are then overlaid onto the metabolic network model and dynamic metabolites are identified. The accumulation or depletion of metabolites resulting from increased or decreased flux through the reactions involving those metabolites are represented in silico using flux-activity coefficients. A global metabolomics-consistent metabolic network state is determined for each condition. In this case, metabolomics integration reveals a higher flux through Reaction 2 in condition 1 and a higher flux through Reaction 4 in condition 2. C. Differentially-sensitive and differentially active metabolic reactions are determined by performing genome-scale reaction deletion analysis and flux variability analysis. D. Overview of the steps in processing metabolomics data, integration with the metabolic model, and prediction of metabolic vulnerabilities. E. A genome-scale model of metabolism is used to integrate data across hundreds of metabolites to identify differentially sensitive reactions between conditions.
Using our approach, we can infer the impact of the observed differential metabolite levels on the corresponding reaction, the encompassing metabolic pathway, and the entire network of thousands of metabolic reactions. Further, the input data can be either intracellular or extracellular. In the metabolic model, metabolites in each compartment (i.e., extracellular, cytosol, mitochondria, nucleus or other organelles) are distinct from each other. Transport reactions are used to connect metabolites in different compartments. Since the network is unified, the impact of changes in metabolites in any compartment can be predicted on the network. For example, changes in extracellular metabolite levels will impact the uptake or secretion flux of these metabolites, which in turn will impact reactions upstream of these transport reactions. Hence, data from extracellular measurements can be directly utilized to constrain the model using the same mathematical framework used for intracellular metabolites. This approach goes beyond traditional pathway enrichment analysis by creating a genome-scale model of the metabolic state of a system. The in silico model can be subsequently used to simulate deletion of metabolic genes or inhibition of enzymes, in addition to identifying differentially active reactions and pathways.
As a validation of our method in complex mammalian systems, we applied it to predict the metabolic vulnerabilities of the NCI-60 cancer cell lines. The metabolic properties of these cell lines have been characterized using metabolomics collected at two different time points (Jain et al., 2012). Using our approach, we integrated these time-course metabolomics data with a genome-scale model of human metabolism (Duarte et al., 2007) consisting of 1487 genes and 3744 metabolic reactions to map the metabolic state of each of the NCI-60 cell lines.
We simulated deletion of all metabolic genes in the model and predicted the effect of deletion on the growth of the cell. Some genes affected the growth of all the cell lines, while others were more selective for specific cell and tissue type (Figure 2A). We first identified common metabolic vulnerabilities across all 60 cell lines. This was done by identifying genes that when deleted impact growth by at least 5% of the wildtype (Figure 2A; Supplemental Experimental Procedures). Comparing the predicted metabolic vulnerabilities with data from siRNA and CRISPR Cas9 gene knockdown screens (Cheung et al., 2011; Marcotte et al., 2012;,Aguirre et al., 2016) revealed that cell lines were significantly more sensitive to siRNAs targeting these genes compared to other metabolic genes, suggesting that the genes identified by our approach were more likely to be essential to the growth of these cell lines (p-value = 8 × 10⁻³, 2 × 10⁻¹⁵ and 3 × 10⁻³ respectively for siRNA (Cheung et al., 2011; Marcotte et al., 2012) and CRISPR data (Aguirre et al., 2016), one-sided KS-test). As a negative control, prediction using the metabolic model without metabolomics constraint resulted in no significant enrichment.
Figure 2. Validation of our approach to infer metabolic states from time course metabolomics data by applying it to predict the metabolic behavior of NCI 60 cancer cell lines.
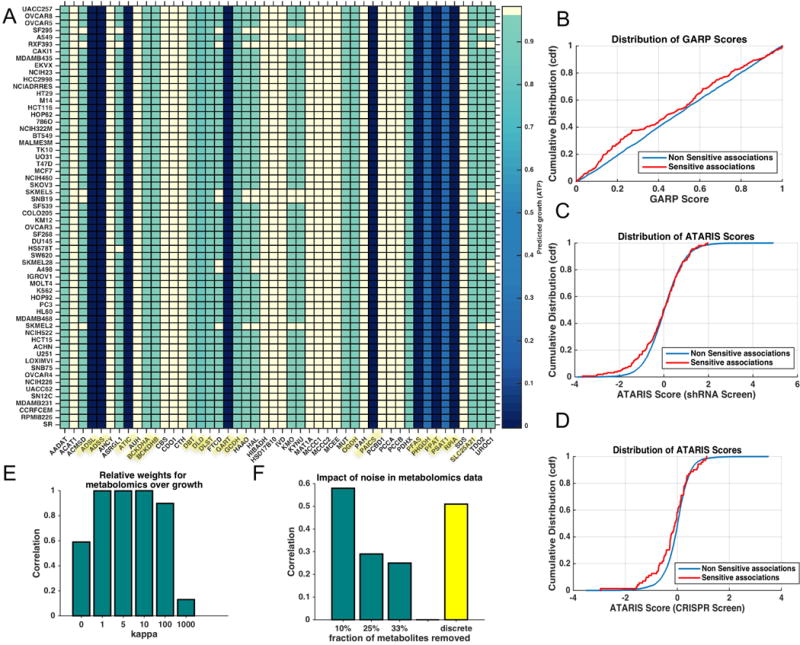
A. Table of cell-line specific metabolic vulnerabilities predicted by our approach. The predicted growth (measured by ATP flux) of 48 differentially sensitive gene knockouts in the NCI60 cell lines is shown relative to wildtype. Highlighted genes affect ATP flux across all cell lines. B. The set of cell line-specific metabolic gene vulnerabilities predicted by our approach were consistent with siRNA screens. The GARP (Gene Activity Rank Profile) scores of genes that were sensitive (vulnerable) in a cell line were found to be lower than those that were not predicted to be sensitive in a given cell line. The lower the GARP score for a given cell line, the more essential is the gene in that particular cell line (data from Koh et al., 2012). The distribution of GARP scores for the sensitive and non-sensitive associations are shown. The distributions were compared using the Kolmogorov-Smirnov test (p-value = 10−6). C. Predictions were also consistent with siRNA knockout screen (p-value (KS-test) = 0.0034; Cheung et al 2016). Distribution of ATARIS (Analytic Technique for Assessment of RNAi by Similarity) z-scores are shown for sensitive and non-sensitive gene knockouts across all cell lines. D. Predictions were also consistent with a CRISPR/Cas9 mediated knockout screen (p-value (KS-test) = 0.0012; Aguirre et al 2016). Distribution of ATARIS z-scores are shown for sensitive and non-sensitive gene knockouts across all cell lines. E. Sensitivity analysis of the dynamic modeling approach. Increasing the weight parameter (kappa) results in increasing weight for the metabolomics data over growth. Correlation with the default settings (kappa = 1, i.e., equal weights for growth and metabolomics) and after changing kappa is shown for the predicted difference in growth between naïve and prime states after deletion of all the 3744 metabolic reactions in the model. F. The approach is robust to noise in the metabolomics data. 10, 25 and 33% of the metabolites in the metabolomics data were randomly removed and the impact on the predictions between naïve and primed state were analyzed. Correlation from predictions using this randomly sampled data with the predictions using the entire data set is shown. Predictions made by using just the direction of change (accumulation or depletion) without the magnitude also gave qualitatively similar predictions as using the entire data (shown as yellow bar).
We next used the integrated model to determine metabolic differences between the cell lines. We identified metabolic genes that were differentially vulnerable in a cell line relative to the remaining cell lines (Figure 2A). These genes were also more likely to be predicted as selectively vulnerable in these cell lines based on both siRNA and CRISPR-Cas9 screens (p-value = 3 × 10⁻³, 1 × 10⁻⁶, and1 × 10−3, respectively for siRNA (Cheung et al., 2011; Marcotte et al., 2012) and CRISPR data (Aguirre et al., 2016), one-sided KS-test) (Figure 2B, 2C and 2D). These results are notable given the variable nature of high-throughput siRNA screens and metabolomics data across different studies. These findings suggest that our approach can accurately capture metabolic differences between cell states using time-course metabolomics data.
Modeling murine naïve and primed ESC metabolism
To characterize the metabolic state of mouse ESCs in naïve and primed states, we measured levels for over 200 metabolites at three time points (Figure 3A). The metabolomics data revealed changes in several metabolites, but these were not specifically related to any one pathway. Pathway enrichment analysis of metabolomics data mirrored this complexity and only two pathways – purine metabolism and urea cycle – were predicted to be differentially active at FDR < 0.05 (Table S1A, S1B). Enrichment analysis of gene expression data of these two states also did not reveal any significant differential activity for a metabolic pathway over the background (FDR < 0.1). Changes in metabolic pathways were masked by strong changes in other pathways such as signaling pathways (Table S1E).
Figure 3. Mapping the metabolic differences between naive and primed stem cells using the computational model of metabolism.
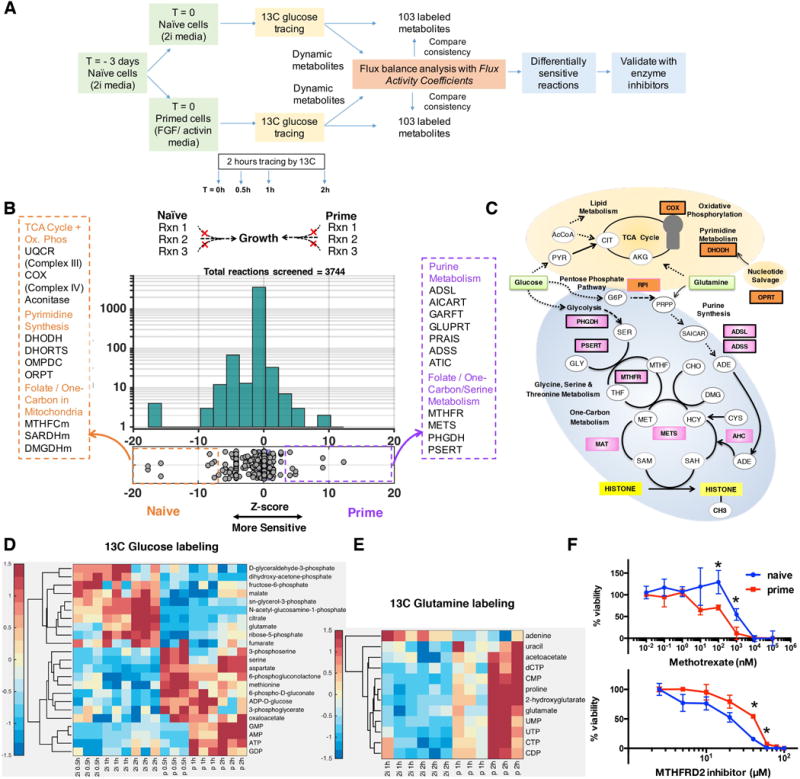
A. Overview of our approach to measure time-course metabolomics data and identify differentially active reactions. B. To identify differentially active metabolic reactions, we performed reaction knockout analysis on the naive and primed metabolic networks. The histogram shows the distribution of growth rates after in silico deletion of all the metabolic reactions. The horizontal x axis shows the relative selectivity of each knockout for naïve state versus the primed state. The stronger the magnitude of selectivity, the greater the difference between the growth rate of the reaction knockout between two states. The majority (96%) of knockouts do not have a differential effect on naive or primed metabolism. The y-axis shows the total number of reactions in each bin. Metabolic reactions that showed the greatest differences in growth between the two states are highlighted. The full list of reactions and their abbreviations are provided in Table S2A. The suffix ‘m’ at the end of each reaction name indicates a reaction occurring in mitochondria; isoforms are represented with numerical suffixes (orange: more sensitive to deletion in naïve; purple: more sensitive to deletion in primed). C. Schematic diagram of the metabolic pathways that are predicted to differ between the two states (Naïve – orange labels, Primed – pink labels) as identified by the model. The thickness of the reaction name label border is proportional to the extent of the differential activity of the reactions between the two states. Reactions predicted to impact SAM flux in prime state (MAT, AHC and METS) are also highlighted (Table S4). D. 13C tracing of glucose revealed that metabolites in the one-carbon and nucleotide metabolism were differentially labeled between the two conditions suggesting re-routing of metabolic flux. The heat map shows the total isotopomers labeled at different time points for each metabolite after z-transformation (Supplemental Experimental Procedures). E. 13C tracing of glutamine revealed that metabolites in nucleotide metabolism were differentially labeled. Metabolites showing significant differences between the two states (p < 0.05) are displayed in D and E heat maps. n=3 for each time point. F. Viability of cells after treatment with the anti-folate methotrexate and the mitochondrial MTHFD2 inhibitor for 2 days. For primed cells, ESCs were treated with FGF2/Activin for 3 days at the time of measurement. Error bars: standard error of mean. n=3. *p<0.05. Error bar means standard error of mean. The viability curves were significantly different between naïve and primed cells for both inhibitors (p-value = 0.01 and 5 × 10⁻⁴ for MTHFD2 inhibitor and Methotrexate respectively, Wilcoxon Signed Rank test).
Given the limited insight from enrichment analysis, we applied our dynamic genome-scale modeling approach to tease out the underlying metabolic differences between the two cell fates. The metabolomics data were then used to create a dynamic genome-scale metabolic model of the naïve and primed state (Figure 3A). We performed deletion analysis of all the metabolic reactions to discover differences between the two metabolic networks (Figure 3B). In addition to reaction deletion analysis, which identified the dominant metabolic differences between the two states, we used flux variability analysis (FVA) to determine the range of feasible fluxes for each reaction based on thermodynamic, stoichiometric and metabolomics constraints (Mahadevan and Schilling, 2003). FVA can capture flux differences in essential reactions, which cannot be inferred through deletion analysis as they are lethal to both states. The combination of reaction deletion analysis and FVA was used to prioritize reactions that showed differential sensitivity and flux activity.
The majority of the 3744 reactions (96%) did not show selectivity between the two states, i.e., their knockout affected both states to the same extent. Among the reactions that were selective, the primed state network was more sensitive to knockout of reactions in folate/SAM/one-carbon metabolism, cysteine-methionine synthesis and purine synthesis, while the naïve state was more sensitive to reactions in oxidative phosphorylation, TCA cycle and pyrimidine synthesis (Figure 3B, 3C). We also observed that reactions in mitochondria were more sensitive in the naïve state. For example, reactions involving folate in the cytoplasm were more active in the primed state, whereas folate reactions in mitochondria were more active in the naïve state (Table S2A, S3A).
Validating predicted metabolic differences between naïve and primed mouse ESCs
Consistent with the in silico predictions, we found using 13C-glucose and 13C-glutamine tracing that in the naïve state, glucose had increased incorporation into the mitochondrial TCA cycle metabolites such as citrate, a-ketoglutarate/glutamate, fumarate and malate, and decreased incorporation into one-carbon metabolism metabolites such as serine, 3-phosphoserine, and methionine; glutamine had decreased incorporation into nucleotides (Figure 3D, 3E and Figure S1A, S1B). Overall, metabolites associated with differentially sensitive reactions were also more likely to be differentially labeled between the two states (p-value = 0.005, hypergeometric test; Figure S1F) confirming the strong concordance between two data sets.
To further assess the importance of folate and one-carbon metabolism predicted by the model, we tested our predictions by using the anti-folate compound methotrexate. Methotrexate is a well-established inhibitor of nucleotide synthesis and folate synthesis that is used by many previous studies (Singh et al., 2006). It inhibits dihydofolate reductase (DHFR), which participates in tetrahydrofolate synthesis and thus impacts de novo synthesis of purines and thymidine. As predicted by the model, primed cells were more sensitive to inhibition by methotrexate (Figure 3F). In contrast, naïve cells were more sensitive to mitochondrial folate metabolism inhibition by the drug MTH-1459 that blocks MTHFD2 activity, also confirming the in silico predictions (Figure 3F).
Decreased one-carbon metabolism in the naïve state might not be caused by reduced glycolysis because 13C incorporation to lactate was not lower in the naïve state (Figure S2D). Furthermore, even though 13C incorporation from glucose to the ribose moiety of nucleotide and nucleoside was lower in naïve cells (Figure 3D and Figure S2C), it was not caused by the pentose phosphate pathway, as metabolites in this pathway were not differentially measured in either state (Figure S2D). On the other hand, 13C incorporation from serine to nucleobase moieties was lower in naïve cells (Figure S2E), indicating one-carbon metabolism through N10-formyl-tetrahydrofolate (f-THF) accounted for reduced nucleotide biosynthesis. 13C incorporation from glutamine to nucleobase moieties through aspartate was also lower in naïve cells (Figure 3E), which could be attributed to lower glutamine incorporation into the TCA cycle (Figure S2B). In summary, these data suggest that the one-carbon metabolism pathway branching from glycolysis is more active in the primed state.
In addition, mRNA transcripts of genes associated with the reactions predicted by the model to be differentially sensitive were also significantly more likely to be differentially expressed (p-value = 0.003, t-test; Figure S1G). While pathway enrichment of transcriptomics data did not identify differential activity of these pathways, analysis of specific transcripts prioritized by the model revealed lower expression of folate pathway genes Mthfd1, Mthfd2, Mthfd2l, Mthfs, Mthfr, Dhfr, and nucleotide biosynthesis pathway genes Adsl, Atic and Gart, in the naïve state cells (Figure S1E). Further assessment of in vivo E4.5 pre-implantation epiblast (naïve) versus E5.5 post-implantation epiblast (primed) also showed lower expression of Phgdh, Psat, Shmt1/2 (serine metabolism), Mthfd1l, Mthfs, Mtfhfd2, Dhfr (folate pathway), Mat2a, Mat1a, Cbs (Methionine/cysteine metabolism), and Adsl, Gart, Tyms, Atic, Paics (nucleotide biosynthesis) (Figure S1H). A dormant state of diapause characteristic of the embryonic epiblast showed the lowest expression of most genes listed above (Figure S1H) (Boroviak et al., 2015). Taken together, these data suggest that mouse naïve state pluripotency is associated with lower one-carbon metabolism and glutamine metabolism required for nucleotide biosynthesis.
Tracking metabolic network rewiring by Lin28
We next examined the metabolic state of naïve induced pluripotent stem cells (iPSCs) cultured in LIF/2i condition depleted of Lin28. Lin28 knockout cells show elevated naïve state features compared with wildtype cells; they have defects in priming and do not grow well in the primed condition (FGF2/Activin). Indeed, our prior analysis has indicated that Lin28-deficient cells represent a surrogate for the naïve state metabotype (Zhang et al., 2016).
With the same approach using time-course metabolomics data and reaction deletion analysis, we discovered similar metabolic differences in one-carbon, oxidative phosphorylation and nucleotide metabolism between Lin28 knockout and wildtype cells (Table S2B, S3B). Lin28 knockout cells were more sensitive to deletion of reactions in the mitochondria, and less sensitive to deletion of one-carbon metabolism reactions, reminiscent of the naïve state compared with the primed state (Figure 4A-C). The comparison between Lin28 knockout cells and wildtype cells (both in 2i) differed from the comparison between naïve cells and primed cells in the activity of the pentose phosphate pathway (Figure 4D). This analysis also revealed the importance of the nucleotide salvage pathway in Lin28 knockout cells, with reactions in purine salvage and purine cycle pathways such as Hgprt, predicted to have higher flux in Lin28 knockout cells (Figure 4A, 4B). This could explain a previous report that these cells are deficient in de novo nucleotide biosynthesis and addition of nucleotides in the media rescues this phenotype (Zhang et al., 2016). Time-course analysis of 13C-glucose incorporation also showed lower flux to nucleotides in Lin28 knockout cells (Figure 4C, Figure S1C). In addition, 13C-glutamine tracing revealed knockout cells had lower flux to nucleotide, similar to the 2i naïve state (Figure 4C, Figure S1D).
Figure 4. Mapping the metabolic differences of Lin28 knockout versus wildtype PSCs using the computational model of metabolism.
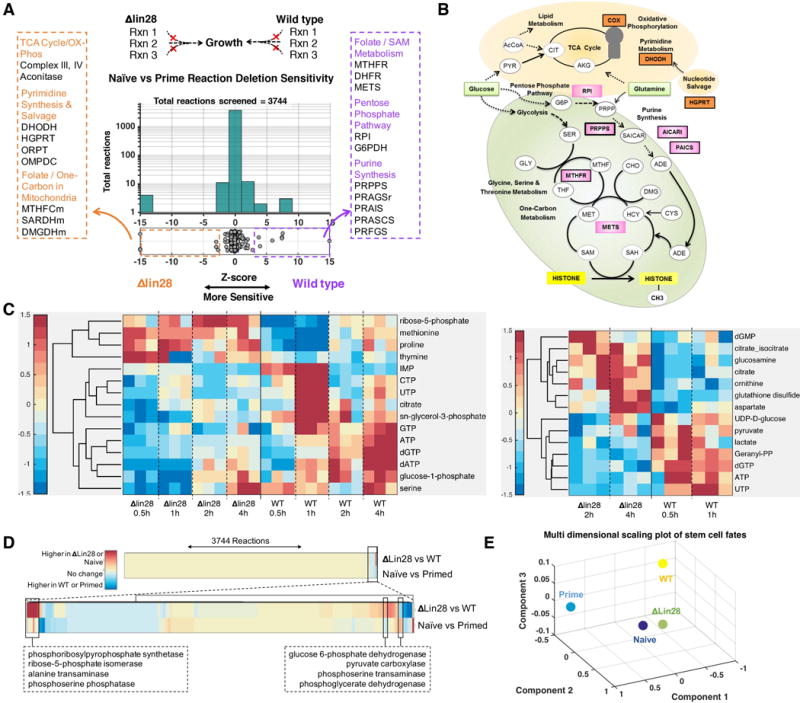
A. The histogram shows the distribution of growth rates after in silico deletion of all the metabolic reactions. The horizontal x-axis shows the relative effect of each gene knockout on the growth rate of Lin28 knockout versus wild type cells (selectivity). The y-axis shows the total number of reactions in each bin. Top pathways with multiple differential reactions are highlighted; see Table S2B for the full list of reactions (Naïve – orange, Primed – purple). B. Schematic diagram of the metabolic pathways that are predicted to differ between the two states (Wildtype – orange labels, ΔLin28 – pink labels) as identified by the model. The thickness of the reaction label border is proportional to the extent of the differential activity of the reactions between the two states. C. Left, 13C tracing of glucose revealed that metabolites downstream of the PHGDH, MTR, MTHFR, UMPS and DHODH pathways were differentially labeled between the two conditions suggesting re-wiring of the metabolic network of these two states. Right, 13C tracing of glutamine revealed that glutamine flux is routed towards nucleotide metabolism in wildtype cells. Metabolites that are differentially labeled (p < 0.05) are displayed in both heat maps. n=3 for each time point. The heat maps show the total isotopomers labeled at different time points for each metabolite after z-transformation (Supplemental Experimental Procedures). D. Unsupervised hierarchical clustering analysis of the entire set of 3744 reactions and their differential activity between naïve and primed cells, and lin28 knockout versus wildtype cells. Reactions are clustered based on extent of similarity between the two comparisons (Naïve vs Primed and ΔLin28 vs WT). The majority of reactions do not have differential impact in any state (yellow color in both rows). The bottom panel shows the cluster of 220 reactions that exhibit differential sensitivity between different cell states. Overall, even reactions that show differential sensitivity have the same direction of change in both Naïve vs Primed cells and ΔLin28 vs WT cells suggesting broad similarities between the different states (96.6% similarity). A small subset of reactions (N = 33) show opposite differences in ΔLin28 vs WT compared to naive vs primed cells; reactions with strongest differences are highlighted. E. Multi-dimensional scaling analysis captures the overall metabolic differences between cell states, and confirmed that knockout of Lin28 moves the cellular metabolic network closer to Naïve cell metabolism.
We next quantified the overall similarity of the 3744 reaction sensitivities between naïve, primed, lin28 knockout and wildtype cells using unsupervised clustering and multi-dimensional scaling (MDS) analysis (Figure 4D, 4E). Hierarchical clustering analysis revealed that most reactions that show differential sensitivity between cell states share the same direction of change in both naïve versus primed cells and ΔLin28 versus wildtype cells, suggesting broad similarities between the two scenarios (Figure 4D). A small subset of reactions showed the opposite direction of change in ΔLin28 versus wildtype compared to naive versus primed cells, suggesting that these two scenarios are similar, but not identical (Figure 4D). MDS analysis, which visualizes the entire set of variation in a data in three dimensions, confirmed that knockout of Lin28 moves the cellular metabolic network of iPS cells closer to the naïve ES cell state (Figure 4E).
Simulating impact of metabolic pathways on histone methylation
The one-carbon metabolism pathway is required for histone methylation in ESCs through modulating the SAM/SAH ratio (Shyh-Chang et al., 2013) (Figure 3C). To assess the impact of the naive and primed metabolic network states on histone methylation, we simulated the effect of metabolic reaction deletions on SAM flux and subsequently histone methylation under the assumption that SAM is a limiting metabolite for methylation. Deletion of reactions in one-carbon metabolism and nucleotide metabolism preferentially affected SAM production in the primed state over the naive state (Figure 5A; Table S4). We experimentally validated this prediction by treating cells with 3-deazaadenosine (3-DZA), a SAH hydrolase inhibitor that decreases the SAM/SAH ratio, and found that it more profoundly affected H3K4, H3K9, and H3K27 trimethylation in the primed state relative to the naive state (Figure 5B). Furthermore, treatment with 3-DZA affected wildtype H3K9 trimethylation more than Lin28 knockout, consistent with the role of Lin28 in the primed state (Figure 5C). FBA also revealed higher flux through SAM synthesis reactions in the primed state, suggesting that the primed state relies more on one-carbon metabolism for production of SAM (Table S4). Consistent with the in silico prediction, the primed metabolic state has higher C13 incorporation from serine towards SAM than the naïve state based on tracing C13-labeled serine (Figure 5E). Further, histone methytransferases and demethylases are not differentially expressed in these two states, hence altered SAM metabolism can explain the observed differential histone methylation (Figure 5D).
Figure 5. Prediction and validation of intracellular SAM levels and global histone methylation.
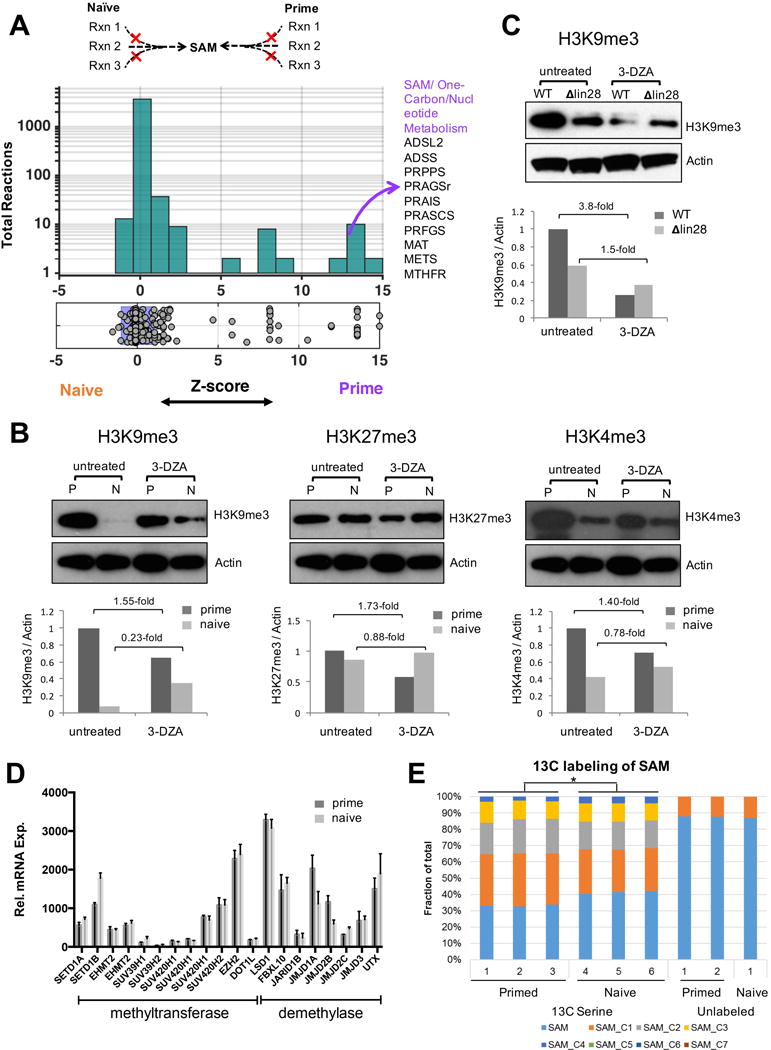
A. Using the metabolic model, we predicted metabolic changes that can impact SAM flux and subsequently histone methylation. The histogram shows the distribution of SAM flux towards histone methylation after deletion of all the metabolic reactions. The horizontal x-axis shows the relative effect of each knockout on SAM flux in the naïve state versus the primed state (selectivity). The y-axis shows the total number of reactions in each bin. Metabolic reactions that showed the greatest differences in SAM flux between the two states are highlighted. No reaction was predicted to impact SAM production in the naïve state over a z-score threshold of −2. B. Western blotting of H3K4me3, H3K9me3 and H3K27me3 of naïve and primed cells treated with 20 μM 3-DZA for two days. Lower panels show densitometry of the bands. C, Western blotting of H3K9me3 of wildtype and Lin28 knockout PS cells treated with 20 μM 3-DZA for two days. D. The mRNA expression levels of histone methytransferases and demethylases are similar in both the naive and primed states (n=4). E, Naive and primed cells were labeled with 50% [U13C]-serine for 24 hours, and the fraction of each SAM isotopomer are shown.
Discussion
Metabolism influences gene regulatory networks that govern cell fate choices (Ryall et al., 2015; Zhang et al., 2012), in both pluripotent stem cells (Carey et al., 2015) and various types of adult progenitor/stem cells (Peng et al., 2016; Yang et al., 2016). Given the development potential of naive ESCs compared to primed ESCs, it is critical to understand the metabolic differences between these pluripotent cell fates. Analysis using our dynamic metabolic modeling framework revealed three insights on pluripotent stem cell metabolism. Firstly, previous studies showed higher mitochondria function in mouse ESCs, in comparison to EpiSC or human ESCs (Zhou et al., 2012). Further, human naive-like cells have higher nicotinamide N-methyltransferase (NNMT) activity that consume SAM (Sperber et al., 2015). Here we comprehensively characterized the metabolic network of two bona fide pluripotent states in mouse ESCs, and discovered that during priming, the entire one-carbon metabolic pathway is activated, including upstream serine production from glucose and downstream SAM and nucleotide production through folate cycle and methionine cycle. This makes mouse primed ESCs more vulnerable to folate metabolism inhibition and SAM/SAH repression. Interestingly, this effect is compartment-specific, with folate inhibition in mitochondria more sensitive in naïve cells, while cytoplasmic inhibition is more sensitive in primed cells. Our systems approach has thus uncovered a transition of one-carbon metabolism between two clearly defined naïve and primed states.
Secondly, a previous report found that deleting Lin28 changes mouse ESCs to a naïve-like state. At the network level, broad similarities between 2i naïve and Lin28 knockout cells were observed. Yet, unique differences in the pentose phosphate pathway identified by our analysis suggest that these states are not identical (Figure 4D). Thirdly, we found that increased flux through one-carbon pathway leads to higher flux towards SAM and histone methylation in primed state, and inhibiting these pathways reduces methylation disproportionately in primed state. A previous report connected NNMT activity to SAM consumption (Sperber et al., 2015).
Our approach revealed that serine flux and the one-carbon metabolic pathway contribute to SAM production and histone methylation. Consistent with a low SAM pool, naive mouse cells have hypomethylated DNA and histone, and are tolerant to loss of epigenetic regulators such as DNMT1 and polycomb protein EED, in contrast to primed cells (Weinberger et al., 2016). Since recent studies also implied that similar metabolic changes in one-carbon and oxidative metabolism may occur in converted human naïve-like and primed PSCs (Sperber et al., 2015; Takashima et al., 2014), whether the converted naïve-like cells become more tolerant to DNMT1 depletion and/or to SAM/SAH repression, merit careful investigation to substantiate the identity of those cells.
Pervasive histone methylation is a key feature of primed cells and our findings directly tie into the biology of primed pluripotency. Our model also suggests that hypomethylation in naïve cells is likely due to the lack of one-carbon donor - SAM. Differentiation potential (governed by epigenetic regulations) and proliferation are the two most important cellular phenotypes that distinguish naive and primed pluripotent states. The mechanism of regulation of histone methylation so far is unknown since histone methytransferases and demethylases are not differentially expressed in these two states (Figure 5D). Our study provides evidence that altered one-carbon and SAM metabolism account for the differential histone methylation in these two states, which in turn determines expression of various pluripotent and developmental genes.
While most of our experimental observations were consistent with model predictions, treatment of naïve ESCs with 3-DZA surprisingly resulted in increased histone methylation, which was not predicted by the model. We speculate that this might be due to the kinetic effect of enzyme inhibition, which is not incorporated into the metabolic model due to the lack of kinetic parameters. DZA is an inhibitor to SAH hydrolase that catalyzes both directions of the reaction between SAH and homocysteine+adenosine. In the primed state cells, there is sufficient SAM production, and the flux of the reaction is likely to be towards making homocysteine+adenosine from SAH. Inhibiting SAH hydrolase leads to build-up of SAH and a decreased SAM/SAH ratio, and thus reduced histone methylation as predicted by our model. Whereas in the naive cells, due to limited SAM production, we hypothesize the flux might be directed towards making SAH from homocysteine+adenosine, and inhibiting SAH hydrolase in this case might indeed lead to less SAH, an increased SAM/SAH ratio, and increased histone methylation for certain histone marks.
Our work suggests an interplay between mitochondrial respiratory metabolism and one-carbon metabolism during ESC pluripotent state transitions, pointing to an unappreciated role of elevated mitochondrial function in naive state pluripotency. Similar coupling between one-carbon and respiratory metabolism has been recently reported in cancer cell lines (Bao et al., 2016). Further, many of the enzymes predicted to be differentially active between naïve and primed ESCs, such as PHGDH, MTHFR and other one-carbon metabolism pathway constituents, have also been associated with tumor initiation, progression and metastases (Locasale, 2013; Piskounova et al., 2015). Comparison of metabolic genes that are sensitive in NCI-60 cancer cell lines (Figure 2) with corresponding sensitivity in naive and primed cells (Figure 3) revealed that the metabolic state of many NCI-60 cell lines is surprisingly similar to naive cell metabolism but not to prime cell metabolism. This intriguing preliminary observation needs to be explored further in a future study. Our findings may provide a better understanding of metabolic rewiring during tumorigenesis as well.
Our systems biology approach overcomes a significant challenge in genome-scale modeling by inferring the metabolic state of mammalian cells directly from time-course metabolomics data. The power of our approach is that it can infer the activity of thousands of reactions based on the measurement of a few hundred metabolites. Interpreting metabolomics data is quite challenging due to the highly interconnected nature of metabolic networks. The metabolites in our time-course data were involved in 834 metabolic reactions in the model, even after excluding ubiquitous metabolites such as ATP and NADH. Hence, it is difficult to manually infer the differentially active reactions from the metabolomics data. By overlaying these data onto the model, we identified a small, prioritized set of reactions that are differentially active between these two states.
Using our approach, we identified compartment specific differences in folate metabolism, which we validated using cytosolic and mitochondrial folate inhibitors (Figure 3F). This is significant given that information on cellular compartments is lost during metabolomics measurement. Further, the model correctly identified differences in oxidative phosphorylation pathway despite there being no direct measurement of this pathway’s activity. These results highlight the power of our systems approach to infer metabolic changes based on network topology that goes beyond traditional analysis of metabolomics data.
Our computational approach still has some limitations despite these numerous advances highlighted earlier. Firstly, the algorithm requires the levels of numerous metabolites (~100) to infer the activity of reactions in the metabolic model. The accuracy of the approach dropped significantly with data from fewer than 65 metabolites (i.e., 33% of the data; Figure 1F). Future studies should reveal which metabolites provide the most predictive power for these models. Secondly, existing genome-scale metabolic models lack detailed mapping of atom transfer from substrates to products, thus preventing the incorporation of isotopomer labeling distribution from 13C tracing data. 13C flux tracing studies currently use significantly smaller metabolic models with atomic mapping to predict fluxes. Our systems-scale approach can complement such traditional 13C analysis approaches by making coarse-grained predictions for a larger set of reactions. Thirdly, our approach is restricted to predicting the impact of complete enzyme inhibition or gene knockouts on the metabolic network. As enzyme kinetic parameters become available, it should be possible to simulate the systems-level impact of nuanced changes in enzyme levels.
Looking forward, a systems-level understanding of stem cell metabolism could allow us to rationally manipulate specific metabolic modules to facilitate differentiation and aid cell-fate engineering. Our approach could be readily extended to understand metabolic mechanisms underlying other cell-fate changes and could open new avenues for computational identification of metabolic vulnerabilities of cancer cells and other complex metabolic disorders.
Experimental Procedures
Genome-scale metabolic network modeling
We used the Duarte et al. model of human metabolism for all the metabolic modeling in this study as it has been widely applied in literature for understanding cellular metabolism of various normal and disease states (Duarte et al., 2007). We also used the human Recon 2.0 model and the genome-scale model of mouse metabolism as further validation. The mouse model was derived based on homology with the Duarte et al. human model. Using these models leads to the identification of similar set of genes and pathways that were differentially active between naïve and primed states (Table S2C).
We used FBA to determine the optimal metabolic state that satisfies the growth objective and the metabolomics constraints. Mathematically in FBA, we solve the optimization problem to identify a metabolic state (v, a vector of reaction fluxes) that maximizes a specific cellular objective, such as the biomass production or ATP synthesis rate, while satisfying thermodynamic and mass balance constraints. FBA is formulated as:
where S is the stoichiometric matrix with Sij representing the stoichiometric coefficient of metabolite i in reaction j, v is the flux vector and b represents the rate of change of metabolites (dM/dt). In traditional FBA, the value of R.H.S vector b is assumed to be zero to represent steady state. We set this value proportional to the measured rate of change from time-course metabolomics data. For each dynamic metabolite, we include a flux activity coefficient, whose value and sign determines if there is increased or decreased flux activity involving the metabolite.
where epsilon is a vector of flux activity coefficient values (≠ 0 for dynamic metabolites).
The value of the flux activity coefficients is directly determined based on the rate of change of metabolite levels over time. Since subcellular compartment-specific information is lost during metabolomics measurement, we assumed that the measured metabolites represent the sum total of those in the cytoplasm, nucleus and the mitochondrial compartments in the model. In addition, some metabolite changes might represent noise in the data and these constraints would be predicted to be infeasible by the model. To account for these issues, we implemented an approach, defined below, that identifies a metabolic state that best fits the entire set of metabolomics constraints simultaneously:
Alpha and beta are positive vectors that represent deviation from the measured experimental data (See Supplemental Experimental Procedures). The entire sequence of steps in the dynamic modeling approach are described in the pseudo-code provided in the supplement (See Supplemental Experimental Procedures)
The approach is robust to relative weights for metabolomics data and growth objective (as defined by the kappa parameter), and also to noise in metabolomics data (Figure 1E). Using a simple model that takes as input only the direction of change of metabolites (i.e., accumulating or depleting) without the magnitude also led to qualitatively similar set of predictions for naïve and primed states (Figure 1F).
In addition to FBA, we used flux variability analysis (FVA) to determine the range of feasible fluxes for each reaction. Reactions that had either higher minimal flux or both higher minimal and maximal flux compared to the second condition (naïve or primed state) were considered to have higher activity in that condition.
Software and data availability
The MATLAB implementation of the algorithm and associated data sets are publicly available at the Synapse bioinformatics software repository (www.synapse.org/#!Synapse:syn7253624/wiki/406160). Examples and instructions for running the analysis are also provided. The entire metabolomics data for naïve, primed and Δlin28 cells are also provided as a supplementary dataset (Table S5, S6). The optimization problem was solved using the Gurobi mathematical programming solver.
Supplementary Material
Table S1: (Related to Figure 3 and 4) Pathway enrichment analysis of metabolomics and transcriptomics data. Differentially active pathways identified using MetaboAnalyst with raw p-value below 0.05 are shown for Naïve vs Primed state (Panel A and B), lin28 knockout versus wild type cells (Panel C and D) and using gene expression data for Naïve vs Primed State (Panel E). Most pathways did not cross statistical significance once corrected for multiple hypothesis (FDR).
Table S2: (Related to Figure 3B and 4A, and Methods) List of differentially sensitive reactions. A. Reactions that are predicted to be differentially sensitive between naïve and primed state by reaction-deletion analysis. z-scores for differential sensitivity for the 3744 metabolic reactions and 1487 genes are shown. B. List of reactions that are predicted to be differentially active between Lin28 knockout and wild type cells. C. Integrating metabolomics data with a genome-scale mouse metabolic model instead of human metabolic model reveals similar set of reactions that are differentially active between naïve and primed state.
Table S3: (Related to Figure 3B and 4A, and Methods) List of differentially active reactions from FVA. A. Differentially sensitive reactions identified by reaction deletion analysis that are also predicted to have differentially flux levels between naïve and primed state by FVA. B. List of differentially sensitive reactions that are predicted to have differentially flux levels between Lin28 knockout and wild type cells by FVA. Reactions are ordered alphabetically.
Table S4: (Related to Figure 5). Reactions that impact SAM production. FBA analysis with SAM synthesis as the objective revealed that primed metabolic state has higher SAM production than the naïve state. All reactions that significantly impact SAM flux (z-score > 2 or < −2) based on FBA are listed in the table below. Interestingly, reactions that impact SAM flux preferentially impacted prime state but not the naïve state (Figure 5A).
Table S5: (Related to Figure 3 and 4). Time course metabolomics data for Naïve, Primed, Lin28 wild type and Lin28 knockout cells. The corresponding index of the metabolites in the human metabolic model is also provided.
Table S6: (Related to Figure 3 and 4). 13C glucose flux tracing data for Naïve, Primed, Lin28 wild type and Lin28 knockout cells.
Acknowledgments
We thank Matthew G Vander Heiden and Caroline Lewis for suggestions in interpreting the metabolomics data and critical reading of the manuscript. We thank Aswin Kannan for advice on implementing the optimization algorithm. We thank Raze Therapeutics for providing MTHFD2 inhibitor MTH-1459, and Nello Mainolfi for discussion. This work was supported by the Wyss Institute and an NIH grant (R01GM107536) for GQD and JJC.
Footnotes
Publisher's Disclaimer: This is a PDF file of an unedited manuscript that has been accepted for publication. As a service to our customers we are providing this early version of the manuscript. The manuscript will undergo copyediting, typesetting, and review of the resulting proof before it is published in its final citable form. Please note that during the production process errors may be discovered which could affect the content, and all legal disclaimers that apply to the journal pertain.
Author contributions
J.Z, S.C conceived, designed and performed research, and wrote the manuscript with input from G.Q.D and J.J.C. S.C performed all the computational analysis and J.Z conducted all the experimental assays with help from Y.C.H. G.Q.D and J.J.C contributed to study design and supervised the study. J.M.A performed metabolomics, C.A.R and H.L performed transcriptomics analysis.
References
- Aguirre AJ, Meyers RM, Weir BA, Vazquez F, Zhang CZ, Ben-David U, Cook A, Ha G, Harrington WF, Doshi MB, et al. Genomic copy number dictates a gene-independent cell response to CRISPR-Cas9 targeting. Cancer Discov. 2016 doi: 10.1158/2159-8290.CD-16-0154. CD-16-0154. [DOI] [PMC free article] [PubMed] [Google Scholar]
- Bao XR, Ong SE, Goldberger O, Peng J, Sharma R, Thompson DA, Vafai SB, Cox AG, Marutani E, Ichinose F, et al. Mitochondrial dysfunction remodels one- carbon metabolism in human cells. Elife. 2016;5 doi: 10.7554/eLife.10575. [DOI] [PMC free article] [PubMed] [Google Scholar]
- Bordbar A, Monk JM, King ZA, Palsson BO. Constraint-based models predict metabolic and associated cellular functions. Nat Rev Genet. 2014;15:107–120. doi: 10.1038/nrg3643. [DOI] [PubMed] [Google Scholar]
- Boroviak T, Loos R, Lombard P, Okahara J, Behr R, Sasaki E, Nichols J, Smith A, Bertone P. Lineage-Specific Profiling Delineates the Emergence and Progression of Naive Pluripotency in Mammalian Embryogenesis. Dev Cell. 2015;35:366–382. doi: 10.1016/j.devcel.2015.10.011. [DOI] [PMC free article] [PubMed] [Google Scholar]
- Brons IGM, Smithers LE, Trotter MWB, Rugg-Gunn P, Sun B, Chuva de Sousa Lopes SM, Howlett SK, Clarkson A, Ahrlund-Richter L, Pedersen RA, et al. Derivation of pluripotent epiblast stem cells from mammalian embryos. Nature. 2007;448:191–195. doi: 10.1038/nature05950. [DOI] [PubMed] [Google Scholar]
- Carey BW, Finley LWS, Cross JR, Allis CD, Thompson CB. Intracellular α-ketoglutarate maintains the pluripotency of embryonic stem cells. Nature. 2015;518(7539):413. doi: 10.1038/nature13981. [DOI] [PMC free article] [PubMed] [Google Scholar]
- Cheung HW, Cowley GS, Weir BA, Boehm JS, Rusin S, Scott JA, East A, Ali LD, Lizotte PH, Wong TC, et al. Systematic investigation of genetic vulnerabilities across cancer cell lines reveals lineage-specific dependencies in ovarian cancer. Proc Natl Acad Sci U S A. 2011;108:12372–12377. doi: 10.1073/pnas.1109363108. [DOI] [PMC free article] [PubMed] [Google Scholar]
- Cotten C, Reed JL, Price N, Reed J, Palsson B, Orth J, Thiele I, Palsson B, Schuetz R, Kuepfer L, et al. Mechanistic analysis of multi-omics datasets to generate kinetic parameters for constraint-based metabolic models. BMC Bioinformatics. 2013;14:32. doi: 10.1186/1471-2105-14-32. [DOI] [PMC free article] [PubMed] [Google Scholar]
- Duarte NC, Becker SA, Jamshidi N, Thiele I, Mo ML, Vo TD, Srivas R, Palsson BØ. Global reconstruction of the human metabolic network based on genomic and bibliomic data. Proc Natl Acad Sci U S A. 2007;104:1777–1782. doi: 10.1073/pnas.0610772104. [DOI] [PMC free article] [PubMed] [Google Scholar]
- Frezza C, Zheng L, Folger O, Rajagopalan KN, MacKenzie ED, Jerby L, Micaroni M, Chaneton B, Adam J, Hedley A, et al. Haem oxygenase is synthetically lethal with the tumour suppressor fumarate hydratase. Nature. 2011;477:225–228. doi: 10.1038/nature10363. [DOI] [PubMed] [Google Scholar]
- Gafni O, Weinberger L, Mansour AA, Manor YS, Chomsky E, Ben-Yosef D, Kalma Y, Viukov S, Maza I, Zviran A, et al. Derivation of novel human ground state naive pluripotent stem cells. Nature. 2013;504:282–286. doi: 10.1038/nature12745. [DOI] [PubMed] [Google Scholar]
- Huang K, Maruyama T, Fan G. The Naive State of Human Pluripotent Stem Cells: A Synthesis of Stem Cell and Preimplantation Embryo Transcriptome Analyses. Cell Stem Cell. 2014;15:410–415. doi: 10.1016/j.stem.2014.09.014. [DOI] [PMC free article] [PubMed] [Google Scholar]
- Jain M, Nilsson R, Sharma S, Madhusudhan N, Kitami T, Souza AL, Kafri R, Kirschner MW, Clish CB, Mootha VK. Metabolite profiling identifies a key role for glycine in rapid cancer cell proliferation. Science. 2012;336:1040–1044. doi: 10.1126/science.1218595. [DOI] [PMC free article] [PubMed] [Google Scholar]
- Kleessen S, Irgang S, Klie S, Giavalisco P, Nikoloski Z. Integration of transcriptomics and metabolomics data specifies the metabolic response of Chlamydomonas to rapamycin treatment. Plant J. 2015;81:822–835. doi: 10.1111/tpj.12763. [DOI] [PubMed] [Google Scholar]
- Locasale JW. Serine, glycine and one-carbon units: cancer metabolism in full circle. Nat Rev Cancer. 2013;13:572–583. doi: 10.1038/nrc3557. [DOI] [PMC free article] [PubMed] [Google Scholar]
- Mahadevan R, Schilling CH. The effects of alternate optimal solutions in constraint-based genome-scale metabolic models. Metab Eng. 2003;5:264–276. doi: 10.1016/j.ymben.2003.09.002. [DOI] [PubMed] [Google Scholar]
- Marcotte R, Brown KR, Suarez F, Sayad A, Karamboulas K, Krzyzanowski PM, Sircoulomb F, Medrano M, Fedyshyn Y, Koh JLY, et al. Essential gene profiles in breast, pancreatic, and ovarian cancer cells. Cancer Discov. 2012;2:172–189. doi: 10.1158/2159-8290.CD-11-0224. [DOI] [PMC free article] [PubMed] [Google Scholar]
- Marks H, Kalkan T, Menafra R, Denissov S, Jones K, Hofemeister H, Nichols J, Kranz A, Stewart AF, Smith A, et al. The transcriptional and epigenomic foundations of ground state pluripotency. Cell. 2012;149:590–604. doi: 10.1016/j.cell.2012.03.026. [DOI] [PMC free article] [PubMed] [Google Scholar]
- Nichols J, Smith A. Naive and primed pluripotent states. Cell Stem Cell. 2009;4:487–492. doi: 10.1016/j.stem.2009.05.015. [DOI] [PubMed] [Google Scholar]
- Orth JD, Thiele I, Palsson BØ. What is flux balance analysis? Nat Biotechnol. 2010;28:245–248. doi: 10.1038/nbt.1614. [DOI] [PMC free article] [PubMed] [Google Scholar]
- Peng M, Yin N, Chhangawala S, Xu K, Leslie CS, Li MO. Aerobic glycolysis promotes T helper 1 cell differentiation through an epigenetic mechanism. Science (80-) 2016 doi: 10.1126/science.aaf6284. [DOI] [PMC free article] [PubMed] [Google Scholar]
- Piskounova E, Agathocleous M, Murphy MM, Hu Z, Huddlestun SE, Zhao Z, Leitch AM, Johnson TM, DeBerardinis RJ, Morrison SJ. Oxidative stress inhibits distant metastasis by human melanoma cells. Nature. 2015;527:186–191. doi: 10.1038/nature15726. [DOI] [PMC free article] [PubMed] [Google Scholar]
- Ryall JG, Cliff T, Dalton S, Sartorelli V, Arai F, Hirao A, Ohmura M, Sato H, Matsuoka S, Takubo K, et al. Metabolic Reprogramming of Stem Cell Epigenetics. Cell Stem Cell. 2015;17:651–662. doi: 10.1016/j.stem.2015.11.012. [DOI] [PMC free article] [PubMed] [Google Scholar]
- Schmidt BJ, Ebrahim A, Metz TO, Adkins JN, Palsson BØ, Hyduke DR. GIM3E: condition-specific models of cellular metabolism developed from metabolomics and expression data. Bioinformatics. 2013;29:2900–2908. doi: 10.1093/bioinformatics/btt493. [DOI] [PMC free article] [PubMed] [Google Scholar]
- Shiraki N, Shiraki Y, Tsuyama T, Obata F, Miura M, Nagae G, Aburatani H, Kume K, Endo F, Kume S. Methionine metabolism regulates maintenance and differentiation of human pluripotent stem cells. Cell Metab. 2014;19:780–794. doi: 10.1016/j.cmet.2014.03.017. [DOI] [PubMed] [Google Scholar]
- Shlomi T, Cabili MN, Herrgård MJ, Palsson BØ, Ruppin E. Network-based prediction of human tissue-specific metabolism. Nat Biotechnol. 2008;26:1003–1010. doi: 10.1038/nbt.1487. [DOI] [PubMed] [Google Scholar]
- Shyh-Chang N, Locasale JW, Lyssiotis CA, Zheng Y, Teo RY, Ratanasirintrawoot S, Zhang J, Onder T, Unternaehrer JJ, Zhu H, et al. Influence of threonine metabolism on S-adenosylmethionine and histone methylation. Science. 2013;339:222–226. doi: 10.1126/science.1226603. [DOI] [PMC free article] [PubMed] [Google Scholar]
- Singh R, Fouladi-Nashta AA, Li D, Halliday N, Barrett DA, Sinclair KD. Methotrexate induced differentiation in colon cancer cells is primarily due to purine deprivation. J Cell Biochem. 2006;99:146–155. doi: 10.1002/jcb.20908. [DOI] [PubMed] [Google Scholar]
- Sperber H, Mathieu J, Wang Y, Ferreccio A, Hesson J, Xu Z, Fischer KA, Devi A, Detraux D, Gu H, et al. The metabolome regulates the epigenetic landscape during naive-to-primed human embryonic stem cell transition. Nat Cell Biol. 2015;17:1523–1535. doi: 10.1038/ncb3264. [DOI] [PMC free article] [PubMed] [Google Scholar]
- Subramanian A, Tamayo P, Mootha VK, Mukherjee S, Ebert BL, Gillette MA, Paulovich A, Pomeroy SL, Golub TR, Lander ES, et al. Gene set enrichment analysis: a knowledge-based approach for interpreting genome-wide expression profiles. Proc Natl Acad Sci U S A. 2005;102:15545–15550. doi: 10.1073/pnas.0506580102. [DOI] [PMC free article] [PubMed] [Google Scholar]
- Takashima Y, Guo G, Loos R, Nichols J, Ficz G, Krueger F, Oxley D, Santos F, Clarke J, Mansfield W, et al. Resetting Transcription Factor Control Circuitry toward Ground-State Pluripotency in Human. Cell. 2014;158:1254–1269. doi: 10.1016/j.cell.2014.08.029. [DOI] [PMC free article] [PubMed] [Google Scholar]
- Tesar PJ, Chenoweth JG, Brook FA, Davies TJ, Evans EP, Mack DL, Gardner RL, McKay RDG. New cell lines from mouse epiblast share defining features with human embryonic stem cells. Nature. 2007;448:196–199. doi: 10.1038/nature05972. [DOI] [PubMed] [Google Scholar]
- Theunissen TW, Powell BE, Wang H, Mitalipova M, Faddah DA, Reddy J, Fan ZP, Maetzel D, Ganz K, Shi L, et al. Systematic Identification of Defined Conditions for Induction and Maintenance of Naive Human Pluripotency. Cell Stem Cell. 2014;15:471–487. doi: 10.1016/j.stem.2014.07.002. [DOI] [PMC free article] [PubMed] [Google Scholar]
- Uhlén M, Fagerberg L, Hallström BM, Lindskog C, Oksvold P, Mardinoglu A, Sivertsson Å, Kampf C, Sjöstedt E, Asplund A, et al. Proteomics. Tissue-based map of the human proteome. Science. 2015;347:1260419. doi: 10.1126/science.1260419. [DOI] [PubMed] [Google Scholar]
- Viswanathan SR, Daley GQ. Lin28: A microRNA regulator with a macro role. Cell. 2010;140:445–449. doi: 10.1016/j.cell.2010.02.007. [DOI] [PubMed] [Google Scholar]
- Ware CB, Nelson AM, Mecham B, Hesson J, Zhou W, Jonlin EC, Jimenez-Caliani AJ, Deng X, Cavanaugh C, Cook S, et al. Derivation of naive human embryonic stem cells. Proc Natl Acad Sci U S A. 2014;111:4484–4489. doi: 10.1073/pnas.1319738111. [DOI] [PMC free article] [PubMed] [Google Scholar]
- Weinberger L, Ayyash M, Novershtern N, Hanna JH. Dynamic stem cell states: naive to primed pluripotency in rodents and humans. Nat Rev Mol Cell Biol. 2016;17:155–169. doi: 10.1038/nrm.2015.28. [DOI] [PubMed] [Google Scholar]
- Xia J, Sinelnikov IV, Han B, Wishart DS. MetaboAnalyst 3.0—making metabolomics more meaningful. Nucleic Acids Res. 2015;43:W251–W257. doi: 10.1093/nar/gkv380. [DOI] [PMC free article] [PubMed] [Google Scholar]
- Yang Q, Liang X, Sun X, Zhang L, Fu X, Rogers CJ, Berim A, Zhang S, Wang S, Wang B, et al. AMPK/α-Ketoglutarate Axis Dynamically Mediates DNA Demethylation in the Prdm 16 Promoter and Brown Adipogenesis. Cell Metab. 2016 doi: 10.1016/j.cmet.2016.08.010. [DOI] [PMC free article] [PubMed] [Google Scholar]
- Yizhak K, Chaneton B, Gottlieb E, Ruppin E. Modeling cancer metabolism on a genome scale. Mol Syst Biol. 2015;11:817. doi: 10.15252/msb.20145307. [DOI] [PMC free article] [PubMed] [Google Scholar]
- Zhang J, Nuebel E, Daley GQ, Koehler CM, Teitell MA. Metabolic regulation in pluripotent stem cells during reprogramming and self-renewal. Cell Stem Cell. 2012;11:589–595. doi: 10.1016/j.stem.2012.10.005. [DOI] [PMC free article] [PubMed] [Google Scholar]
- Zhang J, Ratanasirintrawoot S, Chandrasekaran S, Wu Z, Ficarro SB, Yu C, Ross CA, Cacchiarelli D, Xia Q, Seligson M, et al. LIN28 Regulates Stem Cell Metabolism and Conversion to Primed Pluripotency. Cell Stem Cell. 2016;19:66–80. doi: 10.1016/j.stem.2016.05.009. [DOI] [PubMed] [Google Scholar]
- Zhou W, Choi M, Margineantu D, Margaretha L, Hesson J, Cavanaugh C, Blau CA, Horwitz MS, Hockenbery D, Ware C, et al. HIF1α induced switch from bivalent to exclusively glycolytic metabolism during ESC-to-EpiSC/hESC transition. EMBO J. 2012;31:2103–2116. doi: 10.1038/emboj.2012.71. [DOI] [PMC free article] [PubMed] [Google Scholar]
Associated Data
This section collects any data citations, data availability statements, or supplementary materials included in this article.
Supplementary Materials
Table S1: (Related to Figure 3 and 4) Pathway enrichment analysis of metabolomics and transcriptomics data. Differentially active pathways identified using MetaboAnalyst with raw p-value below 0.05 are shown for Naïve vs Primed state (Panel A and B), lin28 knockout versus wild type cells (Panel C and D) and using gene expression data for Naïve vs Primed State (Panel E). Most pathways did not cross statistical significance once corrected for multiple hypothesis (FDR).
Table S2: (Related to Figure 3B and 4A, and Methods) List of differentially sensitive reactions. A. Reactions that are predicted to be differentially sensitive between naïve and primed state by reaction-deletion analysis. z-scores for differential sensitivity for the 3744 metabolic reactions and 1487 genes are shown. B. List of reactions that are predicted to be differentially active between Lin28 knockout and wild type cells. C. Integrating metabolomics data with a genome-scale mouse metabolic model instead of human metabolic model reveals similar set of reactions that are differentially active between naïve and primed state.
Table S3: (Related to Figure 3B and 4A, and Methods) List of differentially active reactions from FVA. A. Differentially sensitive reactions identified by reaction deletion analysis that are also predicted to have differentially flux levels between naïve and primed state by FVA. B. List of differentially sensitive reactions that are predicted to have differentially flux levels between Lin28 knockout and wild type cells by FVA. Reactions are ordered alphabetically.
Table S4: (Related to Figure 5). Reactions that impact SAM production. FBA analysis with SAM synthesis as the objective revealed that primed metabolic state has higher SAM production than the naïve state. All reactions that significantly impact SAM flux (z-score > 2 or < −2) based on FBA are listed in the table below. Interestingly, reactions that impact SAM flux preferentially impacted prime state but not the naïve state (Figure 5A).
Table S5: (Related to Figure 3 and 4). Time course metabolomics data for Naïve, Primed, Lin28 wild type and Lin28 knockout cells. The corresponding index of the metabolites in the human metabolic model is also provided.
Table S6: (Related to Figure 3 and 4). 13C glucose flux tracing data for Naïve, Primed, Lin28 wild type and Lin28 knockout cells.