Abstract
Amplitude-integrated EEG (aEEG) is an easily accessible technique to monitor the electrocortical activity in preterm and term infants in neonatal intensive care units (NICUs). This method was first used to monitor newborns after asphyxia, providing information about future neurological outcomes. The aEEG is also helpful to select newborns who benefit from cooling. The aEEG monitoring of preterm infants is becoming more widespread, as various studies have shown that neurodevelopmental outcome is related to early aEEG tracings. Here, we demonstrate the application of the aEEG monitoring system and present typical patterns that depend upon gestational age and pathophysiological conditions. Furthermore, we mention pitfalls in the interpretation of the aEEG, as this method requires accurate fixation and localization of the electrodes. Additionally, the raw EEG can be used to detect neonatal seizures or to identify aEEG application problems. In conclusion, aEEG is a safe and generally well-tolerated method for the bedside monitoring of neonatal cerebral function; it can even provide information about long-term outcome.
Keywords: Medicine, Issue 127, neonates, amplitude-integrated EEG (aEEG), aEEG application, neonatal seizures, prematurity, cerebral function monitor, neurodevelopmental outcome, preterm infant
Introduction
aEEG was originally developed as a bedside monitor for adult intensive care1. The first publications detailing its use in neonates date back to the late 1980s2,3. In early years, its clinical use was mainly for the detection of cerebral seizure activity, surveillance of antiepileptic drug treatment4, and prediction of cerebral outcome after birth asphyxia5,6,7,8,9. Infants with birth asphyxia who did not show severe suppression of background activity and seizure activity had a more favorable outcome if they were cooled8, but research on this topic is still ongoing10,11,12. Over the past 30 years, cerebral function monitoring in neonates has become more widespread in NICUs13. Nowadays, it is increasingly being used in the preterm infant population. aEEG has been proven to be a safe method for cerebral function monitoring, even in extremely preterm infants, and is generally well-accepted by NICU staff14. Several studies showed a correlation between early aEEG recordings and neurodevelopmental outcomes in preterm infants15,16,17,18,19,20.
aEEG is based upon conventional electroencephalography that is recorded with two or four scalp electrodes, depicting the amplitude of the raw EEG on a time-compressed semi-logarithmic scale1. The signal from two or four electrodes placed in the C3, P3, C4, and P4 positions of the international 10-20 system is passed through a bandpass filter, which enhances frequencies between 2 and 15 Hz. Frequencies under 2 Hz and above 15 Hz are attenuated in order to eliminate artefacts, such as sweating, movement, muscle activity, and electrical interference, as much as possible1,4. Further processing includes filtering, rectification, smoothing, semi-logarithmic amplitude compression, and time compression. Amplitudes <10 µV are displayed on a linear scale and amplitudes >10 µV on a logarithmic scale21. The lowest-detected amplitude is shown as the lower border, and the highest amplitude is shown as the upper border21. By this means, even small changes in the lower amplitude remain visible, while an overloading of the display at high amplitudes is avoided21 (Figure 1). Due to time compression, 5 - 6 cm on the time scale represents 1 h, thus making the review of brain activity for hours and even days possible1,4,13.
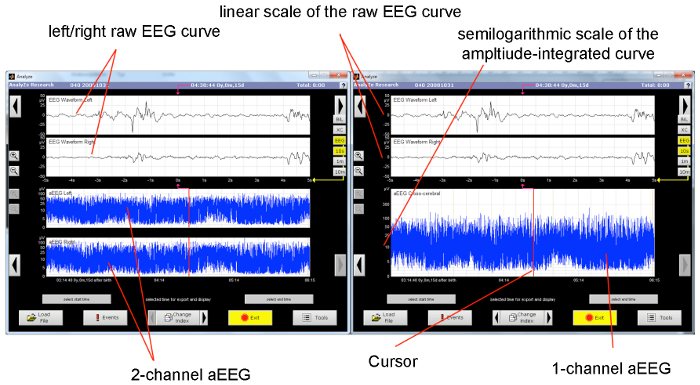
The visible information in the aEEG tracing is limited to changes of the amplitude. Modern devices offer the possibility of viewing the raw EEG, so the frequency and morphology of the raw EEG curve can also be considered for interpretation. This helps to distinguish between artefacts and real seizure activity during suspicious sections of the aEEG band4. Some aEEG devices can record a simultaneous video of the patient for even better identification of seizures and artifacts. Electrode impedance is monitored during the entire recording21. In two-channel aEEG devices that use four electrodes, the investigator can switch between two intraparietal curves or one transcerebral curve (Figure 2). Depending upon the manufacturer, software offers additional features, like seizure detection, burst rate analysis, electromyography, etc. It is also possible to derive an aEEG from a full-channel EEG device that offers video recording, electromyography, electrooculography, electrocardiography, etc.
The reduction of the electrophysiological information and time compression makes continuous monitoring and bedside interpretation possible without requiring specific knowledge about EEG. Because of the long recording time, even subclinical seizure activity can be detected, which would otherwise remain unnoticed4,22 because conventional EEG monitoring for very long time periods is not available to date in NICUs. It must be considered, though, that not all pathological alterations, like seizures, are found due to the small area of brain surface covered by the recording13. Therefore, aEEG is not meant to replace conventional EEG, but to complement it13.
Electrocortical activity, as reflected by the aEEG background pattern, changes according to the infant's gestational age4,23,24,25. In term infants and late preterm infants, the background pattern is mainly continuous with a lower amplitude above 5 µV4. During quiet sleep, the background pattern becomes more discontinuous26. In very preterm infants, the dominating background pattern is discontinuous: episodes of high activity (i.e., high-amplitude bursts) alternate with episodes of low-amplitude activity27. This physiological pattern must be distinguished from a burst suppression pattern, which is pathological27. With increasing gestational age, aEEG and background patterns become more continuous, and the duration of continuous activity increases27,28,29. Developing and existing pathological conditions can also be displayed by the aEEG tracing (e.g., the development of an intraventricular hemorrhage and periventricular leukomalacia is associated with acute disturbances in the background activity)30,31. Severe meningitis can cause a flat trace.
The qualitative interpretation of aEEG generally includes three categories: classification of the background pattern, sleep-wake cycling, and the presence of seizures. Several authors have made suggestions for classifications and scores that describe brain maturation16,21,24,25. The quantitative analysis of aEEG is less common, even though it is possible in modern devices, and few research groups made use of this approach32,33,34. We would like to briefly present 3 different approaches to the qualitative and semi-quantitative assessment of aEEG tracings:
Hellström-Westas:21
The assessment of the tracing is solely qualitative, and the results are not transformed into a score. The classification allows for the description of pathological conditions. Normative values for gestational ages have been published to help interpret whether a pattern is adequate for the age21: (1) background patterns: continuous normal voltage (physiological), discontinuous normal voltage (physiological in preterm infants), burst suppression pattern (pathological), continuous low voltage (pathological), and flat trace (pathological); (2) sleep-wake cycling: none, imminent, mature (physiological/pathological, depending on the infant's age); and (3) seizure activity: none, single seizures, repetitive seizures, and status epilepticus.
Burdjalov:25
The approach of this classification is the qualitative assessment of the tracing and its transformation into a score. The score rises with gestational age, and normative score values for each corresponding gestational age have been published: (1) 0 - 2 points for continuity, (2) 0 - 5 points for sleep-wake cycling, (3) 0 - 2 points for the amplitude of the lower border, (4) 0 - 4 points for the bandwidth, and (5) 0 - 13 points for the total score.
Olischar/Klebermass:16,24
Percentiles regarding the percent duration of background patterns (i.e., discontinuous normal voltage, discontinuous low voltage, and continuous normal voltage) and burst rate were developed for gestational ages. Tracings are evaluated for an age-adequate background pattern, the presence of sleep-wake cycling, and the presence of seizure activity (i.e., repetitive seizures or status epilepticus). Then, the tracings are classified into a graded score as follows: (1) normal aEEG (all categories normal), (2) moderately abnormal (1 out of 3 categories classified as abnormal), and (3) severely abnormal (2 or 3 out of 3 categories classified as abnormal). This score has been shown to have a predictive value for neurodevelopmental outcome at 3 years of corrected age.
Changes in the aEEG tracing are caused by numerous extracortical factors, such as changes in cerebral blood flow, medication (e.g., opiates, sedatives, and caffeine), acidosis, changes in carbon dioxide tension, clinical conditions (e.g., hypogylcemia, sepsis, meningitis, and patent ductus arteriosus), etc.21,32,35,36,37,38. The aEEG band itself is rather insensitive to changes of impedance, but significant changes are observed in terms of electrode distance and localization39. Artifacts may pose a problem for interpretation: absolute values of the amplitude change as a consequence of scalp edema or interelectrode distance39,40. Interferences caused by ECG, high-frequency oscillation ventilation, muscle activity, infant movement, or handling may result in a lower border increase40. In modern devices, this can be partially avoided by the simultaneous recording of raw EEG and aEEG and by marking the beginning and end of handling. Liquids (e.g., sweat or ultrasound gel) can lead to connections between electrodes, feigning a flat trace pattern. Approximately 12% of the recording time in long-term aEEGs are altered due to artifacts, 55% caused by electrical interferences and 45% being movement artifacts41.
Protocol
aEEGs are conducted as part of the clinical routine in our hospital. The presented protocol follows the guidelines of the institution's human research ethics committee. Written informed consent regarding the filming and the publication of the material was collected from both parents of all infants that appear in the video.
1. Gather the Needed Supplies
Connect the eEEG device to electric power in the place where the monitoring will take place and plug the module box to the aEEG device.
Ensure that there are four electrodes for a two-channel aEEG and two electrodes for a single-channel aEEG. Choose either needle electrodes, gold cups, or hydrogel electrodes. Additionally, have one hydrogel electrode ready to serve as a reference electrode. NOTE: Gold cups can be disinfected and reused for up to two years. Needle and hydrogel electrodes are single-use only. Needle electrodes can be used in infants at 23 weeks of gestation without causing skin lesions or infections. Here, the best results were achieved using needle electrodes in older infants as well.
Prepare the following supplies: a positioning strip provided by the manufacturer (to help place the electrodes correctly), tape appropriate for use in neonates (e.g., viscose mull), skin disinfectant appropriate for use in neonates (e.g., alcohol-based or octenidinhydrocholoride-based), swabs, skin preparation gel, a module box, and contact gel for gold cups. NOTE: Once disconnected from electrical power, the device will shut down, and the recording will need to be restarted. Some devices have internal batteries, however, and can be moved after being switched on or during the recording.
2. Apply the Electrodes
Respecting the principals of minimal handling42,43,44, apply the electrodes during routine care or delivery room care. Wear (unsterile) gloves, a gown, a hood, and a mask, according to the institution's guidelines and the patient's infectious status.
- Prepare the skin for the reference electrode, as follows:
- Disinfect the skin. Place skin preparation gel on a cotton swab until it is moist. Apply a few gentle strokes with the cotton swab, using very little pressure. Be very cautious in extremely premature infants between 23 and 25 weeks of gestation to avoid causing lesions on the immature skin.
- Place the reference electrode on the back or the chest of the infant.
- Place the measuring device on the infant's head, and line up the same letters/signs on the infant's tragus and sagittal suture; the two arrows indicate where to place the electrodes (positions C3, P3, C4, and P4 of the 10 - 20 system).
Place the electrodes on the infant's head, following the instructions, below, corresponding to the type of electrodes selected.
- Needle electrodes.
- Disinfect the area indicated by the measuring device.
- Stretch the skin slightly and insert the needle tangentially, just underneath the skin at the markings, with the tip of the needle pointing in the caudal direction. Use tape to keep the electrode in place.
- Repeat the procedure for both/all four electrodes. NOTE: Use needle electrodes in very premature infants, as rubbing for skin preparation is not necessary.
- Gold cups.
- Disinfect the area indicated by the measuring device.
- Prepare the skin in the marked areas, as described in step 2.2.
- Fill each cup with contact gel. Place the cup in the proper position, with the cable running towards the head end; tape it into place.
- Hydrogel electrodes.
- Disinfect the area indicated by the measuring device.
- Prepare the skin in the marked areas, as described in step 2.2.
- Place the electrodes with the cable running towards the head end. Fix the electrodes with tape in case they do not stay in place.
3. Connect the Wires to the Monitor
Insert the cables into the module box, as indicated by the legend on the box.
The default starting screen includes impedance monitoring for all electrodes.
Make sure that all electrodes are in place and that there is no mechanical contact between electrodes. If the impedance of one or more electrodes is not satisfactory, remove the corresponding electrode and perform one or two more strokes with the cotton swab, but do not apply more pressure.
Start the recording when everything is set. NOTE: Obligatory recording parameters are raw EEG and impedance. According to the device and clinical indication, additional options are burst suppression ratio, sharp transient intensity, and spectral edge frequency, among others. Standard parameters for review include raw EEG, amplitude-integrated EEG curve, and impedance. Depending on the device, there is the opportunity to view more features, like spectral edge frequency, or different forms of the presentation of the lower, mean, and upper border. Additional features are seizure detection and burst rate analysis.
4. Optional: Place a CPAP Hat
If required, place a CPAP hat or head band on top of the aEEG electrodes.
5. Aspects to Keep in Mind During the Recording
Regularly check for impedance and the dislocation of electrodes to obtain quality recordings. Also, check the infant for skin irritation to avoid lesions or infections.
Mark events (e.g., handling, kangaroo care (skin-to-skin care), apnea with bradycardia, intubation, and administration of sedatives or opioids) to facilitate the identification of artifacts using the provided button on the screen of the cerebral function monitor. Leave aEEG electrodes in place during kangaroo care to resume the recording afterwards.
Leave aEEG electrodes in place for intubation or other invasive measures to resume the recording later. In case the cables are not long enough to move the infant within the incubator, disconnect them from the module box and reconnect them after the procedure.
6. Review of the aEEG Tracing and Storing
Review the tracing at the end of the recoding on the monitor or transfer it to an external storage device.
Representative Results
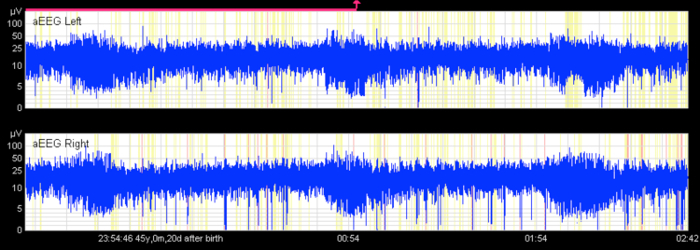
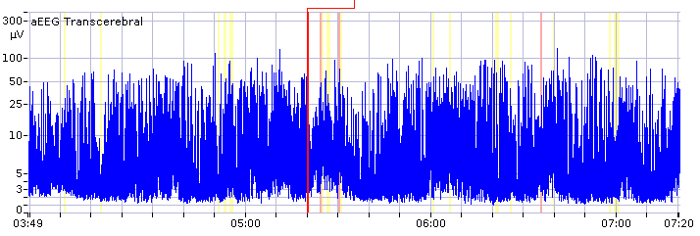
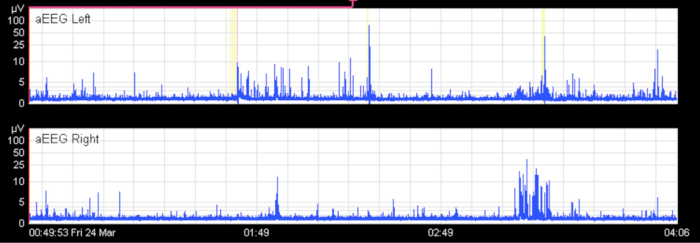
Figure 2 shows a typical view of an aEEG monitor. Continuous and discontinuous normal voltage patterns are considered physiological background patterns in term and preterm infants, respectively (Figure 3 and Figure 4). A burst suppression pattern, continuous low-voltage pattern, and a flat trace are pathological background patterns (Figure 5, Figure 6, Figure 7).


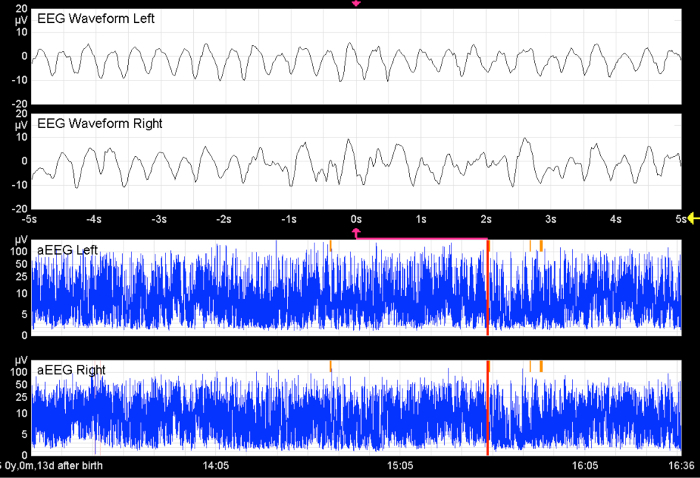
Seizures in term infants have a characteristic shape, with a sudden rise of both the lower and upper border (Figure 8). In preterm infants, however, seizures can be camouflaged by the discontinuous pattern and may only be detected by viewing the raw EEG (Figure 9).

Liquid bridging can cause an apparent flat trace (Figure 10). Usually, this happens in the two-channel aEEG (intraparietal curves). If the cross-cerebral aEEG is physiological, while the intraparietal curve shows a flat trace, the electrodes should be checked for liquids. Electrical interference, movements, and handling can lead to an apparent seizure or even to an apparent status epilepticus. If this happens, impedance and the reference electrode should be checked, and the raw EEG should be viewed (Figure 11). Another reason for an elevation of both the lower and upper border is the displacement of the reference electrode.
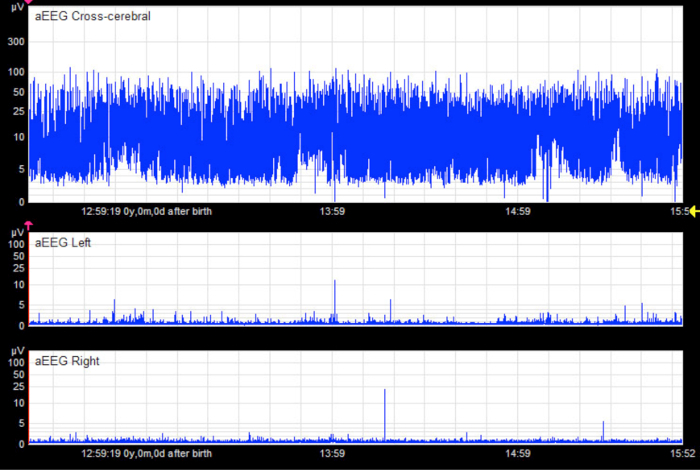
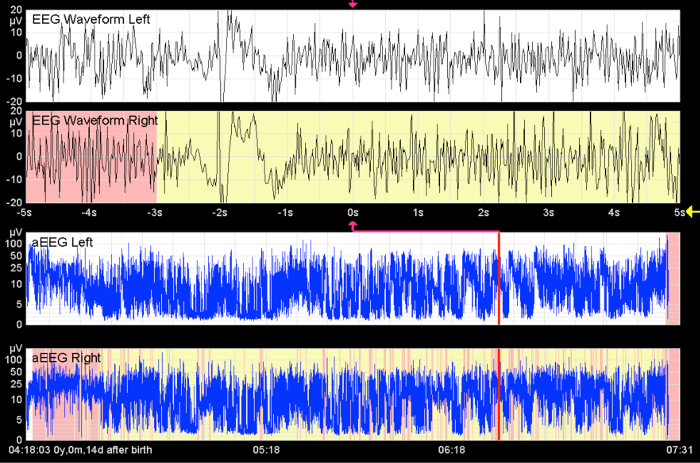
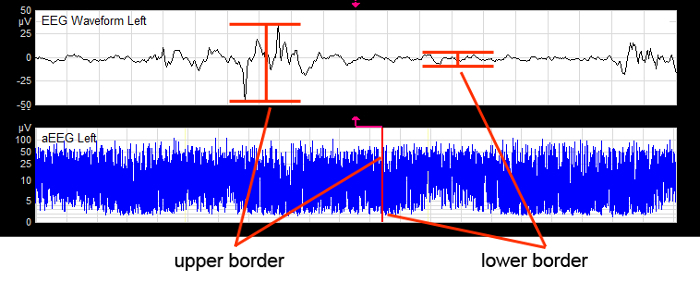
Figure 1. Formation of the aEEG Tracing. The signal from the raw EEG (upper curve) is processed, resulting in the amplitude-integrated EEG band (lower curve). High amplitudes form the upper border, whereas low amplitudes form the lower border. While strong variation in the height of the amplitude leads to a broad aEEG band, the aEEG band is narrow if there is little variation in the height of amplitude. The scale of the y-axis is linear up to 10 µV and logarithmic above 10 µV. Please click here to view a larger version of this figure.
Figure 2. Typical Display of an aEEG Monitor. The upper half of the monitor displays the raw EEG curve (the displayed section equals 10 s). On the left display, the lower half shows the unilateral aEEG tracing (the displayed section equals approximately 3 h). On the right display, the corresponding cross-cerebral tracing is shown. The cursor indicates the section of the amplitude-integrated tracing from the raw EEG. Please click here to view a larger version of this figure.
Figure 3. Continuous Normal Voltage Pattern. Continuous background pattern with sleep-wake cycling. The x-axis equals time (one square = 10 min). Please click here to view a larger version of this figure.
Figure 4. Discontinuous Normal Voltage Pattern. Discontinuous background pattern with imminent sleep-wake cycling. The x-axis equals time (one square = 10 min). Please click here to view a larger version of this figure.
Figure 5. Burst Suppression Pattern. Burst suppression pattern, with the lower amplitude continuously low and without alteration. The x-axis equals time (one square = 10 min). From Bruns, N. Amplituden-integriertes EEG bei extrem unreifen Frühgeborenen in den ersten 4 Lebenswochen. http://www.diss.fu-berlin.de/diss/receive/FUDISS_thesis_000000036576 (2012). Please click here to view a larger version of this figure.
Figure 6. Flat Trace. Flat trace on both sides in a term infant with severe meningoencephalitis. The x-axis equals time (one square = 10 min). From Bruns, N. Amplituden-integriertes EEG bei extrem unreifen Frühgeborenen in den ersten 4 Lebenswochen. http://www.diss.fu-berlin.de/diss/receive/FUDISS_thesis_000000036576 (2012). Please click here to view a larger version of this figure.
Figure 7. Continuous Low-voltage Pattern. Continuous low-voltage pattern without sleep-wake cycling. The x-axis equals time (one square = 10 min). From Bruns, N. Amplituden-integriertes EEG bei extrem unreifen Frühgeborenen in den ersten 4 Lebenswochen. http://www.diss.fu-berlin.de/diss/receive/FUDISS_thesis_000000036576 (2012). Please click here to view a larger version of this figure.
Figure 8. Seizures in Term Infants. Typical depiction of a seizure in the aEEG: a sudden rise of the lower and upper margin is followed by a short period of decreased activity. Repetitive seizures for approximately 3.5 h. The x-axis equals time (one square = 10 min). From Bruns, N. Amplituden-integriertes EEG bei extrem unreifen Frühgeborenen in den ersten 4 Lebenswochen. http://www.diss.fu-berlin.de/diss/receive/FUDISS_thesis_000000036576 (2012). Please click here to view a larger version of this figure.
Figure 9. Seizures in Preterm Infants. Without the raw EEG, the hypersynchronous activity in both hemispheres would remain undetected. The x-axis equals time (one square = 10 min). From Bruns, N. Amplituden-integriertes EEG bei extrem unreifen Frühgeborenen in den ersten 4 Lebenswochen. http://www.diss.fu-berlin.de/diss/receive/FUDISS_thesis_000000036576 (2012). Please click here to view a larger version of this figure.
Figure 10. Apparent Flat Trace. In the unilateral tracings, there appears to be a pathological flat trace pattern in an infant without cerebral injury. The cross-cerebral tracing shows a physiological discontinuous background pattern with short sections of continuous activity. In this case, the flat trace is an artifact caused by liquid bridging between electrodes (especially hydrogel electrodes). The x-axis equals time (one square = 10 min). From Bruns, N. Amplituden-integriertes EEG bei extrem unreifen Frühgeborenen in den ersten 4 Lebenswochen. http://www.diss.fu-berlin.de/diss/receive/FUDISS_thesis_000000036576 (2012). Please click here to view a larger version of this figure.
Figure 11. Apparent Seizures. This image shows high-frequency activity over a long period of time. Without seeing the raw EEG curve, status epilepticus is indicated. This artifact is caused by muscle activity. The x-axis equals time (one square = 10 min). From Bruns, N. Amplituden-integriertes EEG bei extrem unreifen Frühgeborenen in den ersten 4 Lebenswochen. http://www.diss.fu-berlin.de/diss/receive/FUDISS_thesis_000000036576 (2012). Please click here to view a larger version of this figure.
Discussion
The cerebral function monitor is an easily accessible and increasingly common device used to record amplitude-integrated EEGs in NICUs13. In routine care, the application of an aEEG takes 3 - 5 min.
Critical steps within this protocol are the correct placement of the electrodes on the head and the connection of the cables to the corresponding plug of the module box. Electrode placement needs to be preceded by thorough skin disinfection and preparation, especially for the reference electrode. In our experience, the best-quality recordings are achieved when the reference electrode is placed on the back of the infant. For troubleshooting, electrodes should be checked for dislocation in case of high impedance. If electrode dislocation has been disclosed and repetition of skin preparation fails, the electrode may need to be replaced. In case of an offset of the upper border, the reference electrode needs to be optimized. A high frequency and high amplitude of both the raw EEG and amplitude-integrated EEG are caused by muscle activity or interferences (e.g., high-frequency oscillation ventilation). This part of the tracing cannot be used for interpretation. If a flat trace occurs in a cerebrally healthy infant, the cross-cerebral tracing should be viewed. If this is normal, it is likely that liquids like sweat or ultrasound gel have caused bridging between two electrodes. In case of persisting problems, manufacturers have contact persons that will help to determine a solution and will even come to the NICU to check for underlying causes. In our experience, needle electrodes are the recommended type of electrodes in very premature infants. After thorough disinfection and gentle skin preparation of the reference electrode, we did not observe a significant number of infections, serious skin lesions, or bleeding events since the beginning of the large-scale use of this technique in our center in 2008 (an average of 60 - 80 very low birth weight infants per year, 1 - 5 recordings per infant). Since 2014, we have only used needle electrodes in all neonates, as we achieve the best results using this type of electrode.
Modifications of the aEEG are not commonly performed, but electrodes could be placed in any position on the head to acquire a desired tracing (from the international 10 - 20 system). In some cases, the electrode position may need to be adjusted (e.g., due to skin lacerations after vacuum extraction or cephalohematoma)45. For classification according to amplitudes, it is important to maintain a standard interelectrode distance, as a reduction in interelectrode distance results in a reduction of amplitude39,45. In case of extreme head sizes, such extremely premature infants (i.e., 23 - 24 weeks of gestation) or term infants with augmented head circumference due to hydrocephalus, the importance of the interelectrode distance for interpretation should be kept in mind. Another modification of the traditional aEEG is the continuously monitored limited-channel EEG18,46,47. The raw EEG curve derived from the cerebral function monitor can be assessed like a conventional EEG curve. In our center, we use this approach to answer special problems regarding newborn neuropediatric patients, in close collaboration with our pediatric neurologists.
The main limitation of the aEEG is the fact that only a small area of the brain surface is covered by the tracing. Thus, alterations of electrocortical activity in different areas of the brain surface may remain unnoticed13. Due to the time compression, short-lasting changes of cerebral activity are difficult to detect without using the raw EEG curve. Further interpretation of the raw EEG curve requires knowledge about the conventional EEG or close cooperation with neurophysiologists or pediatric neurologists. Last, but not least, there are several external and internal factors that cause alterations in the aEEG band that must be kept in mind when interpreting the tracing.
Nonetheless, the aEEG offers the possibility for continuous cerebral function monitoring in neonates. It is easily accessible, and interpretation is not difficult. As it contains less information than a conventional EEG, it cannot replace this technique. Rather, it complements the existing means for cerebral diagnostics, such as EEG, ultrasound, and magnetic resonance imaging. There is good evidence for the prediction of outcome after birth asphyxia in term infants, and the aEEG has been established as a tool to identify infants who will benefit from cooling8. In preterm infants, there is also good evidence that long-term neurological outcome can be predicted by early aEEG recordings15,16,17,18,19,20. However, to date, this knowledge does not result in consequences for clinical decision making in this population of infants. For the future, it is likely that cerebral function monitoring will become a standard tool in NICUs, as well as in secondary centers and pediatric intensive care units.
Disclosures
The authors have nothing to disclose.
Acknowledgments
We thank our nurses for their support and contributions to the making of the video.
References
- Maynard D, Prior PF, Scott DF. Device for continuous monitoring of cerebral activity in resuscitated patients. Br Med J. 1969;4(5682):545–546. doi: 10.1136/bmj.4.5682.545-a. [DOI] [PMC free article] [PubMed] [Google Scholar]
- Greisen G, Hellström-Westas L, Lou H, Rosén I, Svenningsen NW. EEG depression and germinal layer haemorrhage in the newborn. Acta Paediatr Scand. 1987;76(3):519–525. doi: 10.1111/j.1651-2227.1987.tb10509.x. [DOI] [PubMed] [Google Scholar]
- Greisen G, Pryds O, Rosén I, Lou H. Poor reversibility of EEG abnormality in hypotensive, preterm neonates. Acta Paed Scand. 1988;77(6):785–790. doi: 10.1111/j.1651-2227.1988.tb10756.x. [DOI] [PubMed] [Google Scholar]
- Hellström-Westas L, Rosén I, Svenningsen NW. Predictive value of early continuous amplitude integrated EEG recordings on outcome after severe birth asphyxia in full term infants. Arch Dis Child Fetal Neonatal Ed. 1995;72(1):F34–F38. doi: 10.1136/fn.72.1.f34. [DOI] [PMC free article] [PubMed] [Google Scholar]
- Shellhaas RA, Kushwaha JS, Plegue MA, Selewski DT, Barks JDE. An evaluation of cerebral and systemic predictors of 18-month outcomes for neonates with hypoxic ischemic encephalopathy. J Child Neurol. 2015;30(11):1526–1531. doi: 10.1177/0883073815573319. [DOI] [PMC free article] [PubMed] [Google Scholar]
- Gluckman PD, et al. Selective head cooling with mild systemic hypothermia after neonatal encephalopathy: multicentre randomised trial. Lancet. 2005;365(9460):663–670. doi: 10.1016/S0140-6736(05)17946-X. [DOI] [PubMed] [Google Scholar]
- Hellström-Westas L, Rosén I. Continuous brain-function monitoring: state of the art in clinical practice. Semin Fetal Neonatal Med. 2006;11(6):503–511. doi: 10.1016/j.siny.2006.07.011. [DOI] [PubMed] [Google Scholar]
- Rosén I. The physiological basis for continuous electroencephalogram monitoring in the neonate. Clin Perinatol. 2006;33(3):593–611. doi: 10.1016/j.clp.2006.06.013. [DOI] [PubMed] [Google Scholar]
- Davis AS, et al. Serial aEEG recordings in a cohort of extremely preterm infants: feasibility and safety. J Perinatol. 2015;35(5):373–378. doi: 10.1038/jp.2014.217. [DOI] [PMC free article] [PubMed] [Google Scholar]
- Benavente-Fernández I, Lubián-López SP, Jiménez-Gómez G, Lechuga-Sancho AM, Garcia-Alloza M. Low-voltage pattern and absence of sleep-wake cycles are associated with severe hemorrhage and death in very preterm infants. Eur J Pediatr. 2015;174(1):85–90. doi: 10.1007/s00431-014-2360-0. [DOI] [PubMed] [Google Scholar]
- Klebermass K, et al. Amplitude-integrated EEG pattern predicts further outcome in preterm infants. Pediatr Res. 2011;70(1):102–108. doi: 10.1203/PDR.0b013e31821ba200. [DOI] [PubMed] [Google Scholar]
- Soubasi V, et al. Early abnormal amplitude-integrated electroencephalography (aEEG) is associated with adverse short-term outcome in premature infants. Eur J Paediatr Neurol. 2012;16(6):625–630. doi: 10.1016/j.ejpn.2012.02.008. [DOI] [PubMed] [Google Scholar]
- Wikström S, et al. Early single-channel aEEG/EEG predicts outcome in very preterm infants. Acta Paediatr. 2012;101(7):719–726. doi: 10.1111/j.1651-2227.2012.02677.x. [DOI] [PMC free article] [PubMed] [Google Scholar]
- Welch C, Helderman J, Williamson E, O'Shea TM. Brain wave maturation and neurodevelopmental outcome in extremely low gestational age neonates. J Perinatol. 2013;33(11):867–871. doi: 10.1038/jp.2013.79. [DOI] [PubMed] [Google Scholar]
- Bruns N, et al. Comparison of two common aEEG classifications for the prediction of neurodevelopmental outcome in preterm infants. Eur J Pediatr. 2016;176(2):1–9. doi: 10.1007/s00431-016-2816-5. [DOI] [PMC free article] [PubMed] [Google Scholar]
- Eken P, Toet MC, Groenendaal F, de Vries LS. Predictive value of early neuroimaging, pulsed Doppler and neurophysiology in full term infants with hypoxic-ischaemic encephalopathy. Arch Dis Child Fetal Neonatal Ed. 1995;73(2):F75–F80. doi: 10.1136/fn.73.2.f75. [DOI] [PMC free article] [PubMed] [Google Scholar]
- Shalak LF, Laptook AR, Velaphi SC, Perlman JM. Amplitude-integrated electroencephalography coupled with an early neurologic examination enhances prediction of term infants at risk for persistent encephalopathy. Pediatrics. 2003;111(2):351–357. doi: 10.1542/peds.111.2.351. [DOI] [PubMed] [Google Scholar]
- Marics G, et al. Prevalence and etiology of false normal aEEG recordings in neonatal hypoxic-ischaemic encephalopathy. BMC Pediatr. 2013;13(1):194. doi: 10.1186/1471-2431-13-194. [DOI] [PMC free article] [PubMed] [Google Scholar]
- Azzopardi DV, et al. Moderate hypothermia to treat perinatal asphyxial encephalopathy. N Engl J Med. 2009;361(14):1349–1358. doi: 10.1056/NEJMoa0900854. [DOI] [PubMed] [Google Scholar]
- Azzopardi D TOBY study group. Predictive value of the amplitude integrated EEG in infants with hypoxic ischaemic encephalopathy: data from a randomised trial of therapeutic hypothermia. Arch Dis Child Fetal Neonatal Ed. 2014;99(1):F80–F82. doi: 10.1136/archdischild-2013-303710. [DOI] [PMC free article] [PubMed] [Google Scholar]
- Hellström-Westas L, Rosén I, de Vries LS, Greisen G. Amplitude-integrated EEG Classification and Interpretation in Preterm and Term Infants. NeoReviews. 2006;7(2):e76–e87. [Google Scholar]
- Shah DK, et al. Accuracy of bedside electroencephalographic monitoring in comparison with simultaneous continuous conventional electroencephalography for seizure detection in term infants. Pediatrics. 2008;121(6):1146–1154. doi: 10.1542/peds.2007-1839. [DOI] [PubMed] [Google Scholar]
- Sisman J, Campbell DE, Brion LP. Amplitude-integrated EEG in preterm infants: maturation of background pattern and amplitude voltage with postmenstrual age and gestational age. J Perinatol. 2005;25(6):391–396. doi: 10.1038/sj.jp.7211291. [DOI] [PubMed] [Google Scholar]
- Olischar M, et al. Reference values for amplitude-integrated electroencephalographic activity in preterm infants younger than 30 weeks' gestational age. Pediatrics. 2004;113(1 Pt 1):e61–e66. doi: 10.1542/peds.113.1.e61. [DOI] [PubMed] [Google Scholar]
- Burdjalov VF, Baumgart S, Spitzer AR. Cerebral function monitoring: a new scoring system for the evaluation of brain maturation in neonates. Pediatrics. 2003;112(4):855–861. doi: 10.1542/peds.112.4.855. [DOI] [PubMed] [Google Scholar]
- Viniker DA, Maynard DE, Scott DF. Cerebral function monitor studies in neonates. Clin Electroencephalogr. 1984;15(4):185–192. doi: 10.1177/155005948401500401. [DOI] [PubMed] [Google Scholar]
- Hellström-Westas L. Continuous electroencephalography monitoring of the preterm infant. Clin Perinatol. 2006;33(3):633–647. doi: 10.1016/j.clp.2006.06.003. [DOI] [PubMed] [Google Scholar]
- Hayakawa M. Background electroencephalographic (EEG) activities of very preterm infants born at less than 27 weeks gestation: a study on the degree of continuity. Arch Dis Child Fetal Neonatal Ed. 2001;84(3):163. doi: 10.1136/fn.84.3.F163. [DOI] [PMC free article] [PubMed] [Google Scholar]
- Vecchierini MF, d'Allest AM, Verpillat P. EEG patterns in 10 extreme premature neonates with normal neurological outcome: qualitative and quantitative data. Brain Dev. 2003;25(5):330–337. doi: 10.1016/s0387-7604(03)00007-x. [DOI] [PubMed] [Google Scholar]
- Hellström-Westas L, Rosén I, Svenningsen N. Cerebral Function Monitoring During the First Week of Life in Extremely Small Low Birthweight (ESLBW) Infants. Neuropediatrics. 1991;22(01):27–32. doi: 10.1055/s-2008-1071411. [DOI] [PubMed] [Google Scholar]
- Connell J, et al. Continuous four-channel EEG monitoring in the evaluation of echodense ultrasound lesions and cystic leucomalacia. Arch Dis Child. 1987;62(10):1019–1024. doi: 10.1136/adc.62.10.1019. [DOI] [PMC free article] [PubMed] [Google Scholar]
- Bruns N, Metze B, Bührer C, Felderhoff-Müser U, Hüseman D. Electrocortical Activity at 7 Days of Life is Affected in Extremely Premature Infants with Patent Ductus Arteriosus. Klin Padiatr. 2015;227(5):264–268. doi: 10.1055/s-0035-1547309. [DOI] [PubMed] [Google Scholar]
- Thorngate L, Foreman SW, Thomas KA. Quantification of neonatal amplitude-integrated EEG patterns. Early Hum Dev. 2013;89(12):931–937. doi: 10.1016/j.earlhumdev.2013.09.018. [DOI] [PMC free article] [PubMed] [Google Scholar]
- West CR, Harding JE, Williams CE, Gunning MI, Battin MR. Quantitative electroencephalographic patterns in normal preterm infants over the first week after birth. Early Hum Dev. 2006;82(1):43–51. doi: 10.1016/j.earlhumdev.2005.07.009. [DOI] [PubMed] [Google Scholar]
- ter Horst HJ, van Olffen M, Remmelts HJ, de Vries H, Bos AF. The prognostic value of amplitude integrated EEG in neonatal sepsis and/or meningitis. Acta Paediatr. 2010;99(2):194–200. doi: 10.1111/j.1651-2227.2009.01567.x. [DOI] [PubMed] [Google Scholar]
- Eaton DG, Wertheim D, Oozeer R, Dubowitz LM, Dubowitz V. Reversible changes in cerebral activity associated with acidosis in preterm neonates. Acta Paediatr. 1994;83(5):486–492. doi: 10.1111/j.1651-2227.1994.tb13064.x. [DOI] [PubMed] [Google Scholar]
- Victor S, Appleton RE, Beirne M, Marson AG, Weindling AM. Effect of carbon dioxide on background cerebral electrical activity and fractional oxygen extraction in very low birth weight infants just after birth. Pediatr Res. 2005;58(3):579–585. doi: 10.1203/01.pdr.0000169402.13435.09. [DOI] [PubMed] [Google Scholar]
- West CR, et al. Early low cardiac output is associated with compromised electroencephalographic activity in very preterm infants. Pediatr Res. 2006;59(4 Pt 1):610–615. doi: 10.1203/01.pdr.0000203095.06442.ad. [DOI] [PubMed] [Google Scholar]
- Quigg M, Leiner D. Engineering aspects of the quantified amplitude-integrated electroencephalogram in neonatal cerebral monitoring. J Clin Neurophysiol. 2009;26(3):145–149. doi: 10.1097/WNP.0b013e3181a18711. [DOI] [PubMed] [Google Scholar]
- Toet MC, Lemmers PMA. Brain monitoring in neonates. Early Hum Dev. 2009;85(2):77–84. doi: 10.1016/j.earlhumdev.2008.11.007. [DOI] [PubMed] [Google Scholar]
- Hagmann CF, Robertson NJ, Azzopardi D. Artifacts on electroencephalograms may influence the amplitude-integrated EEG classification: a qualitative analysis in neonatal encephalopathy. Pediatrics. 2006;118(6):2552–2554. doi: 10.1542/peds.2006-2519. [DOI] [PubMed] [Google Scholar]
- Als H, et al. Individualized developmental care for the very low-birth-weight preterm infant. Medical and neurofunctional effects. JAMA. 1994;272(11):853–858. [PubMed] [Google Scholar]
- Jacobsen T, Grønvall J, Petersen S, Andersen GE. "Minitouch" treatment of very low-birth-weight infants. Acta Paediatr. 1993;82(11):934–938. doi: 10.1111/j.1651-2227.1993.tb12603.x. [DOI] [PubMed] [Google Scholar]
- Vandenberg KA. Individualized developmental care for high risk newborns in the NICU: a practice guideline. Early Hum Dev. 2007;83(7):433–442. doi: 10.1016/j.earlhumdev.2007.03.008. [DOI] [PubMed] [Google Scholar]
- Hellström-Westas L, de Vries LS, Rosén I. An Atlas of Amplitude-Integrated EEGs in the Newborn. 2nd ed. London: Informa Health Care; 2008. [Google Scholar]
- Iyer KK, et al. Early Detection of Preterm Intraventricular Hemorrhage from Clinical Electroencephalography. Crit Care Med. 2015;43(10):2219–2227. doi: 10.1097/CCM.0000000000001190. [DOI] [PubMed] [Google Scholar]
- Hellström-Westas L, Rosén I. Electroencephalography and brain damage in preterm infants. Early Hum Dev. 2005;81(3):255–261. doi: 10.1016/j.earlhumdev.2005.01.006. [DOI] [PubMed] [Google Scholar]


