Abstract
Oxygen-induced retinopathy (OIR) is a widely used model to study ischemia-driven neovascularization (NV) in the retina and to serve in proof-of-concept studies in evaluating antiangiogenic drugs for ocular, as well as nonocular, diseases. The primary parameters that are analyzed in this mouse model include the percentage of retina with vaso-obliteration (VO) and NV areas. However, quantification of these two key variables comes with a great challenge due to the requirement of human experts to read the images. Human readers are costly, time-consuming, and subject to bias. Using recent advances in machine learning and computer vision, we trained deep learning neural networks using over a thousand segmentations to fully automate segmentation in OIR images. While determining the percentage area of VO, our algorithm achieved a similar range of correlation coefficients to that of expert inter-human correlation coefficients. In addition, our algorithm achieved a higher range of correlation coefficients compared with inter-expert correlation coefficients for quantification of the percentage area of neovascular tufts. In summary, we have created an open-source, fully automated pipeline for the quantification of key values of OIR images using deep learning neural networks.
Keywords: Angiogenesis, Ophthalmology
Keywords: Retinopathy
An open-source, fully automated pipeline for the quantification of key values of oxygen-induced retinopathy images using deep learning neural networks.
Introduction
Over the past 30 years, advances in our understanding of basic mechanisms of normal and abnormal angiogenesis have had a significant effect on the fields of cancer, cardiovascular, and ophthalmology research. Novel therapeutics, such as antivascular endothelial growth factor agents that target neovessel formation, play an important role in cancer therapy (1) and have revolutionized the therapeutic approach for neovascular retinal diseases, such as age-related macular degeneration and diabetic retinopathy (2). Due to its unique anatomical properties, the eye represents an ideal model system to study basic mechanisms in angiogenic diseases and to test novel antiangiogenic therapeutics (3).
The mouse model of oxygen-induced retinopathy (OIR) is one of the most commonly used rodent models to study ischemia-driven abnormal neovessel formation and retinal vasoproliferative disease (4). In this model, young pups at P7 exposed to an atmosphere containing 75% oxygen, which induces regression of the central capillary system, resulting in a centralized area of vaso-obliteration (VO). When pups are then transferred to room air on P12, this area of VO becomes hypoxic and triggers neovascularization (NV), resulting in the growth of abnormal vessels toward the vitreous (5). At P17, VO and NV areas represent primary readout parameters in this model.
High variability due to a volatile vascular phenotype and a subjective manual quantification method of assessing VO and NV represent the greatest challenges in this model. Controlling for body weight gain in pups and comparison to control-treated groups greatly improve reproducibility of OIR results (6). However, existing quantification protocols used to determine VO and NV areas still remain an important source for variability of OIR data within and between research groups (5, 7, 8). VO and NV quantification require expert knowledge, are prone to bias in the case of unmasked quantifiers, and remain heavily time-consuming. Automating this process will further improve the reproducibility of OIR experiments within and among labs working with this model. Prior attempts have led to partial automation of the segmentation tasks but still required several manual, subjective steps (8–10). Full automation will ensure common standards for the detection of VO and NV, eliminate the risk for user-dependent bias, and accelerate the quantification process, freeing valuable staff resources.
Using deep learning, the goal of our study was to create and validate a fully automated algorithm to segment the VO and NV regions on OIR images. Machine learning is the general field of training predictive models on large data sets with computers. The predictive models can be built implicitly or explicitly with hand-crafted features that best extract signal from noise in the data. Deep learning is a subfield of machine learning in which feature construction is automated and learned implicitly through a purely data-driven approach using many layers of neural networks.
The development of deeper neural networks has been facilitated by the advent of graphics-processing units suited for efficient evaluation of convolution as well as new neural network architectures. Recently, deep learning has revolutionized computer vision tasks, such as classification, object detection, and semantic segmentation (11–14), and is increasingly used in ophthalmic image-processing applications (15–18).
Here, we present an end-to-end solution using deep learning to automatically quantify VO and NV as primary readout parameters of the OIR retinal image.
Results
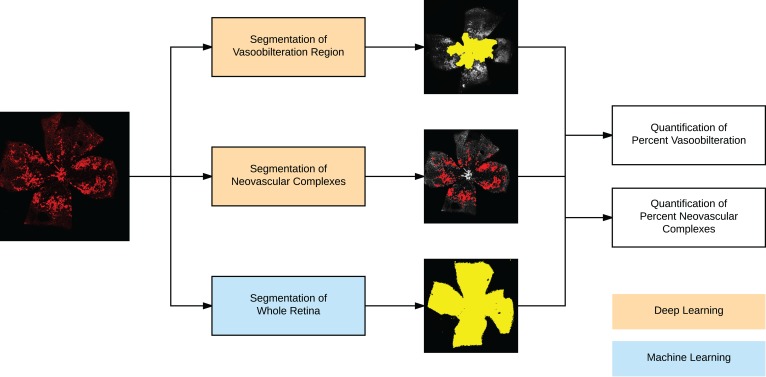
An overview of the fully automated pipeline is provided in Figure 1. As a standard machine learning practice, over a thousand images were used to develop and train the deep learning model and were divided into three sets: training, validation, and test (19). There were 682, 171, and 214 images in each set, respectively, for the two deep learning models (Figure 2).
Figure 1. Overview of the fully automated analysis pipeline for oxygen-induced retinopathy images.
The input image is fed through 3 separate fully automated methods: Segmentation of the vaso-obliteration region using deep learning, segmentation of the neovascular complexes using deep learning, and segmentation of the whole retina. These are combined to calculate quantitative ratios of the percentage of vaso-obliteration and percentage of neovascular complexes.
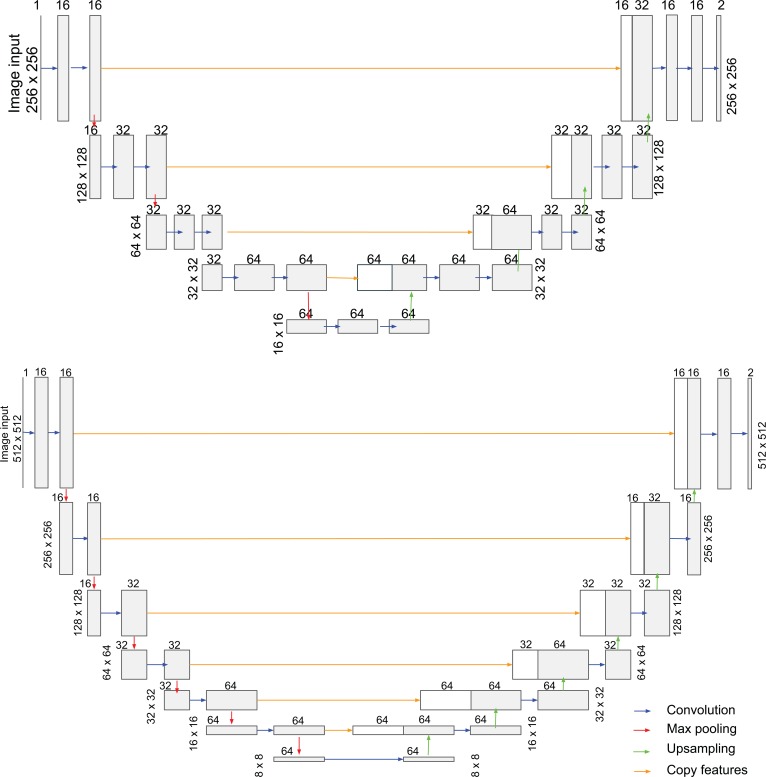
Figure 2. Deep learning model architectures used for vaso-obliteration and neovascular segmentation.
The U-net architecture for vaso-obliteration (VO) segmentation (top) and neovascularization (NV) segmentation (bottom). For each convolutional layer, the filter size is 3 and the stride is 1. The number of filters is labeled on top of its corresponding layer. ReLU was used as the activation function. The receptive fields were 140 × 140 and 318 × 318 for VO and NV segmentation, respectively.
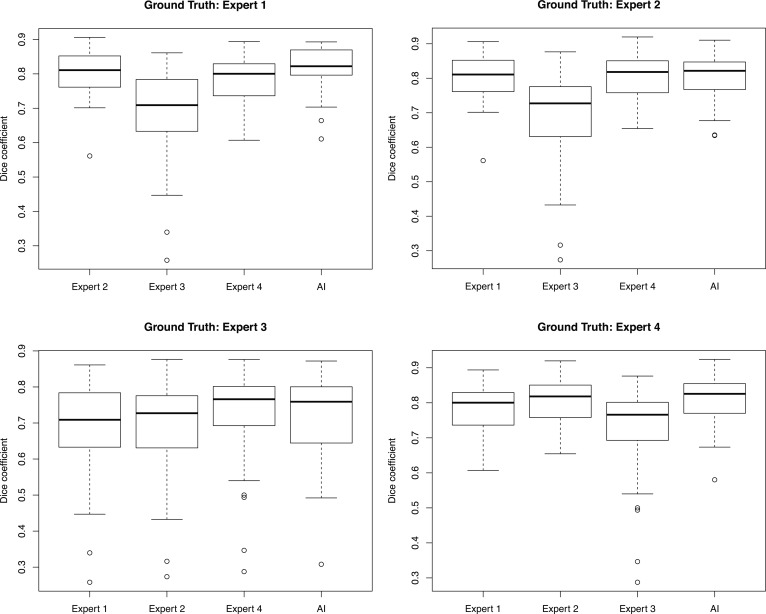
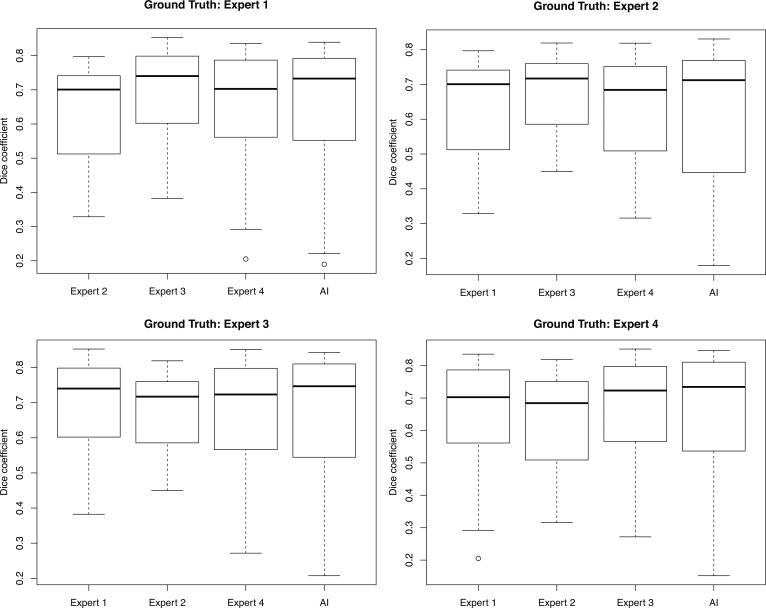
For training the segmentation of the VO region, the model was trained with 14,000 iterations of batch sizes of 32. The learning curve of the training iterations and the validation set are shown in Supplemental Figure 1 (supplemental material available online with this article; https://doi.org/10.1172/jci.insight.97585DS1). For the test set, the model achieved a median Dice coefficient of 0.870, with a standard deviation of 0.135. Examples of model outputs are shown in Figure 3. A separate test set of 37 images was segmented by 4 human experts as well as the final trained deep learning model. Each human expert was set as the gold standard, and the other 3 human experts as well the deep learning model were compared with the gold standard (Figure 4).
Figure 3. Example segmentations of vaso-obliteration region.
The left column shows the original image, the middle column shows expert segmentations, and the right column shows deep learning segmentation.
Figure 4. Inter-rater reliability with 4 human expert segmentations compared with deep learning for vaso-obliteration region.
Inter-rater reliability with 37 images segmented by 4 human experts and the deep learning model for vaso-obliteration segmentation. Each set of box plots represents a different human expert set as ground truth compared against the other 3 human experts and the deep learning model using Dice coefficients. The middle bar represents the median, the box represents the interquartile range, and the whiskers extend to the most extreme data point, which is no more than 1.5 times the interquartile range from the box.
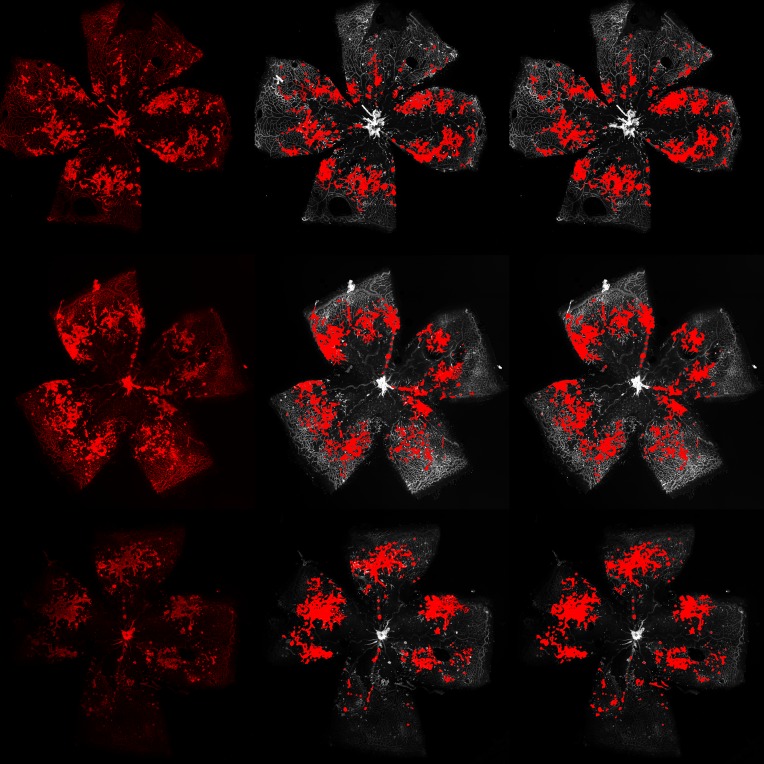
For the training of the neovascular complexes, the model was trained with 60,000 iterations of batch sizes of 8. The learning curve of the training iterations and the validation set are shown in Supplemental Figure 2. The model achieved a median Dice coefficient of 0.750, with a standard deviation of 0.156, for the test set. Examples of model outputs are shown in Figure 5. Similar to the inter-rater reliability results for VOR, the trained deep learning model was able to achieve similar median Dice coefficients as human experts for a separate set of 37 images (Figure 6).
Figure 5. Example segmentations of neovascular tufts.
The left column shows the original image, the middle column shows expert segmentations, and the right column shows deep learning segmentation.
Figure 6. Inter-rater reliability with 4 human expert segmentations compared with deep learning for neovascular tufts.
Inter-rater reliability with 37 images segmented by 4 human experts and the deep learning model for neovascular segmentation. Each set of box plots represents a different human expert set as ground truth compared against the other 3 human experts and the deep learning model using Dice coefficients. The middle bar represents the median, the box represents the interquartile range, and the whiskers extend to the most extreme data point, which is no more than 1.5 times the interquartile range from the box.
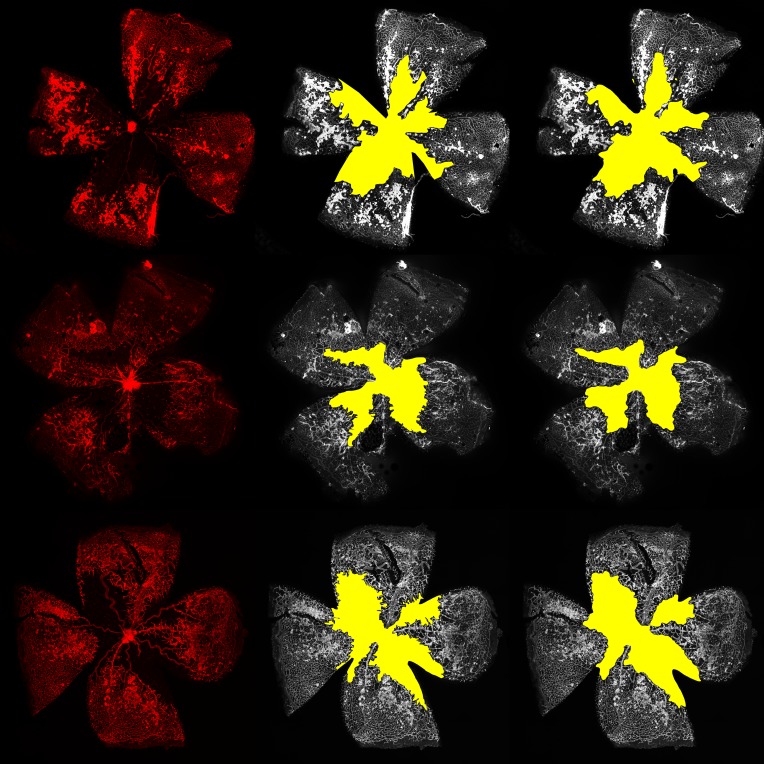
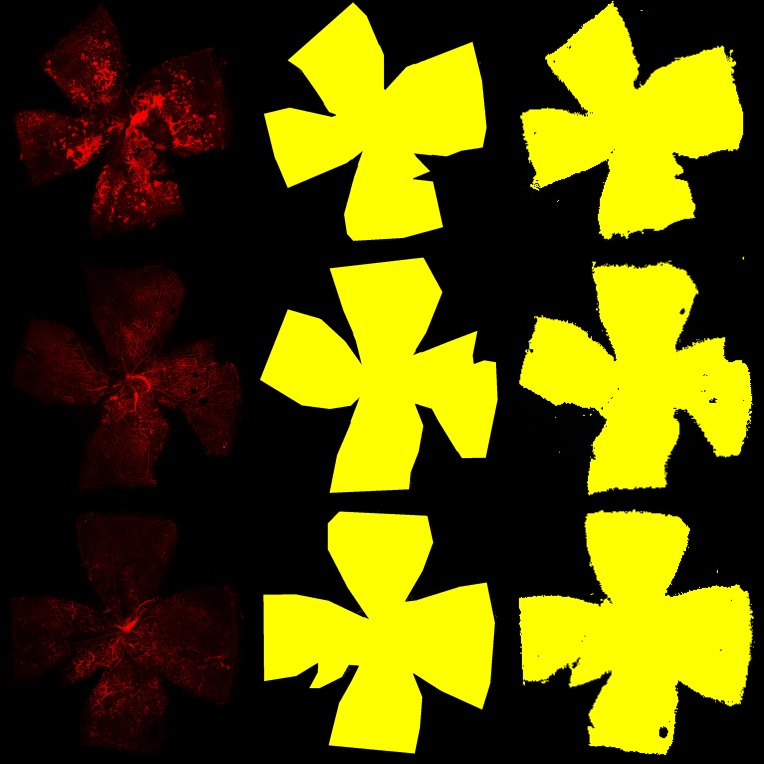
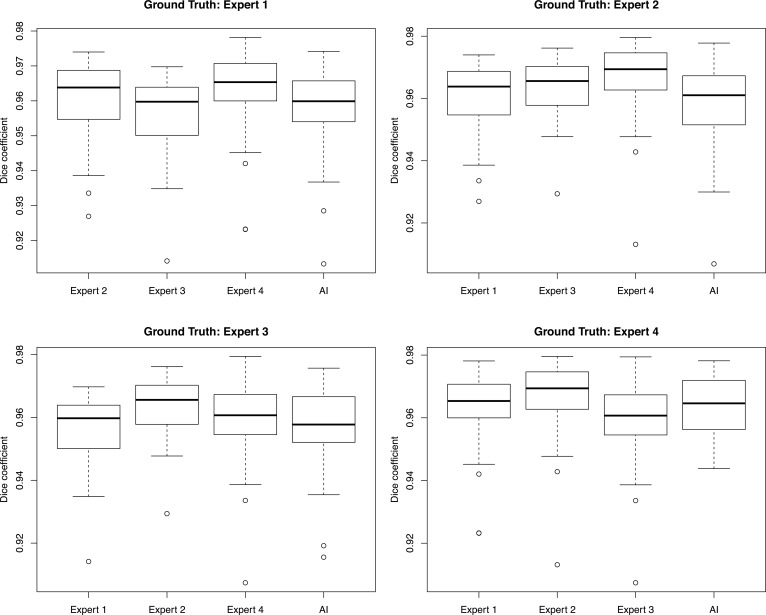
In order to fully automate the segmentation of the total retina, the k-means clustering algorithm was able to segment and identify the total retina. For the 37 retina images segmented by humans, the algorithm achieved a median Dice coefficient of 0.960, with a standard deviation of 0.013. Examples of algorithm outputs are shown in Figure 7. The median Dice coefficients between the automated segmentations were similar to the median Dice coefficients among the human experts (Figure 8).
Figure 7. Examples of retina segmentation.
The left column shows the input images, the middle column shows the human expert-labeled segmentations, and the right column shows the model prediction.
Figure 8. Inter-rater reliability with 4 human expert segmentations compared with deep learning for retina.
Inter-rater reliability with 37 images segmented by 4 human experts and the deep learning model for total retinal area. Each set of box plots represents a different human expert set as ground truth compared against the other 3 human experts and the deep learning model using Dice coefficients. The middle bar represents the median, the box represents the interquartile range, and the whiskers extend to the most extreme data point, which is no more than 1.5 times the interquartile range from the box.
For the 37 images that served as an independent test set, the deep learning–based algorithm generated two percentages: VO relative to the total retina and NV complexes relative to the total retina. Tables 1 and 2 show the linear correlation between each pairwise comparison of human experts and the deep learning algorithm for the VO and NV percentages, respectively.
Table 1. Correlation coefficients of the percentage of total retina with VO regions for each pairwise comparison.

Table 2. Correlation coefficients of the percentage of total retina with NV regions for each pairwise comparison.

The code for this project has been published online as a free, public, open-source repository (https://github.com/uw-biomedical-ml/oir/tree/bf75f9346064f1425b8b9408ab792b1531a86c64). This repository contains setup instructions, the trained model architectures, the trained weights of all the models, software code for running the fully automated pipeline, and generation of formatted results. Users will be able to download this repository to further train the models if they wish. In addition, we have created an online web application located at http://oirseg.org where users may upload images that need to be processed and download the resulting segmentations and quantification results, without the need to setup any software locally.
Discussion
In this study, we have created a fully automated tool for the quantification of OIR images using a deep learning approach. The mouse model of OIR represents one of the most commonly used in vivo models to study basic mechanisms in ocular angiogenesis and test potential antiangiogenic therapeutics. In this model, reproducibility of experimental results can represent a major challenge due to high variability in the vascular phenotype. In addition, manual analysis of the model’s readout parameters, area of VO and NV, is a time-consuming process, requiring expert knowledge and thus significant costs. While monitoring of confounders such as body weight can minimize the variability of the vascular phenotype, only fully automated quantification tools can eliminate potential grader bias.
Our fully automated deep learning approach identified and segmented the areas of VO and NV in the OIR images with high correlation to 4 separate expert human graders. After training with 682 images, the model achieved a mean Dice coefficient that is similar to inter-rater Dice coefficients when comparing those of human experts for the segmentation of VO area and NV regions. In addition, machine learning was used to identify the area of total retina in a fully automated fashion. We noted that with VO segmentation, the deep learning model generated smoother contours compared with expert graders (Figure 3). These differences did not translate to a difference in Dice coefficients or to a difference between the correlation of percent VO area. Our algorithm achieved a similar range of correlation coefficients (range 0.878–0.951) to expert inter-human correlation coefficients (range: 0.889–0.951) for quantification of the percentage area of VO. On inspection, deep learning appeared to generate segmentations that look very similar to human segmentations for neovascular complexes (Figure 5), and machine learning generated much more precise segmentations of the total retina and was able to ignore artifacts of the flat-mount preparation (Figure 7). Our algorithm achieved a higher range of correlation coefficients (range: 0.943–0.987) compared with inter-expert correlation coefficients (range: 0.925–0.972) for quantification of the percentage area of neovascular complexes. Because the contrast was varied during training of the models, the resulting algorithm is resistant to varying levels of contrast inherent in the OIR images (Figure 5, bottom row).
Prior attempts to automate this process have resulted in solutions that were partially automated but still required subjective manual input. Doelemeyer et al. described a computer-aided system in which the user traced the whole retina before the quantification of the VO region could be segmented, but the system could not quantify the neovascular regions (9, 10). Stahl et al. achieved automated segmentation of the neovascular regions but required manual segmentation of the VO region. Furthermore, automated quantification of the NV area required manual thresholding of the intensity in each quadrant of the whole-mount retina image, which may be subjectively biased (8). In contrast, we achieved a fully automated pipeline, which only takes the whole retina image as input and provides automated segmentation of the VO region, neovascular complexes, and whole retina. The algorithm also provides quantitative measures that can easily be incorporated into statistical analyses.
Key strengths of the study include the fully automated pipeline and the efficiency of the algorithm. The segmentation of VO and NV regions in each OIR image took less than few seconds, which makes the algorithm scalable to many hundreds or thousands of OIR images. In addition, the algorithm can run on a standard desktop computer without the need for specialized hardware.
Limitations of our study are that our models were trained on images of the mouse model of OIR generated from a single laboratory. Our models are currently not trained to segment images from the rat model of OIR. Furthermore, training on images generated from a single laboratory may also result in decreased generalizability, if there are systematic biases in which these images were graded. In that case, the algorithm may seem to perform poorly when compared with segmentations from a different laboratory. Future studies to collect segmentations from several key research groups to further train the model will be critical in improving the generalizability of the automated pipeline.
In general, automating the analysis of OIR images may not only improve the efficiency but also the overall quality of OIR results. All labs using this tool will automatically apply the same standards for the identification of VO and NV, thereby increasing the generalizability and reproducibility of study results. Future extensions of the tool may also include estimates of model accuracy of the deep learning segmentation and improved model accuracy as more images are used for training. This parameter would substantially depend on the original image quality and hence represent an important parameter to estimate the quality of flat-mount preparation and imaging.
The described pipeline may also open the door to simultaneously look at more readout parameters and detect more subtle changes in this model. For example, Fruttiger and colleagues suggested using vascular tortuosity as an early outcome measure in OIR (20). Other parameters affected by OIR include vascular density, diameter, and branching points, which together provide important insight into the health of the vascular bed (21). Currently, these parameters are not part of routine analyses because of the time and effort that would be required for their quantification. However, similar approaches to those performed in this study may provide a fully automated solution for an objective quantification of subtle vascular changes.
In summary, we present a fully automated analysis pipeline as a free and open-source analysis package for an objective quantification of the percentage area of VO and NV in OIR images. Our software tool will allow OIR researchers to shift resources from the repetitive and time-consuming quantification process that requires expert training to more important tasks, such as data analysis and experimental planning. Future extensions of this tool could include a web-based segmentation system in which experts can provide corrected feedback for online iterative training of the deep learning models.
Methods
In this study, flat-mount images of C57BL/6, C57BL/ScSnJ, and transgenic mice (CB57/10ScSnDmdmdx, B6Ros.Cg-Dmdmdx-4Cv/J, B6.Cg-Dmdmdx-3Cv/J, The Jackson Laboratory) subjected to the model of OIR were used. The OIR model was performed as previously described (4). In brief, pups (male and female) with their nursing mother were exposed to hyperoxia (75% oxygen) between P7 and P12 and then transferred to room air. Pups were weighed (6) and euthanized at OIR P17. Retinas were dissected, fixed in 4% paraformaldehyde on ice for 1 hour, stained with Isolectin B4 568 (I21412, Thermo Fisher Scientific), and flat-mounted. Flat-mount images were acquired with a confocal laser–scanning microscope (LSM710 Zeiss) using ×10 magnification and tile scanning (6 × 6 tiles) to capture whole flat-mount images. Manual quantification of the area of VO NV was performed according to an established protocol using Photoshop (Adobe) (5, 7).
The quantification of the percentage of the VO region and the percentage of the NV regions on the OIR images was broken down into 3 separate image analysis problems: the segmentation of the VO region, the segmentation of NV region, and identification of the total retinal area. We divided the images into 64%, 16%, and 20% for training, validation, and test sets, respectively.
In order to train the neural network within the confines of current GPU architectures, the original 3,000 × 3,000 images were downsampled to 256 × 256 for the training of the VO automated algorithm. The ground truth was created as a binary mask, with background set to false and the VO region set to true.
A modified version of the U-net architecture was utilized (Figure 2, top) (22, 23). The final output layer activation was set to a sigmoid function. Binary cross-entropy was used for the loss function during training and back-propagation. Batch normalization was applied after each convolutional layer (22). Adam, an adaptive learning optimizer, was set to an initial learning rate of 0.01 and was used for stochastic gradient descent (11).
To allow more generalizability of the trained model, online data augmentation was utilized during training by random rotation of 360 degrees and varying the contrast of the images by multiplying the images with a random value uniformly distributed between 0.7 and 1.3. Every 100 iterations, a random subset of the validation set was used to assess the model performance. At the end of training, the parameters of the model were frozen and the Dice coefficient was used to measure segmentation accuracy in the final held out test set.
Finer delineation was required for segmentation due to finer details found in neovascular complexes compared with VO regions; therefore the original 3,000 × 3,000 images were downsampled to 512 × 512. A modified version of the U-net architecture was utilized due to the different input size (Figure 2, bottom). All other hyperparameters were the same as the above described settings.
Segmentation of the whole retina was achieved as follows. Because the background brightness varies from image to image, there was no single threshold that could always identify the background from the retina region. Empirically, we found that pixels with intensity greater than 100 were always retina pixels. For the remaining pixels, we used k-means with k = 2 to cluster the pixels into background and retina regions based on log intensity alone.
Statistics.
In order to validate the trained models, a test set of 37 images were manually segmented prospectively by 4 human experts. Each grader was set to the ground truth, and the other 3 graders as well as the deep learning output were compared with the ground truth by Dice coefficients for both the VO and NV regions. For each segmentation result, the percentage of VO and NV regions were calculated and a linear correlation coefficient was calculated for each pairwise comparison. All training and validation of images were performed using Torch7 and trained on one computer containing two NVIDIA Titan X Pascal GPU cards.
Study approval.
C57BL/6 and transgenic mice used in these studies were treated in adherence with the National Institutes of Health Guide for the Care and Use of Laboratory Animals (National Academies Press, 2011). Animal studies were reviewed and approved by the Institutional Animal Care and Use Committee of The Scripps Research Institute.
Author contributions
SX and AYL designed the study. SX, YW, AR, and AYL created the deep learning model. FB, KVM, RF, SDA, and EA acquired the data. SX, YW, AR, CSL, MF, and AYL analyzed the data. SX, FB, CSL, and AYL wrote the manuscript. YW, AR, KM, RF, SDA, EA, and MF provided critical review and final approval of the manuscript.
Supplementary Material
Acknowledgments
We would like to acknowledge the NVIDIA Corporation for their generous donation of graphics cards for the development of artificial intelligence algorithms. This work was supported by grants from the National Eye Institute (K23EY024921 to CSL and R01 EY11254 to MF), the Lowy Medical Research Institute (to MF), the Gordon & Betty Moore Foundation (to AR), the Alfred P. Sloan Foundation (to AR), and the German Research Foundation (Bu 3135/1-1 to FB) as well as an unrestricted research grant from Research to Prevent Blindness (to CSL, AYL, SX, and YW). The contents of this manuscript do not represent the views of the US Department of Veterans Affairs or the US government.
Version 1. 12/21/2017
Electronic publication
Funding Statement
AYL, CSL, SX, YW
CSL
MF
MF
AR
AR
FB
AYL
Footnotes
Conflict of interest: A.Y. Lee received a hardware donation from NVIDIA Corporation.
Reference information: JCI Insight. 2017;2(24): e97585. https://doi.org/10.1172/jci.insight.97585.
Contributor Information
Sa Xiao, Email: saxiao@uw.edu.
Felicitas Bucher, Email: bucherf@scripps.edu.
Yue Wu, Email: yueswu@uw.edu.
Ariel Rokem, Email: arokem@uw.edu.
Regis Fallon, Email: rfallon@ucla.edu.
Sophia Diaz-Aguilar, Email: d.a.sophia1@gmail.com.
Edith Aguilar, Email: edith@scripps.edu.
Martin Friedlander, Email: friedlan@scripps.edu.
References
- 1.Jayson GC, Kerbel R, Ellis LM, Harris AL. Antiangiogenic therapy in oncology: current status and future directions. Lancet. 2016;388(10043):518–529. doi: 10.1016/S0140-6736(15)01088-0. [DOI] [PubMed] [Google Scholar]
- 2. Stahl A. Anti-Angiogenic Therapy in Ophthalmology. Cham, Switzerland: Springer International Publishing; 2016. [Google Scholar]
- 3.Stahl A, et al. The mouse retina as an angiogenesis model. Invest Ophthalmol Vis Sci. 2010;51(6):2813–2826. doi: 10.1167/iovs.10-5176. [DOI] [PMC free article] [PubMed] [Google Scholar]
- 4.Smith LE, et al. Oxygen-induced retinopathy in the mouse. Invest Ophthalmol Vis Sci. 1994;35(1):101–111. [PubMed] [Google Scholar]
- 5.Connor KM, et al. Quantification of oxygen-induced retinopathy in the mouse: a model of vessel loss, vessel regrowth and pathological angiogenesis. Nat Protoc. 2009;4(11):1565–1573. doi: 10.1038/nprot.2009.187. [DOI] [PMC free article] [PubMed] [Google Scholar]
- 6.Stahl A, et al. Postnatal weight gain modifies severity and functional outcome of oxygen-induced proliferative retinopathy. Am J Pathol. 2010;177(6):2715–2723. doi: 10.2353/ajpath.2010.100526. [DOI] [PMC free article] [PubMed] [Google Scholar]
- 7.Banin E, et al. T2-TrpRS inhibits preretinal neovascularization and enhances physiological vascular regrowth in OIR as assessed by a new method of quantification. Invest Ophthalmol Vis Sci. 2006;47(5):2125–2134. doi: 10.1167/iovs.05-1096. [DOI] [PubMed] [Google Scholar]
- 8.Stahl A, et al. Computer-aided quantification of retinal neovascularization. Angiogenesis. 2009;12(3):297–301. doi: 10.1007/s10456-009-9155-3. [DOI] [PMC free article] [PubMed] [Google Scholar]
- 9.Chatenay-Rivauday C, et al. Validation of a novel automated system for the quantification of capillary non-perfusion areas in the retina of rats with oxygen-induced retinopathy (OIR) Invest Ophthalmol Vis Sci. 2003;44(13):2907–2907. [Google Scholar]
- 10.Doelemeyer A, et al. Automated objective quantification of vascular morphology in rodent oxygen-induced retinopathy. Invest Ophthalmol Vis Sci. 2003;44(13):3618–3618. [Google Scholar]
- 11. Kingma DP, Ba J. Adam: A Method for Stochastic Optimization. Cornell University Library. http://arxiv.org/abs/1412.6980 Published December 22, 2014. Updated January 20, 2017. Accessed December 6, 2017.
- 12. He K, Zhang X, Ren S, Sun J. Deep Residual Learning for Image Recognition. Cornell University Library. http://arxiv.org/abs/1512.03385 Published December 10, 2015. Accessed December 6, 2017.
- 13.Badrinarayanan V, Kendall A, Cipolla R. SegNet: A deep convolutional encoder-decoder architecture for image segmentation. IEEE Trans Pattern Anal Mach Intell. 2017;39(12):2481–2495. doi: 10.1109/TPAMI.2016.2644615. [DOI] [PubMed] [Google Scholar]
- 14. Girshick R, Donahue J, Darrell T, Malik J. Rich Feature Hierarchies for Accurate Object Detection and Semantic Segmentation. Cornell University Library. https://arxiv.org/abs/1311.2524 Published November 11, 2013. Updated October 22, 2014. Accessed December 6, 2017.
- 15.Lee CS, Baughman DM, Lee AY. Deep learning is effective for classifying normal versus age-related macular degeneration OCT images. Ophthalmology Retina. 2017;1(4):322–327. doi: 10.1016/j.oret.2016.12.009. [DOI] [PMC free article] [PubMed] [Google Scholar]
- 16.Prentašic P, et al. Segmentation of the foveal microvasculature using deep learning networks. J Biomed Opt. 2016;21(7):75008. doi: 10.1117/1.JBO.21.7.075008. [DOI] [PubMed] [Google Scholar]
- 17.Abràmoff MD, et al. Improved automated detection of diabetic retinopathy on a publicly available dataset through integration of deep learning. Invest Ophthalmol Vis Sci. 2016;57(13):5200–5206. doi: 10.1167/iovs.16-19964. [DOI] [PubMed] [Google Scholar]
- 18.Lee CS, Tyring AJ, Deruyter NP, Wu Y, Rokem A, Lee AY. Deep-learning based, automated segmentation of macular edema in optical coherence tomography. Biomed Opt Express. 2017;8(7):3440–3448. doi: 10.1364/BOE.8.003440. [DOI] [PMC free article] [PubMed] [Google Scholar]
- 19. Hastie T, Tibshirani R, Friedman J. The Elements of Statistical Learning: Data Mining, Inference, and Prediction. New York, NY: Springer New York Inc; 2001. [Google Scholar]
- 20.Scott A, Powner MB, Fruttiger M. Quantification of vascular tortuosity as an early outcome measure in oxygen induced retinopathy (OIR) Exp Eye Res. 2014;120:55–60. doi: 10.1016/j.exer.2013.12.020. [DOI] [PubMed] [Google Scholar]
- 21.Nakamura S, Imai S, Ogishima H, Tsuruma K, Shimazawa M, Hara H. Morphological and functional changes in the retina after chronic oxygen-induced retinopathy. PLoS ONE. 2012;7(2):e32167. doi: 10.1371/journal.pone.0032167. [DOI] [PMC free article] [PubMed] [Google Scholar]
- 22. Ioffe S, Szegedy C. Batch Normalization: Accelerating Deep Network Training by Reducing Internal Covariate Shift. Cornell University Library. https://arxiv.org/abs/1502.03167 Published February 11, 2015. Updated March 2, 2015. Accessed December 6, 2017.
- 23. Ronneberger O, Fischer P, Brox T. U-Net: Convolutional Networks for Biomedical Image Segmentation. In: Navab N, Hornegger J, Wells W, Frangi A, eds. Medical Image Computing and Computer-Assisted Intervention – MICCAI 2015. Cham, Switzerland:Springer, Cham; 2015:234–241. [Google Scholar]
Associated Data
This section collects any data citations, data availability statements, or supplementary materials included in this article.


