

Abstract
Accurate HIV-1 incidence estimation is critical to the success of HIV-1 prevention strategies. Current assays are limited by high false recent rates (FRRs) in certain populations and a short mean duration of recent infection (MDRI). Dynamic early HIV-1 antibody response kinetics were harnessed to identify biomarkers for improved incidence assays. We conducted retrospective analyses on circulating antibodies from known recent and longstanding infections and evaluated binding and avidity measurements of Env and non-Env antigens and multiple antibody forms (i.e., IgG, IgA, IgG3, IgG4, dIgA, and IgM) in a diverse panel of 164 HIV-1–infected participants (clades A, B, C). Discriminant function analysis identified an optimal set of measurements that were subsequently evaluated in a 324-specimen blinded biomarker validation panel. These biomarkers included clade C gp140 IgG3, transmitted/founder clade C gp140 IgG4 avidity, clade B gp140 IgG4 avidity, and gp41 immunodominant region IgG avidity. MDRI was estimated at 215 day or alternatively, 267 days. FRRs in untreated and treated subjects were 5.0% and 3.6%, respectively. Thus, computational analysis of dynamic HIV-1 antibody isotype and antigen interactions during infection enabled design of a promising HIV-1 recency assay for improved cross-sectional incidence estimation.
Keywords: AIDS/HIV, Immunology
Keywords: Antigen, Immunoglobulins
Design of a novel HIV-1 incidence algorithm for distinguishing recent (<9 months) versus longstanding infection.
Introduction
Accurate estimates of HIV-1 incidence (i.e., the number of new HIV infections in a population in a defined period of time) are critical for planning and evaluating the success of HIV-1 prevention strategies (1, 2). Recent advances in novel preventative measures, including vaccines (3), treatment as prevention (4), and preexposure prophylaxis (5), have changed the landscape of HIV-1 prevention. However, currently available cross-sectional HIV-1 incidence assays have limited utility in difficult to classify populations (antiretroviral therapy–treated [ART-treated] subjects, elite controllers, and subtype D infection; refs. 6–10). This is often due to a high false recent rate (FRR) (i.e., specimens infected for more than a recency time cutoff time “T,” often chosen to be 2 years, that are classified as recently infected) (6) and a mean duration of recent infection (MDRI) of approximately 4–5 months (6, 11). Thus, the number of persons that must be surveyed in order to generate incidence estimates with a useful level of precision is unmanageably large in all but a small number of high incidence countries (12, 13). Development of HIV-1 incidence assays using novel biomarkers must meet several key criteria for assay performance, including a longer MDRI and decreased FRR. The WHO/UNAIDS Incidence Assay Critical Path Working Group (2, 14) recommends an ideal MDRI of between 6 and 12 months after infection with a FRR < 2%. Achievement of these goals is critical to the accurate assessment of HIV-1 treatment and prevention efforts, the design of HIV-1 vaccine trials, and monitoring the epidemic in pursuit of an AIDS-free generation.
We, and others, have previously characterized the sequential progression of HIV-1 antibody responses in acute through chronic infection and found that HIV-1–specific antibody isotypes and subclasses are extraordinarily dynamic during the early phase after acquisition and thus may be suitable for discriminating recent from longstanding infection (15–19). These include early markers of HIV infection, such as IgM, IgG, and IgA antibodies to gp41 and Gag, which are among the earliest antibody specificities to arise after infection (15, 16). IgG antibodies to additional specificities within the HIV envelope are elicited sequentially, with a delay in anti-gp120 antibodies (16). The earliest epitope-specific responses appear first to the immunodominant region (ID) of gp41 and in the variable loop 3 (V3) region for gp120 and then later in infection to the CD4-binding site and the membrane proximal external region (15, 16). Maturation of antibody responses includes an increase in antibody avidity for specific HIV-1 antigens and elevation of IgG4 responses and may also include an increase in breadth of recognition of multiple HIV-1 subtypes during the transition from recent to longstanding infection (16, 20). Notably, in the early phase of infection, some antibody responses exhibit a rapid increase in titer followed by declining kinetics. In particular, IgG3 antibody responses to p55 Gag, gp41 Env, and p66 RT decline in acute infection, in contrast to the same antigen-specific IgG1 responses (17, 18). Env IgA also demonstrates a marked decline both systemically and in the mucosa during recent infection (15). Thus, we hypothesized that a multiparameter approach that includes antibody isotypes and subclasses, presence or absence of certain epitope specificities, antibody avidity, and recognition of unique HIV-1 envelope antigens would more accurately distinguish recent from longstanding infection.
Our approach builds upon this previous work profiling antibody kinetics from acute to chronic infection using multiplex-binding measurements (15–17, 19, 21). Here, we determined epitope specificities and antibody isotypes and subclasses, displaying distinct kinetic profiles through the course of HIV-1 infection for multiple HIV-1 subtypes. Multiparameter measurements were evaluated by machine learning with discriminant function analysis (DFA) to identify combinations of naturally occurring antibody biomarkers for cross-sectional HIV-1 incidence testing, resulting in a promising set of 4 biomarkers for advancement toward an improved HIV-1 incidence test.
Results
Multiplex incidence assay strategy.
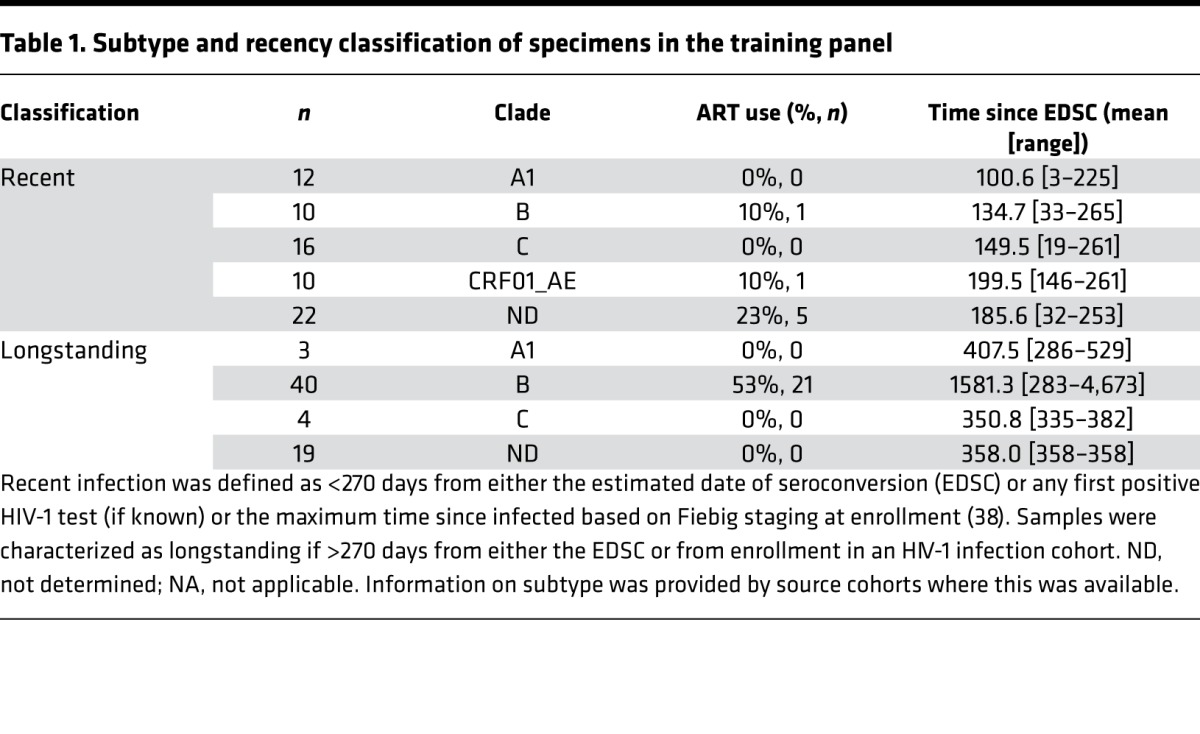
The humoral response to HIV-1 infection is marked by the dynamic appearance and disappearance of certain antibody isotypes and subclasses to different viral antigens from acute to longstanding infection. To harness this information for an HIV-1 incidence assay, we tested different antibody forms (i.e., IgM, IgG, IgG3, IgG4, IgA) in concert with a wide variety of HIV-1 antigens (i.e., peptides and proteins derived from env, gag, pol genes) to comprehensively cover the epitopes and antigen structures most likely to be reactive with immune sera from recent to chronic infection, including transmitted/founder envelope (T/F) proteins (22–26). The analysis includes the presence or absence of the response along with the magnitude and avidity of the antibody response when present. We evaluated plasma from 70 recent and 66 longstanding HIV-1 infections (“training panel”) of multiple subtypes (A, AE, B, C) from the Center for HIV/AIDS Vaccine Immunology (CHAVI) 001 cohort (27), the US Military HIV Research Program (USMHRP) RV217 cohort (28), and the Consortium for the Development and Performance of HIV Incidence Assays (CEPHIA) repository (29), including specimens from 39 patients on antiretroviral therapy (Table 1). A recency cutoff of 9 months (270 days) was used to train the model for this analysis based upon initial characterization of candidate biomarkers using samples from the CEPHIA repository and CHAVI 001 acute infection cohorts (data not shown). Estimated date of seroconversion (EDSC) was not known for all participants with longstanding infection; however, time since sample collection was ≥270 days since infection based on other parameters as described above.
Table 1. Subtype and recency classification of specimens in the training panel.
To determine the antibody measurements that most accurately categorize patient samples as recent or longstanding HIV infection, we performed DFA of all possible combinations of 3–6 biomarkers (Ab/Ag combinations) from 505 possible measurements, including different antibody types and envelope and nonenvelope sequences (Supplemental Tables 1–3; supplemental material available online with this article; https://doi.org/10.1172/jci.insight.94355DS1). DFA identified a set of 4 antibody biomarkers that classified recent versus longstanding infection with a 0% FRR (T = 2 years) and a 4.4% overall misclassification rate, including samples on ART (Table 2). As supported by previous observations (16), Env binding to IgG3 was more strongly associated with recent than longstanding infection (Figure 1A). Consistent with a delayed elevation of IgG4 and antibody avidity in HIV-1 infection, Env IgG and IgG4 Env binding avidity were associated with longstanding infection (Figure 1A). We found that specific antigens were most sensitive for discriminating these responses (i.e., subtype B SC42261 and subtype C CH505 T/F gp140 for IgG4 avidity and gp41 immunodominant epitope for IgG).
Table 2. Classification of samples from cohorts containing clade A, AE, B, and C infection yields a false recent rate of 0%.
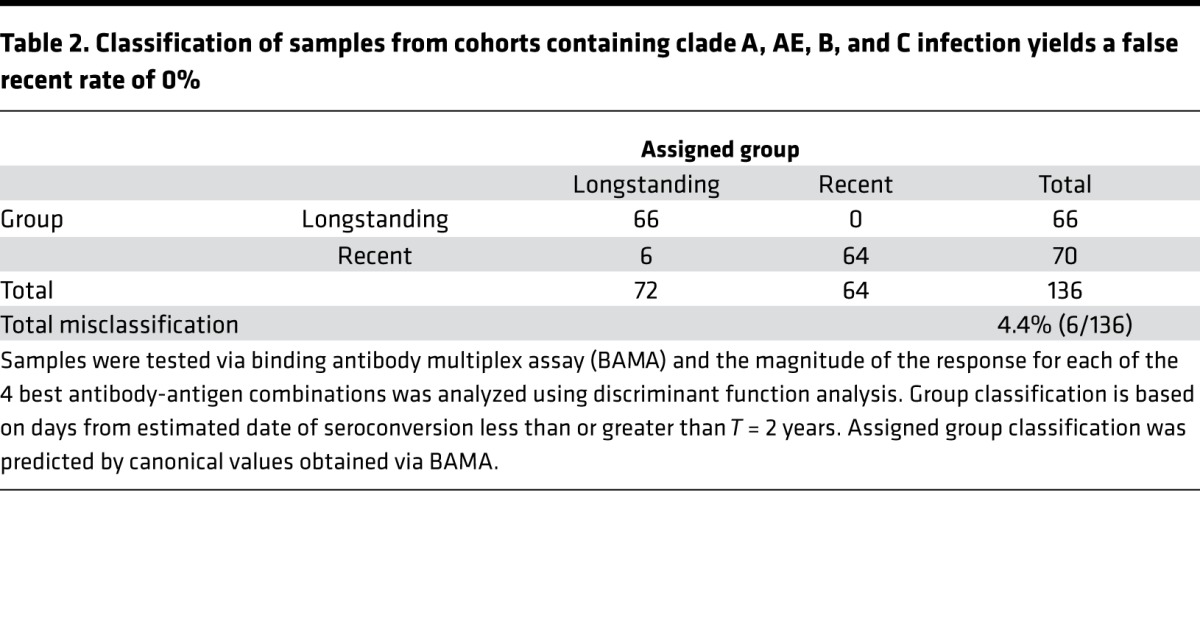
Figure 1. Envelope binding and avidity to multiple IgG subclasses accurately classifies recent versus longstanding infection.

A panel of 505 antigen-antibody combinations was analyzed using discriminant function analysis, as described in the Methods. (A) The top 4 antibody-antigen (Ab-Ag) combinations are presented (from top left to right: subtype C T/F BF1266 gp140 IgG3, subtype C CH505 T/F IgG4 avidity, subtype B SC42261 gp140 IgG4 avidity, and gp41 ID IgG avidity). Y-axis values for the gp41 ID epitope avidity score represent the net difference of MFI (CIT) – MFI (PBS). (B) The canonical score (i.e., latent variable representing the combination of measurements in A) for the solution with the top 4 Ab-Ag combinations. CIT, Na-citrate, pH 4.0.
Responses to the 4 individual biomarkers exhibited overlap between recent and longstanding specimens; therefore, DFA was used to generate a canonical score based on all 4 measurements for each specimen (Figure 1B). This set of 4 biomarkers achieved low overall misclassification rates as follows: 3 of 69 (4.5%) longstanding specimens were misclassified as recent and 6 of 70 (8.6%) recent specimens were misclassified as longstanding using a cutoff of 270 days. Total misclassification rate, including specimens from 39 patients on ART, was 9 of 136 (6.6%) (data not shown). A FRR of 0% was achieved using a cutoff of T = 2 years, with a total misclassification rate of 4.4% (Table 2). These 4 measurements were similar in type and epitope specificity to candidate biomarkers identified during the development phase, with the exception of including markers that are higher during recent infection (i.e., IgM) (Supplemental Figure 1, A–C). This, taken together with the low misclassification rate, provided strong rationale for further biomarker validation in a prospective, blinded validation panel.
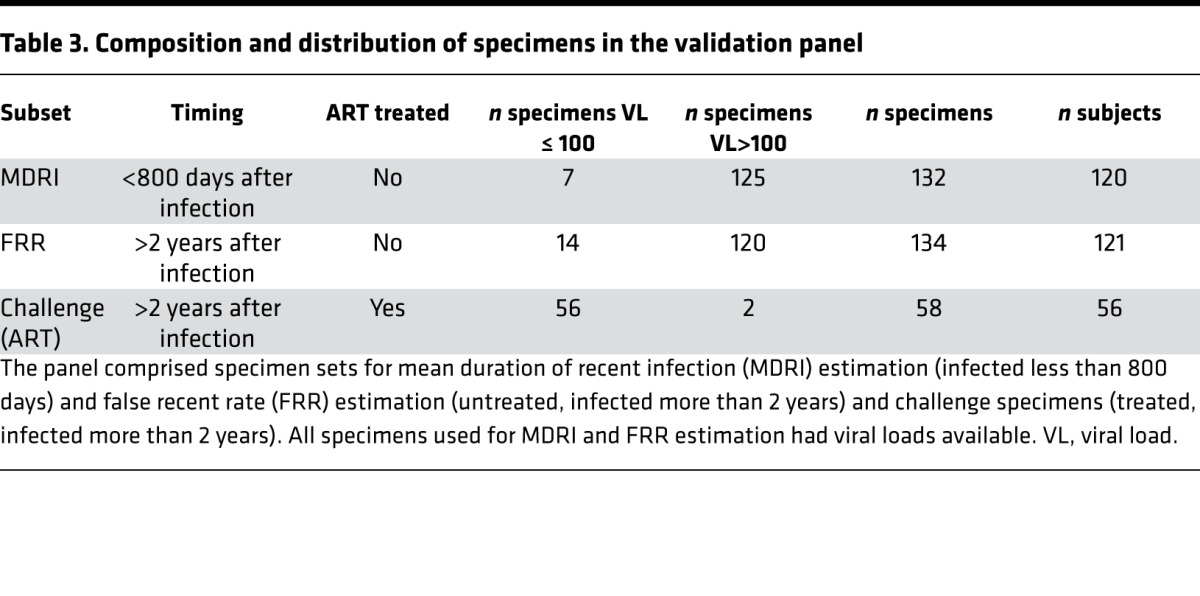
We next tested the 4 candidate biomarkers in a blinded validation panel. The panel comprised specimen sets for MDRI estimation (infected less than 800 days) and FRR estimation (untreated, infected more than 2 years) and challenge specimens (treated, infected more than 2 years). All specimens used for MDRI and FRR estimation had viral loads available (Table 3).
Table 3. Composition and distribution of specimens in the validation panel.
Resulting MDRIs and FRRs were estimated for a range of binding antibody multiplex assay (BAMA) classifications (at varying posterior probability [PP] thresholds) and compared with the performance of a commercially available incidence assay, the Sedia HIV-1 Limiting Antigen–Avidity (LAg-Avidity) enzyme immunoassay, which was applied to the same panel at the Blood Systems Research Institute (San Francisco, California, USA). Both sets of results were additionally combined with a supplementary viral load threshold (11, 30) (i.e., specimens classified as recent by the assay but with viral loads below 100 copies/ml reclassified as longstanding). Results are summarized in Table 4.
Table 4. Mean duration of recent infection and false recent rate from blinded validation panel.
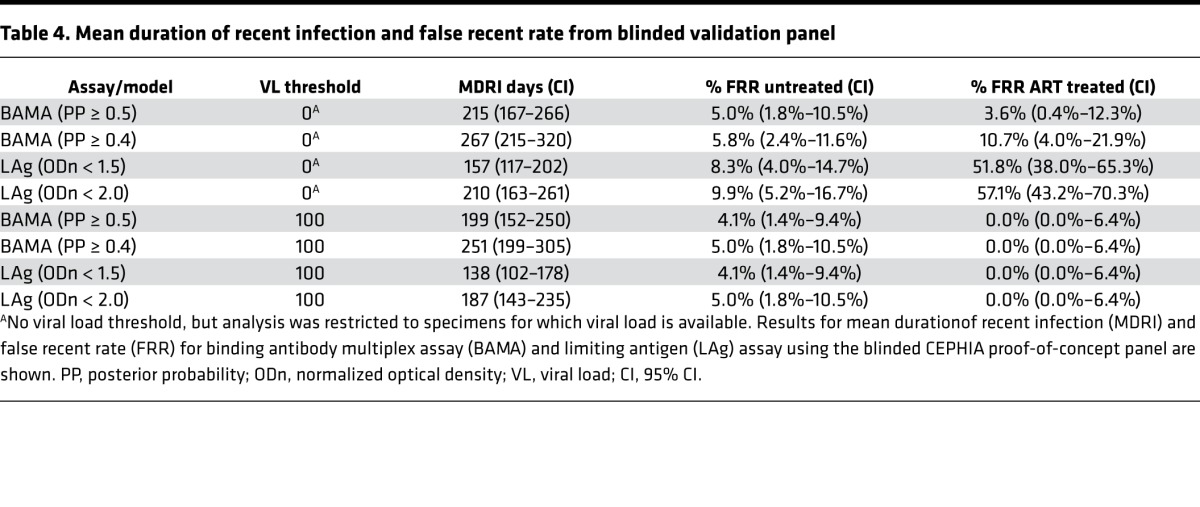
The BAMA assay had an MDRI of 215 days (95% CI: 167–266) at the standard PP threshold compared with 157 days (95% CI: 117–202) for LAg (at the standard normalized optical density [ODn] threshold of 1.5) on the same specimen set. The FRR in untreated specimens was 5.0% (1.8%–10.5%) and 3.6% (0.4%–12.3%) in the ART-treated (challenge) subset as compared with 8.3% (4.0%–14.7%) and 51.8% (38.0%–65.3%), respectively, for LAg. When combined with a viral load threshold, MDRI was reduced to 199 days (95% CI: 152–250), but the FRR was reduced to 4.1% (1.4%–9.4%) in untreated specimens and to 0.0% (0.0%–6.4%) in treated specimens. LAg (ODn < 1.5) in combination with viral load produced an MDRI of 138 days (95% CI: 102–178) and FRRs identical to BAMA. At the alternative PP cutoff of 0.40, the MDRI without viral load was 267 days (95% CI: 215–320); when combined with viral load, the MDRI was 251 days (95% CI: 199–305).
The MDRI for the BAMA assay (at standard PP cutoff) was significantly longer than that of LAg assay (at standard ODn threshold), both without and with the use of viral load (59 days, P = 0.060 and 61 days, P = 0.040, respectively), with very similar FRRs in untreated specimens. Without the use of supplemental viral load, the FRRs in treated subjects were substantially lower than the FRRs obtained using the LAg assay. Using the alternative PP cutoff of 0.40, the MDRI for the BAMA assay was substantially and significantly longer than that of the LAg assay at the standard ODn threshold (110 days, P < 0.001). This demonstrates potential for the combination of binding and avidity measurements of gp41 ID IgG, Env IgG3, and Env IgG4 to improve cross-sectional incidence estimation.
Discussion
Designing, testing, implementing, and evaluating large-scale investments in HIV prevention and treatment efforts requires robust population-level incidence estimation approaches. In this study, we evaluated a diverse set of antibody-antigen combinations to develop a combination of biomarkers for improved HIV-1 incidence estimation.
The complexity of early pathogenesis, including diversity in antibody responses among individuals and HIV subtypes, regional viral genetic diversity, HIV disease state, and ART, use has limited progress in novel assay development for incidence estimation (12, 14). In particular, leading candidate assays all appear to require explicit viral load testing to reduce otherwise unacceptably high FRRs among treated individuals and elite controllers, both of which are enriched in populations with mature epidemics.
Improvements in HIV-1 incidence estimation can be achieved through combining multiple tests into a multiassay algorithm, including antibody measurements, p24 antigen, viral diversity, and/or viral load determination (12). Recent infection testing algorithms, including serologic testing algorithm for recent HIV seroconversion (31–34), have also been used in combination to refine estimates of incidence, with varying degrees of success (6, 31). However, utility of these assays may be limited due to increased costs per sample, sample volume required, and complexity of the assay. To make usefully precise incidence estimates available from feasible sample sizes, recent infection tests require a delicate balance between sufficiently long MDRI and sufficiently low FRR (6). A recent advance in ELISA-based assays is the LAg-avidity assay (35), which utilizes avidity to a multiclade recombinant gp41 ID epitope and achieves a low FRR of 1.3% when elite controllers and patients on ART treatment are excluded (6). Results of an independent analysis of 5 standard incidence assays (Bio-Rad avidity [Bio-Rad GS HIV-1/HIV-2 PLUS O EIA], Vitros [Ortho Clinical Diagnostics], LS-Vitros [Less-Sensitive Vitros], LAg, and BED [SEDIA BED HIV-1 Incidence EIA, Sedia Biosciences]) indicated a high FRR of 12.9%–48.4% in elite controllers and 50.0%–76.1% in ART-treated individuals, indicating the need for novel biomarkers of HIV-1 incidence (6).
Considerations for novel development of HIV-1 incidence biomarkers must include expansion of the range of biomarkers to achieve greater separation between recent and longstanding specimens. Current assays are limited in Env sequence, clade diversity, and antibody isotypes and rely on nonnative protein sequences for assessment of binding antibody responses. A majority of currently available incidence assays measure avidity to a limited number of sequences, including varying recombinant forms of gp41 IgG (i.e., LAg and BED); multiple fusion proteins comprising varying combinations of gp120/gp41, p24, and p36 (i.e., Vitros and LS-Vitros); and gp160 and p24 recombinant proteins derived from HIV-1, gp36 from HIV-2, and a synthetic polypeptide mimicking an artificial HIV-1 group O–specific epitope (i.e., Bio-Rad avidity). Some assays have begun to include binding and avidity to other Env and non-Env sequences, such as p66 and gp120 (36), which display a range of maturation kinetics from recent to longstanding infection. However, addition of novel biomarkers, such as clade diversity and maturation kinetics of antibody isotypes and subclasses (e.g., increasing antibody avidity from recent to chronic infection), are likely to provide the greatest increase in MDRI and greatest reductions in FRR. This included binding and avidity to a range of linear epitopes, diverse Env and non-Env proteins (native and consensus sequences), and Ig isotypes and subclasses.
The present work expanded the set of biomarkers by building upon previous observations that IgG subclasses and Env specificities display differential kinetics during the course of recent infection (16, 17). The panel of measurements was built to balance potential antibody biomarkers of recency (gp41 epitopes, dIgA, IgG3, IgM) with markers of longstanding infection (gp120 epitopes, IgG4, avidity to gp41). We included a diverse set of linear and conformational epitopes as well as native and conserved sequences. The antigen panel was diversified through addition of globally relevant, circulating strains (clades A and C; CD4-binding site epitopes; and linear epitopes from clades A, B, C, and D and group M consensus, and T/F Env proteins. Although the vast majority of the antigens tested were derived from Env, we also tested nonenvelope proteins, including p24 Gag, p66 reverse transcriptase, and p31 integrase. Some of the non-Env sequences did score highly in the algorithm, including p66 in the development panel (Supplemental Figure 1). However, none were part of the final top solution with lowest FRR. This may be due to the limited number of sequences of nonenvelope proteins tested here that could be further explored in subsequent studies.
The resulting antigen panel confirmed the use of traditional incidence biomarkers such as gp41 avidity index to discriminate recent versus longstanding infection, while bypassing the limitations of current assays through the use of additional recency (IgG3) and longstanding (avidity to IgG4) biomarkers. Additionally, the top solution included markers of subtype and sequence diversity (T/F envelope, subtypes B and C gp140 proteins). While the gp41 ID region is a key HIV-1 recency marker and may be responsible for some of the activity to the gp140 proteins, the relative contribution of the gp41 ID epitope to the gp140 proteins is unknown and likely only one of the drivers of this activity. Other regions in gp140 (i.e., V2 and V3 antigens) also scored highly in the development phase, though they were not part of the final “best” antigen set. Those that did not score well in this analysis include proteins designed to expose the conformational CD4-binding site region. It is likely that the gp140 reactivity is driven by the unique antigenicity of each protein for exposure to multiple epitope specificities, including gp41 ID, V3, CD4BS, and other conformational epitopes.
Length of time on ART is an important consideration for antibody-based biomarker testing. Our specimen panels were limited in that the majority of the subtype C samples in the CEPHIA panels and in the CHAVI 001 cohort were collected prior to the widespread use and availability of ART treatment in subtype C endemic areas. Additionally, the subtype B and C specimens were collected prior to the recommendation for initiating ART treatment at the time of diagnosis. Thus, most, if not all of the participants in these cohorts were treated late in infection, allowing for maturation of the antibody response. The 6 samples misclassified in Table 2 were from participants infected for <270 days (recent) that were classified in this algorithm as longstanding. This result is not unexpected, given the inherent variability surrounding EDSC and biologic variability in the kinetics of the antibody response after infection. Only 1 of 6 misclassified samples was from a participant on ART at the time of sample collection.
Short of constructing detailed hypothetical surveillance scenarios, criteria for significant improvements in incidence testing include a significantly longer MDRI or significantly lower FRR (or both) when compared with currently available assays. By this assessment, our reported BAMA platform produced at least one model of recent infection that was statistically superior to the Sedia LAg assay, which was constructed on a well-characterized unblinded “training panel” (clades B and C infection) using a time-based definition of recent infection as a gold standard. In particular, an advantage of the newly developed biomarker algorithm is the strongly improved FRR achieved on specimens from participants on ART, without the need for a supplemental viral load analysis. Data generated in the optimization, training, and model development phases are also well suited for additional in silico optimization to further improve MDRI and FRR as required for product development. While 2 gp140 envelope proteins derived from early acute infection or a T/F virus (i.e., subtype B SC42261 gp140 and subtype C BF1266) scored in the “best” set of 4 antigens in this panel, related envelope sequences scored highly in early training panels. Thus, future development of this assay may explore additional gp140 antigens to provide the broadest cross-clade coverage. These improvements may include alternate epitope specificities that consistently scored highly in the optimization phase (i.e., linear V3 epitopes, alternate gp140 sequences) but were not part of the “best 4” antigen panel. Additionally, these data will provide key insight for future development of the assay to include testing samples from subtype D infection and samples from participants treated early with ART.
Use of HIV-1 incidence tests with an MDRI between 240 and 280 days will enable applications, such as national surveillance, determination of intervention effectiveness, and estimation of incidence in key populations, that are currently not feasible due to large sample size requirements. Use of improved assays with longer MDRI are estimated to result in a cost savings of between $5 and $23 million USD per year due to the reduction in sample size (13). Thus, the biomarkers of HIV-1 recency reported here are excellent candidates to advance further development of a novel HIV-1 incidence algorithm.
Methods
Optimization of incidence assay performance is defined by a trade-off between MDRI and FRR to minimize the variance in incidence estimates. In order to access robust learning algorithms, models for recent-infection case definitions were built by minimizing classification error of a recency status assignment in a “training panel” of specimens, with recent infection defined as less than 9 months after EDSC. Resulting classification models, or threshold-based modifications, were then validated by estimating MDRI and FRR from blinded testing of a nonoverlapping “biomarker validation panel.” Laboratory processes and training analyses were completely blinded to the clinical background data on validation panel specimens.
Specimen panels
The training specimen panel comprised plasma or serum from 66 recent (9 months or less from EDSC to specimen collection) and 70 longstanding (more than 9 months since EDSC) HIV-1 infections of multiple subtypes (A, AE, B, C) (Table 1). Sources included HIV-1 acute and chronic cohorts from CHAVI (CHAVI 001, CHAVI 008) (27, 37), the US Military HIV Research Program (RV217) (28), and from the specimen repository created and maintained by CEPHIA, which has been previously described (6, 12). EDSC was determined as described previously (6). In some cases where an EDSC could not be calculated, a duration of infection was estimated based upon the Fiebig stage documented at cohort enrollment, using the maximum cumulative duration of infection as described by Cohen et al. (38).
Biomarker validation was performed by testing and classifying 324 specimens from the CEPHIA proof-of-concept biomarker validation panel and estimating MDRI and FRR.
A total of 365 samples were received for testing, and the final data set for analysis (n = 324) excluded 41 tested specimens that were either reproducibility controls (i.e., 15 total: 5 each of 3 specimens) or were ART-positive samples (i.e., 26 specimens) excluded from the MDRI estimation panel. The composition of the final panel is summarized in Table 3 and includes 132 well-characterized untreated specimens drawn within 800 days of EDSC (120 unique subjects) for MDRI estimation and 134 specimens (121 subjects) from untreated and 58 specimens (56 subjects) from treated longstanding infection for FRR estimation. Specimens were largely from subjects infected with subtypes B (56%) and C (43%).
BAMA
We profiled HIV-1–specific binding antibody responses in participant serum or plasma as described previously (15–17). We evaluated antibody binding to a unique and broad set of HIV-1 antigens that included gp120, gp140, and V1-V2 antigens of multiple subtypes (i.e., A, CRF01-AE, B, C, CRF07-BC) from both sexes. Envelope sequences represent infections from multiple transmission routes (i.e., heterosexual transmission, homosexual transmission, breastfeeding, and i.v. drug use), multiple regions (China, India, Kenya, Malawi, Russian Federation, South Africa, Thailand, Trinidad and Tobago, Uganda, US, and Zambia) and Fiebig stage of infection (i.e., I, I/II, II, III, IV, V, and VI) (39). Additional antigens included multiple clade-specific and consensus linear peptides for the gp41 ID; V1, V2, V3, C1, and C5 epitopes; gp41 (ImmunoDx); p31 integrase (Jena Bioscience); p66 RT (Protein Sciences); and p24 Gag (BD Biosciences). Serum and plasma were diluted in BAMA assay diluent (1% milk-blotto, 5% normal goat serum, 0.05% Tween-20) and incubated with antigen-coupled microspheres. Samples were incubated with either anti-human IgG-PE (Southern Biotech, catalog 9040-09, reactive with all IgG subclasses) or anti-human IgA (Jackson Immunoresearch, catalog 109-065-011), anti-human IgG3 (Calbiochem, catalog 411483), anti-human IgG4 (BD Pharmingen, catalog 555879 ), or anti-human IgM (Southern Biotech, 2020-08) followed by Streptavidin-PE (BD Biosciences) and detection on either a Bioplex 200 (Bio-Rad) or Luminex FM3D machine (Luminex Corp.). All samples were depleted of IgG using a MultiTrap system (GE Biosciences) per manufacturer’s instruction, prior to assessment of IgA- or IgM-specific antibodies. Dimeric IgA was detected using a recombinant polymeric-Ig receptor (pIgR, ref. 40) (provided by D. Anderson and N. Barnes, Burnet Institute). Samples were incubated with pIgR overnight in assay diluent (1% BSA, 0.05% Tween-20), followed by incubation with microsphere beads covalently coupled to the antigen of interest. pIgR was detected using anti-human pIgR (secretory component [SC]) detection (41) (provided by HXL and BFH) followed by anti-mouse IgG-PE (Southern Biotech, catalog 1030-09). Controls for IgG assays included titrated HIVIG (NIH AIDS Reagent Program), 7B2 IgG (42), CH58 IgG (43), and CH22 IgG mAb (44). IgA-specific controls included titrated 7B2 monomeric IgA (provided by BFH). Controls for the pIgR assay included 7B2 monomeric IgA, 7B2 SIgA, 7B2 dIgA (41), and purified SC-coupled beads. Controls for IgM assays included titrated 2F5 (45) and CLL246 (gp41 specific) IgM (46) (provided by Kwan Ki-Hwang, Duke Human Vaccine Institute). Controls for IgG3 and IgG4 assays included a titrated purified human IgG3 or IgG4 standard curve and purified IgG3 or IgG4 coupled beads. Negative controls in each assay included normal human serum (Sigma-Aldrich) and blank beads. Each experiment was performed using good clinical laboratory practice–compliant conditions, including tracking of positive controls by Levey-Jennings charts.
Antibody avidity.
Assessment of antibody avidity was determined by BAMA with the following modifications: After formation of antigen/antibody immune complexes, a 15-minute dissociation step (Na-Citrate, pH 3.0, Teknova) (35) at room temperature (20°C–23°C) was included prior to addition of secondary detection antibody. Retained binding magnitude (mean fluorescence intensity [MFI]) in the presence of dissociation buffer was used as a measurement of antibody avidity in the statistical models.
Statistics
DFA.
Six ranking criteria were used to downselect from the 505 antigen/antibody measurements: (a) rank ordered by Wald χ2 values for the coefficients of each measurement (loge MFI as a continuous predictor) in a logistic regression model with HIV status (recent vs. longstanding) as the dependent variable; (b) rank ordered by Wald χ2 values for the coefficients of each measurement using MFI as a categorical variable (100 MFI or above was scored as 1 [positive], below 100 MFI was scored as 0 [negative]) in a logistic regression model with HIV status (recent vs. longstanding) as the dependent variable; (c) rank ordered by absolute values of Pearson correlation coefficients for each measurement with time since EDSC; (d) rank ordered by the mean difference between HIV status groups for each measurement; (e) rank ordered by the difference in the positive response rate (100 MFI or above was scored as 1 [positive], below 100 MFI was scored as 0 [negative]) for each measurement between HIV status (recent vs. longstanding); and (f) rank ordered by Wald χ2 values for the coefficients of each measurement (continuous predictor based on the pairwise difference between all pairs of measures for each patient) in a logistic regression model with HIV status (recent vs. longstanding) as the dependent variable. The top 20 measurements for each of the 6 criterion were then selected. Twenty was the number selected to make the final sample space manageable while minimizing the risk of excluding a measurement with good discriminatory power. Among the 120 candidate measurements collected from the 6 ranking criterion, 12 were represented more than once, leaving 108 unique measurements.
To determine a set of measurements that had the optimum predictive power, we applied a DFA model (47) to all possible combinations of 3, 4, 5, and 6 measurements from the 108 measurement downselected list. We recorded the misclassification error rate (recent patients categorized as longstanding and longstanding patients categorized as recent) for each possible unique combination. With sets of 4 measurements, a total error rate of 6.6% was reached that was not further reduced by including additional measurements.
Using DFA, classification coefficients for each measure can be extracted and new measures are fed through the classification equation (E). For a 4-measurement (X) set the equation is as follows:
Ej = E0j + Ej1X1 + Ej2X2 + Ej3X3 + Ej4X4
where there is an intercept and a coefficient for each measurement for each group j, here recent and longstanding. If Erecent > Elongstanding, then the new subject was classified as recent, and if Erecent < Elongstanding, then the new subject was classified as longstanding. Additionally, the PP criteria used for assigning group membership can improve the accuracy of the classification in use cases where the desired definition of recent is >9 months. While usually a value of PP(recent) ≥ 0.5 is used as the criterion for assigning a categorization of recent to an observed case, other thresholds can be entertained, yielding variations on the model that offer different trade-offs between MDRI and FRR — previously noted to be the ultimate determinants of test performance.
Estimation of MDRI and FRR.
MDRI was estimated by binomial regression of probability of obtaining an assay-recent result as a function of time since seroconversion and integrating this probability from seroconversion to the recency cut-off time T, using approaches described previously (6), which have been implemented in the R package inctools (48, 49). The model for PR(t) was fit using all specimens drawn ≤ 800 days after EDSC, but to obtain MDRI, the integral is only evaluated from 0 to T. MDRI = ∫0TPR(t), T = 2 years. The model is available from https://cran.r-project.org/web/packages/inctools/ (inctools: Incidence Estimation Tools for estimating incidence from biomarker data in cross-sectional surveys and for calibrating tests for recent infection). CIs were obtained by resampling subjects in 10,000 bootstrap iterations.
To evaluate MDRI differences between recency tests, the variances of difference estimates were approximated using 10,000 subject-level bootstrapping iterations. P values for differences were obtained from a 2-tailed Z test, with values less than 0.05 considered significant.
The FRR estimates were obtained by simply estimating the binomial proportion of patients testing recent at times more than T after seroconversion.
Study approvals
Samples from participants in all research cohorts were collected following informed consent. Retrospective analysis was performed with approval from the Duke Medicine Institutional Review Board for Clinical Investigations (protocol Pro00039677).
Author contributions
KES, AWD, DAA, XS, NLY, and GDT designed research studies; NAV, WR, JB, EG, and AW designed statistical models and analyses; KES, AWD, SK, and DH conducted experiments; KES, AWD, DH, SK, SF, and KM acquired data; KES, NAV, AWD, WR, JB, SS, EG, XS, NLY, AW, and GDT analyzed data; DAA, TND, HXL, BFH, MLR, BRS, NG, MAP, DN, ACD, the CEPHIA group, SF, KM, CDP, and MSC provided reagents or specimens, NP provided program management and scientific insight; KES, NAV, WR, JB, EG, NP, AW, and GDT wrote the manuscript.
Supplementary Material
Acknowledgments
We are indebted to the participants in the CHAVI cohorts (CHAVI 001, CHAVI 008), the RV217 cohort, and the CEPHIA repository as well as to the staff of cohorts. We thank Christine Rousseau (Bill & Melinda Gates Foundation) and Jennifer Osborn (Foundation for Innovative New Diagnostics) for expert project management, Mario Roederer and Diane Bolton for helpful discussions, Bharat Parekh for advice on antibody avidity assays, Marcella Sarzotti-Kelsoe for quality assurance oversight, and Tess Orvis, Jessica Peel, Judith Lucas, R. Glenn Overman, David Beaumont, Jack Heptinstall, Michelle Key and Sara Brown for expert technical assistance in sample processing and binding antibody assays. The authors acknowledge the contributions of the CHAVI Clinical Core Team for recruiting study participants and carrying out all aspects of the CHAVI 001 and CHAVI 008 protocols. Additionally, we thank the CHAVI-ID program management team for sample management. See Supplemental Acknowledgments for CEPHIA group and AMPLIAR details. This work was supported by the Bill & Melinda Gates Foundation Global Health grants OPP1068333 (to GDT), OPP1062806 (to CDP), OPP1115799 (to NP), and OPP1017716 (to Gary Murphy, Public Health England); the Collaboration for AIDS Vaccine Discovery; the Comprehensive Antibody Vaccine Immune Monitoring Consortium (OPP1032144, OPP1146996); the National Institute of Allergy and Infectious Diseases of the NIH CHAVI grant AI067854 and the Duke CHAVI and Immunogen Discovery (CHAVI-ID) grant AI100645; and the Duke Center for AIDS Research Immunology Core (AI064518). This work was also supported by a cooperative agreement (W81XWH-07-2-0067) between the Henry M. Jackson Foundation for the Advancement of Military Medicine Inc. and the US Department of Defense (DOD). This research was funded in part by the US National Institute of Allergy and Infectious Diseases. The views expressed are those of the authors and should not be construed to represent the positions of the US Army or DOD. Additionally, this work was made possible in part by the International AIDS Vaccine Initiative (IAVI), with support from the US Agency for International Development. The full list of IAVI donors is available at http://www.iavi.org/. The contents are the responsibility of the study authors and do not necessarily reflect the views of the US government.
Version 1. 12/21/2017
Electronic publication
Footnotes
AWD’s present address is: Graduate Program in Molecular and Cellular Biosciences, Wake Forest University, Winston Salem, North Carolina, USA.
HXL’s present address is: College of Life Science and Technology, Jinan University, Guangzhou, China.
Conflict of interest: K.E. Seaton, W. Rountree, J. Bainbridge, N.A. Vandergrift, X. Shen, N.L. Yates, B.F. Haynes, H.-X. Liao, and G.D. Tomaras are listed as inventors on a pending patent (PCT/US17/40744) arising from this work.
License: This work is licensed under the Creative Commons Attribution 4.0 International License. To view a copy of this license, visit http://creativecommons.org/licenses/by/4.0/.
Reference information: JCI Insight. 2017;2(24): e94355. https://doi.org/10.1172/jci.insight.94355.
Contributor Information
Nathan A. Vandergrift, Email: nathan.vandergrift@duke.edu.
Wes Rountree, Email: wes.rountree@duke.edu.
John Bainbridge, Email: john.bainbridge@duke.edu.
Eduard Grebe, Email: eduardgrebe@sun.ac.za.
Sheetal Sawant, Email: sheetal.sawant@duke.edu.
Xiaoying Shen, Email: xiaoying.shen@duke.edu.
Hua-Xin Liao, Email: hliao@duke.edu.
Barton F. Haynes, Email: barton.haynes@duke.edu.
Neil Parkin, Email: neil.parkin@finddx.org.
Nigel Garrett, Email: nigel.garrett@caprisa.org.
Denise Naniche, Email: denise.naniche@isglobal.org.
Sheila Keating, Email: skeating@bloodsystems.org.
Dylan Hampton, Email: dhampton@bloodsystems.org.
Shelley Facente, Email: shelley@facenteconsulting.com.
Kara Marson, Email: kara.marson@ucsf.edu.
Alex Welte, Email: alexwelte@sun.ac.za.
Georgia D. Tomaras, Email: georgia.tomaras@duke.edu.
References
- 1.Sharma UK, et al. Workshop summary: Novel biomarkers for HIV incidence assay development. AIDS Res Hum Retroviruses. 2012;28(6):532–539. doi: 10.1089/aid.2011.0332. [DOI] [PMC free article] [PubMed] [Google Scholar]
- 2.Incidence Assay Critical Path Working Group. More and better information to tackle HIV epidemics: towards improved HIV incidence assays. PLoS Med. 2011;8(6):e1001045. doi: 10.1371/journal.pmed.1001045. [DOI] [PMC free article] [PubMed] [Google Scholar]
- 3.Rerks-Ngarm S, et al. Vaccination with ALVAC and AIDSVAX to prevent HIV-1 infection in Thailand. N Engl J Med. 2009;361(23):2209–2220. doi: 10.1056/NEJMoa0908492. [DOI] [PubMed] [Google Scholar]
- 4.Cohen MS, et al. Prevention of HIV-1 infection with early antiretroviral therapy. N Engl J Med. 2011;365(6):493–505. doi: 10.1056/NEJMoa1105243. [DOI] [PMC free article] [PubMed] [Google Scholar]
- 5.Baeten JM, et al. Antiretroviral prophylaxis for HIV prevention in heterosexual men and women. N Engl J Med. 2012;367(5):399–410. doi: 10.1056/NEJMoa1108524. [DOI] [PMC free article] [PubMed] [Google Scholar]
- 6.Kassanjee R, et al. Independent assessment of candidate HIV incidence assays on specimens in the CEPHIA repository. AIDS. 2014;28(16):2439–2449. doi: 10.1097/QAD.0000000000000429. [DOI] [PMC free article] [PubMed] [Google Scholar]
- 7.Longosz AF, et al. Immune responses in Ugandan women infected with subtypes A and D HIV using the BED capture immunoassay and an antibody avidity assay. J Acquir Immune Defic Syndr. 2014;65(4):390–396. doi: 10.1097/QAI.0000000000000006. [DOI] [PMC free article] [PubMed] [Google Scholar]
- 8.Longosz AF, et al. Impact of HIV subtype on performance of the limiting antigen-avidity enzyme immunoassay, the bio-rad avidity assay, and the BED capture immunoassay in Rakai, Uganda. AIDS Res Hum Retroviruses. 2014;30(4):339–344. doi: 10.1089/aid.2013.0169. [DOI] [PMC free article] [PubMed] [Google Scholar]
- 9.Mullis CE, et al. Differential specificity of HIV incidence assays in HIV subtypes A and D-infected individuals from Rakai, Uganda. AIDS Res Hum Retroviruses. 2013;29(8):1146–1150. doi: 10.1089/aid.2012.0105. [DOI] [PMC free article] [PubMed] [Google Scholar]
- 10.Longosz AF, et al. Comparison of antibody responses to HIV infection in Ugandan women infected with HIV subtypes A and D. AIDS Res Hum Retroviruses. 2015;31(4):421–427. doi: 10.1089/aid.2014.0081. [DOI] [PMC free article] [PubMed] [Google Scholar]
- 11.Kassanjee R, et al. Viral load criteria and threshold optimization to improve HIV incidence assay characteristics. AIDS. 2016;30(15):2361–2371. doi: 10.1097/QAD.0000000000001209. [DOI] [PMC free article] [PubMed] [Google Scholar]
- 12.Murphy G, et al. Moving towards a reliable HIV incidence test - current status, resources available, future directions and challenges ahead. Epidemiol Infect. 2017;145(5):925–941. doi: 10.1017/S0950268816002910. [DOI] [PMC free article] [PubMed] [Google Scholar]
- 13.Morrison CS, et al. Assays for estimating HIV incidence: updated global market assessment and estimated economic value. J Int AIDS Soc. 2017;20(3):e25018. doi: 10.1002/jia2.25018. [DOI] [PMC free article] [PubMed] [Google Scholar]
- 14. Technical update on HIV incidence assays for surveillance and monitoring purposes. UNAIDS. http://www.unaids.org/en/resources/documents/2015/HIVincidenceassayssurveillancemonitoring Published April 1, 2015. Accessed November 22, 2017.
- 15.Yates NL, et al. HIV-1 gp41 envelope IgA is frequently elicited after transmission but has an initial short response half-life. Mucosal Immunol. 2013;6(4):692–703. doi: 10.1038/mi.2012.107. [DOI] [PMC free article] [PubMed] [Google Scholar]
- 16.Tomaras GD, et al. Initial B-cell responses to transmitted human immunodeficiency virus type 1: virion-binding immunoglobulin M (IgM) and IgG antibodies followed by plasma anti-gp41 antibodies with ineffective control of initial viremia. J Virol. 2008;82(24):12449–12463. doi: 10.1128/JVI.01708-08. [DOI] [PMC free article] [PubMed] [Google Scholar]
- 17.Yates NL, et al. Multiple HIV-1-specific IgG3 responses decline during acute HIV-1: implications for detection of incident HIV infection. AIDS. 2011;25(17):2089–2097. doi: 10.1097/QAD.0b013e32834b348e. [DOI] [PMC free article] [PubMed] [Google Scholar]
- 18.Wilson KM, et al. Incidence immunoassay for distinguishing recent from established HIV-1 infection in therapy-naive populations. AIDS. 2004;18(17):2253–2259. doi: 10.1097/00002030-200411190-00005. [DOI] [PubMed] [Google Scholar]
- 19.Curtis KA, Kennedy MS, Owen SM. Longitudinal analysis of HIV-1-specific antibody responses. AIDS Res Hum Retroviruses. 2014;30(11):1099–1105. doi: 10.1089/aid.2014.0105. [DOI] [PubMed] [Google Scholar]
- 20.Liu P, et al. Dynamic antibody specificities and virion concentrations in circulating immune complexes in acute to chronic HIV-1 infection. J Virol. 2011;85(21):11196–11207. doi: 10.1128/JVI.05601-11. [DOI] [PMC free article] [PubMed] [Google Scholar]
- 21.Curtis KA, et al. Development and characterization of a bead-based, multiplex assay for estimation of recent HIV type 1 infection. AIDS Res Hum Retroviruses. 2012;28(2):188–197. doi: 10.1089/aid.2011.0037. [DOI] [PubMed] [Google Scholar]
- 22.Keele BF, et al. Identification and characterization of transmitted and early founder virus envelopes in primary HIV-1 infection. Proc Natl Acad Sci USA. 2008;105(21):7552–7557. doi: 10.1073/pnas.0802203105. [DOI] [PMC free article] [PubMed] [Google Scholar]
- 23.Russell ES, et al. Short communication: HIV type 1 subtype C variants transmitted through the bottleneck of breastfeeding are sensitive to new generation broadly neutralizing antibodies directed against quaternary and CD4-binding site epitopes. AIDS Res Hum Retroviruses. 2013;29(3):511–515. doi: 10.1089/aid.2012.0197. [DOI] [PMC free article] [PubMed] [Google Scholar]
- 24.Rademeyer C, et al. Features of recently transmitted HIV-1 clade C viruses that impact antibody recognition: implications for active and passive immunization. PLoS Pathog. 2016;12(7):e1005742. doi: 10.1371/journal.ppat.1005742. [DOI] [PMC free article] [PubMed] [Google Scholar]
- 25.Gnanakaran S, et al. Genetic signatures in the envelope glycoproteins of HIV-1 that associate with broadly neutralizing antibodies. PLoS Comput Biol. 2010;6(10):e1000955. doi: 10.1371/journal.pcbi.1000955. [DOI] [PMC free article] [PubMed] [Google Scholar]
- 26.Liao HX, et al. Co-evolution of a broadly neutralizing HIV-1 antibody and founder virus. Nature. 2013;496(7446):469–476. doi: 10.1038/nature12053. [DOI] [PMC free article] [PubMed] [Google Scholar]
- 27.Cohen MS, Shaw GM, McMichael AJ, Haynes BF. Acute HIV-1 Infection. N Engl J Med. 2011;364(20):1943–1954. doi: 10.1056/NEJMra1011874. [DOI] [PMC free article] [PubMed] [Google Scholar]
- 28.Robb ML, Eller LA, Rolland M. Acute HIV-1 infection in adults in East Africa and Thailand. N Engl J Med. 2016;375(12):1195. doi: 10.1056/NEJMc1609157. [DOI] [PubMed] [Google Scholar]
- 29.Murphy G, et al. Moving towards a reliable HIV incidence test - current status, resources available, future directions and challenges ahead. Epidemiol Infect. 2017;145(5):925–941. doi: 10.1017/S0950268816002910. [DOI] [PMC free article] [PubMed] [Google Scholar]
- 30.Kassanjee R, McWalter TA, Welte A. Short Communication: Defining optimality of a test for recent infection for HIV incidence surveillance. AIDS Res Hum Retroviruses. 2014;30(1):45–49. doi: 10.1089/aid.2013.0113. [DOI] [PMC free article] [PubMed] [Google Scholar]
- 31.Mastro TD, et al. Estimating HIV incidence in populations using tests for recent infection: issues, challenges and the way forward. J HIV AIDS Surveill Epidemiol. 2010;2(1):1–14. [PMC free article] [PubMed] [Google Scholar]
- 32.Busch MP, et al. Beyond detuning: 10 years of progress and new challenges in the development and application of assays for HIV incidence estimation. AIDS. 2010;24(18):2763–2771. doi: 10.1097/QAD.0b013e32833f1142. [DOI] [PubMed] [Google Scholar]
- 33.Janssen RS, et al. New testing strategy to detect early HIV-1 infection for use in incidence estimates and for clinical and prevention purposes. JAMA. 1998;280(1):42–48. doi: 10.1001/jama.280.1.42. [DOI] [PubMed] [Google Scholar]
- 34.Parekh BS, et al. Quantitative detection of increasing HIV type 1 antibodies after seroconversion: a simple assay for detecting recent HIV infection and estimating incidence. AIDS Res Hum Retroviruses. 2002;18(4):295–307. doi: 10.1089/088922202753472874. [DOI] [PubMed] [Google Scholar]
- 35.Duong YT, et al. Detection of recent HIV-1 infection using a new limiting-antigen avidity assay: potential for HIV-1 incidence estimates and avidity maturation studies. PLoS ONE. 2012;7(3):e33328. doi: 10.1371/journal.pone.0033328. [DOI] [PMC free article] [PubMed] [Google Scholar]
- 36.Curtis KA, Hanson DL, Kennedy MS, Owen SM. Evaluation of a multiplex assay for estimation of HIV-1 incidence. PLoS ONE. 2013;8(5):e64201. doi: 10.1371/journal.pone.0064201. [DOI] [PMC free article] [PubMed] [Google Scholar]
- 37.McMichael AJ, Borrow P, Tomaras GD, Goonetilleke N, Haynes BF. The immune response during acute HIV-1 infection: clues for vaccine development. Nat Rev Immunol. 2010;10(1):11–23. doi: 10.1038/nri2674. [DOI] [PMC free article] [PubMed] [Google Scholar]
- 38.Cohen MS, Gay CL, Busch MP, Hecht FM. The detection of acute HIV infection. J Infect Dis. 2010;202 Suppl 2:S270–S277. doi: 10.1086/655651. [DOI] [PubMed] [Google Scholar]
- 39.Fiebig EW, et al. Dynamics of HIV viremia and antibody seroconversion in plasma donors: implications for diagnosis and staging of primary HIV infection. AIDS. 2003;17(13):1871–1879. doi: 10.1097/00002030-200309050-00005. [DOI] [PubMed] [Google Scholar]
- 40.Counihan NA, Anderson DA. Specific IgA enhances the transcytosis and excretion of hepatitis A virus. Sci Rep. 2016;6:21855. doi: 10.1038/srep21855. [DOI] [PMC free article] [PubMed] [Google Scholar]
- 41.Zhang R, et al. Novel monoclonal antibodies for studies of human and rhesus macaque secretory component and human J-chain. Monoclon Antib Immunodiagn Immunother. 2016;35(4):217–226. doi: 10.1089/mab.2016.0014. [DOI] [PMC free article] [PubMed] [Google Scholar]
- 42.Santra S, et al. Human non-neutralizing hiv-1 envelope monoclonal antibodies limit the number of founder viruses during SHIV mucosal infection in rhesus macaques. PLoS Pathog. 2015;11(8):e1005042. doi: 10.1371/journal.ppat.1005042. [DOI] [PMC free article] [PubMed] [Google Scholar]
- 43.Liao HX, et al. Vaccine induction of antibodies against a structurally heterogeneous site of immune pressure within HIV-1 envelope protein variable regions 1 and 2. Immunity. 2013;38(1):176–186. doi: 10.1016/j.immuni.2012.11.011. [DOI] [PMC free article] [PubMed] [Google Scholar]
- 44.Montefiori DC, et al. Magnitude and breadth of the neutralizing antibody response in the RV144 and Vax003 HIV-1 vaccine efficacy trials. J Infect Dis. 2012;206(3):431–441. doi: 10.1093/infdis/jis367. [DOI] [PMC free article] [PubMed] [Google Scholar]
- 45.Katinger H. Human monoclonal antibodies for passive immunotherapy of HIV-1. Antibiot Chemother (1971) 1994;46:25–37. doi: 10.1159/000423631. [DOI] [PubMed] [Google Scholar]
- 46.Hwang KK, et al. IGHV1-69 B cell chronic lymphocytic leukemia antibodies cross-react with HIV-1 and hepatitis C virus antigens as well as intestinal commensal bacteria. PLoS One. 2014;9(3):e90725. doi: 10.1371/journal.pone.0090725. [DOI] [PMC free article] [PubMed] [Google Scholar]
- 47. Tabachnick B, Fidell LS. Using Multivariate Statistics. New York, NY: HarperCollins College Publishers; 1996. [Google Scholar]
- 48. Welte A, Grebe E, McIntosh A, Bäumler P. inctools: Incidence Estimation Tools (R package). https://cran.r-project.org/web/packages/inctools/ Accessed December 12, 2017.
- 49. R Core Team. R: A language and environment for statistical computing. R Foundation for Statistical Computing, Vienna, Austria. http://www.R-project.org/ Accessed December 12, 2017.
Associated Data
This section collects any data citations, data availability statements, or supplementary materials included in this article.