Abstract
Heterogeneity within and among tumors in a metastatic cancer patient is a well-established phenomenon that may confound treatment and accurate prognosis. Here, we used whole-exome sequencing to survey metastatic breast cancer tumors from 5 patients in a rapid autopsy program to construct the origin and genetic development of metastases. Metastases were obtained from 5 breast cancer patients using a rapid autopsy protocol and subjected to whole-exome sequencing. Metastases were evaluated for sharing of somatic mutations, correlation of copy number variation and loss of heterozygosity, and genetic similarity scores. Pathological features of the patients’ disease were assessed by immunohistochemical analyses. Our data support a monoclonal origin of metastasis in 3 cases, but in 2 cases, metastases arose from at least 2 distinct subclones in the primary tumor. In the latter 2 cases, the primary tumor presented with mixed histologic and pathologic features, suggesting early divergent evolution within the primary tumor with maintenance of metastatic capability in multiple lineages. We used genetic and histopathological evidence to demonstrate that metastases can be derived from a single or multiple independent clones within a primary tumor. This underscores the complexity of breast cancer clonal evolution and has implications for how best to determine and implement therapies for early- and late-stage disease.
Keywords: Genetics
Keywords: Genetic variation
The mutational spectrum of metastases reveals whether they derive from one or multiple subclones in the primary tumor.
Introduction
Metastatic disease continues to be the main cause of breast cancer mortality. Intratumor genetic heterogeneity in a primary tumor and subsequent metastases is well established (1). It is thought to be an underlying reason for the emergence of drug resistance and, thus, factors into clinical decision making (2). For example, estrogen receptor-α (ER) expression, even in a relatively low percentage of the primary tumor, influences the decision to administer adjuvant endocrine therapy after surgery. Given the importance of ER, progesterone receptor (PR), and human epidermal growth factor receptor 2 (HER2) for both early and metastatic breast cancer therapy, biopsy of a metastatic site has now become routine when patients present with disease recurrence. However, a survey of the literature reveals differences in opinions regarding the level of genetic heterogeneity among metastatic tumors and how it could in theory affect treatment choices (3–5). Assessing every metastatic tumor would be ideal, particularly in light of recent findings of hormone therapy–resistant mutations in ER (ESR1 gene) found in only one or a subset of metastatic tumors within a given patient (6, 7). Unfortunately, sampling every metastasis is currently impossible in a living patient, and very small tumors (<2 mm) and micrometastases are not readily detectable by current imaging techniques (8). Samples from rapid autopsy series present a unique opportunity to study the biogenesis and progression of tumor metastasis. Tumors are harvested promptly postmortem and are immediately flash frozen, preserving the quality of nucleic acids and other cellular analytes (9). Here, we analyzed metastatic breast cancer tumors from 5 patients who participated in a rapid autopsy program, including 3 patients with ER-positive breast cancer and 2 patients with triple-negative breast cancer. For each patient, we performed whole-exome sequencing using DNA from 3 flash frozen metastatic tumors harvested from different organ sites. Where available, limited sequencing was performed on the primary tumors, but due to sample exhaustion and poor quality of DNA from archival tissue, this analysis was not complete. In addition, germline DNA was not available for whole-exome sequencing. Therefore, we harnessed the ExAC data set as a panel of normal controls and identified somatic single nucleotide variants (SNV) and copy number variants (CNVs) in each metastatic tumor.
In 3 patients, all metastases shared a clonal origin in the primary tumor and diverged genetically as they grew separately and gained mutations. Our data suggest that, in the 2 remaining patients, the 3 metastases arose separately from 2 different subclones. These 2 patients had primary tumors with mixed histologic and pathologic features, suggesting that early divergent tumor evolution within the primary tumor produced subclones independently capable of metastasis.
Results
Sequencing and bioinformatics analyses.
Exome data were processed as described in our earlier study (10) to produce an annotated list of somatic mutations for each metastasis (see Methods and flow chart in Supplemental Figure 1; supplemental material available online with this article; https://doi.org/10.1172/jci.insight.96896DS1).
Overview of alterations in known breast cancer genes.
For each of the 5 selected metastatic breast cancer patients enrolled in a rapid autopsy program (9), we processed 3 metastases, each originating from a different distant organ (see case histories in Supplemental Table 2). We extracted genomic DNA from the samples and performed whole-exome sequencing to an average of 50–80× coverage. See Supplemental Table 1 for details on anatomical sites, sequencing depth, and mutation metrics for all samples.
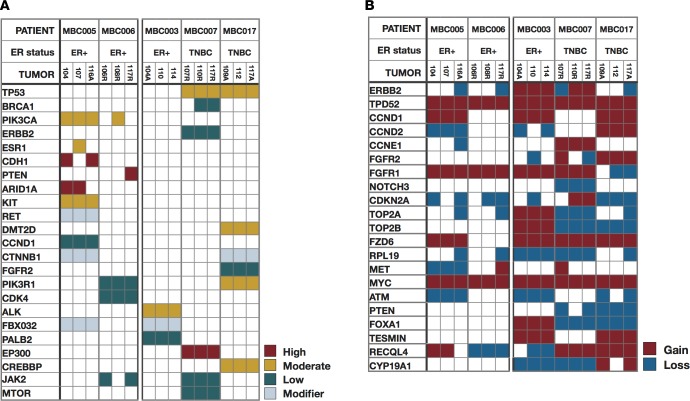
We surveyed the SNV and copy number calls for presence of somatic mutations, copy number changes, and loss of heterozygosity (LOH) across the genome. The spectrum of mutations was compared across metastases within and between patients; here, we categorized variants as high, medium, and low impact based upon their predicted functional consequence by SnpSift (11) (Figure 1A). High-impact variants include frameshift, stop gain, or splice site variants; moderate-impact variants include missense mutations and in-frame indels; and low-impact variants include synonymous changes that are often considered passenger mutations. While private variants were identified for each metastasis, the majority of both single nucleotide and copy number changes were found to be persistent across metastases in all impact categories within a patient. For example, TP53 mutations were detected in all 3 metastases from patients MBC007 and MBC017 (p.Arg248Gln and p.His193Asp, respectively) and confirmed by immunohistochemistry in patient MBC007 (Supplemental Figure 2 and Supplemental Table 2; copy number calls for all samples, for genes commonly altered in breast cancer, are noted in Supplemental Table 3).
Figure 1. Single nucleotide and copy number changes across metastases.
Overview of single nucleotide variants and copy number changes in genes previously implicated in breast cancer, across all metastases sampled. Patient IDs are at provided the top, and data for 3 metastases per patient are shown. (A) SNVs and indels, colored by predicted impact. (B) Copy number changes.
Notable instances in which high-impact variants were found in only 1 or 2 of the metastases examined in a patient include the PIK3CA hotspot mutation (p.His1047Arg) (12), CDH1 inactivation, BRCA1 mutations, and a point mutation in ESR1. Metastases in patient MBC005 are particularly interesting, with 2 metastases (liver and pancreas) harboring a high-impact, loss-of-function CDH1 somatic mutation (p.Gln631*). The third metastasis (pericardial) has nonmutated CDH1 but has a hotspot ligand-binding domain resistance mutation (p.Asp538Gly) in the ESR1 gene (13) that is not found in the other 2 samples. Additionally, the pericardial metastasis (sample 107) displayed predominant ductal morphology, unlike the liver (sample 104) and pancreas (sample 116A) metastases that are both lobular, consistent with the CDH1 loss-of-function mutation they harbor. Histopathology and staining confirmed that these mutations lead to contrasting patterns of PR, p21, E-cadherin, and β-catenin expression (14) in the pericardial metastasis, compared with a liver metastasis (Figure 2), and highlight the divergent morphology of these lesions.
Figure 2. Immunohistochemistry correlation with variant calls.
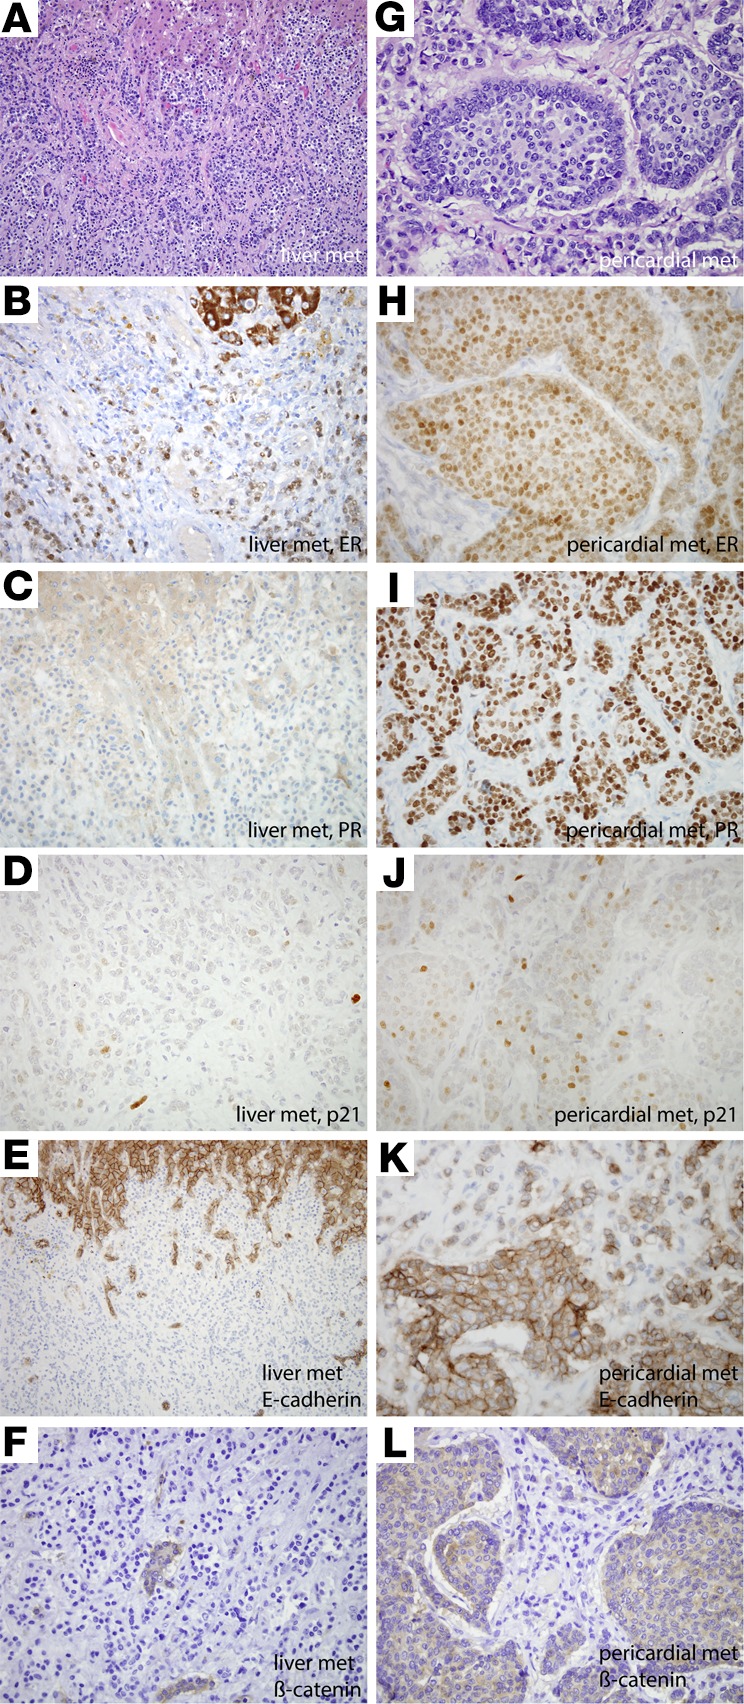
Variable immunoreactivity for estrogen receptor (ER), progesterone receptor (PR), p21, E-cadherin, and β-catenin in liver and pericardial metastases correlates with variable ER and E-cadherin mutational status (MBC005). This patient’s primary tumor was an ER- and PR-positive, invasive ductal carcinoma. The majority of metastases, including the liver metastases, (A) demonstrated lobular morphology, whereas the pericardial metastasis (G) showed predominant ductal morphology. By whole-exome sequencing, β-catenin was mutated in all metastases. E-cadherin was mutated in the liver and pancreatic metastases but not the pericardium, while ER was mutated in the pericardial metastases but not the liver and pancreas. Both the liver (B) and pericardial metastases (H) demonstrated similar diffuse but weak labeling for ER (60%, weak). While the liver metastasis demonstrated minimal (5%, moderate) immunoreactivity for PR (C) and minimal labeling of p21 (D), the pericardial metastases, which harbored an ESR1 mutation, were diffusely and strongly immunoreactive for PR (80%, strong) (I) and demonstrated upregulated p21 expression (J). Consistent with mutational analysis, E-cadherin immunohistochemical labeling was lost in the liver metastases (E) (note intact expression in hepatocytes at the top part of the figure) but predominantly retained in the pericardial metastasis (K). β-Catenin expression was similarly lost in the liver metastasis (F) (note intact labeling in entrapped bile ducts) but was cytoplasmic (not membranous) in the pericardial metastases (L). Original magnification, ×400.
Metastases in patient MBC006 were discordant for a PTEN mutation, which was present only in the mediastinal lymph node metastasis (sample 117R). This genetic observation was again confirmed by immunohistochemical labeling (Supplemental Figure 3).
Metastases from patient MBC003 and the 2 patients with TP53 mutations, patients MBC007 and MBC017, were within each patient highly concordant for CNVs. Copy number changes were persistent across metastases for genes that are often coamplified, including amplification of ERBB2 and TOP2A (15), which were found in all 3 metastases in patient MBC003. Along with amplification of ERBB2, we detected amplification of TPD52, which has been identified as a survival factor in ERBB2-amplified tumors in breast cancer (16). Other commonly detected alterations, such as MYC amplifications, occurred at varying levels in all samples (Figure 1B and Supplemental Table 3).
Genome-wide mutational profiles of metastases.
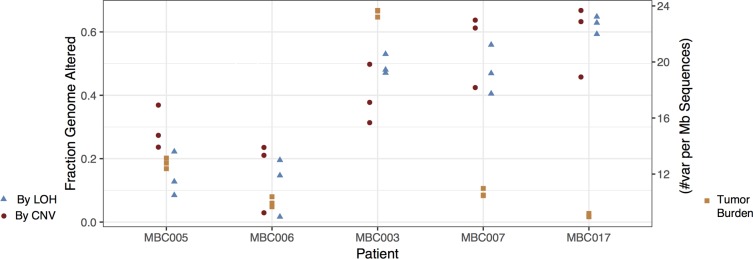
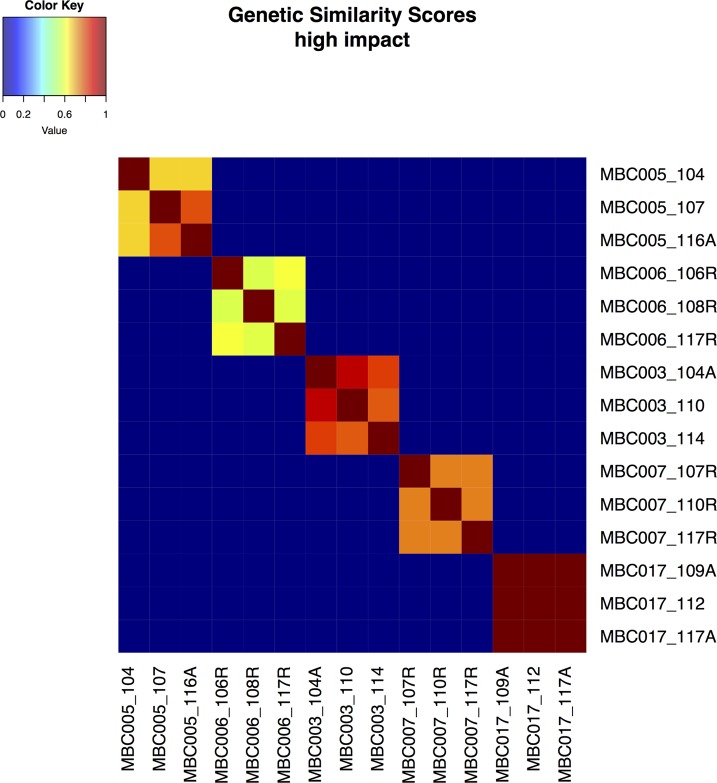
Large-scale genomic alterations, such as CNV and LOH, were observed in all of the metastasis samples to various extents. The fraction of the genome altered by CNV and LOH, and the mutational burden, was generally very consistent within metastases for each patient (Figure 3 and Supplemental Table 1), though these measures differed markedly among patients. See circle plots below and Supplemental Figure 4 for a depiction of detailed landscapes of CNV and LOH in all metastases. The pairwise genetic similarity scores (no. shared variants/no. shared variants + no. unique variants/2) were generally high among metastases from a single patient, though the scores varied across effect categories, and samples from patients MBC005, MBC006, and MBC007 displayed much less genetic similarity in the high-impact category than the other 2 patients (Figure 4 and Supplemental Table 4).
Figure 3. The extent of genome alteration is similar among metastases from each patient.
For each patient, the fractions of the genome altered by copy number variation (CNV) (circles) and loss of heterozygosity (LOH) (triangles) are shown for each metastasis. Additionally, the number of variants (SNVs and indels) per megabase is shown (squares) for each metastasis.
Figure 4. Genetic similarity scores.
Genetic similarity scores were calculated as described for all pairs of samples for high-impact mutations. Similarity among metastases within each patient is generally substantial but varies. Genetic similarity scores range from 0 to 1 and are colored as depicted.
Allele frequencies of SNVs and indels.
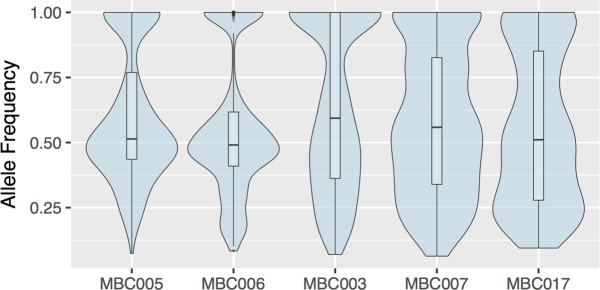
As noted in earlier work (10), comparing variant allele frequencies across related tumors can shed light on the genetic origin of the tissues. Figure 5 depicts the average allele frequencies of shared variants in the 3 metastases from each patient (see Supplemental Figure 5 for plots, including the distribution of private variants for each metastasis). Notably, the shared variants from metastases from patients MBC005 and MBC006 have relatively high frequencies compared with those from the other 3 patients, and variants at lower frequencies in these samples tended to be private to 1 or 2 metastases, suggesting that the metastases in the first 2 patients may be less closely related to each other (corroborating the conclusions from the genetic similarity scores).
Figure 5. Shared variants occur at similar allele frequencies across metastases.
Violin plots showing, for each patient, the distribution of allele frequencies of variants shared among all metastases of that patient. Box plots mark median and first and third quartiles, and whiskers extend to 1.5 times the interquartile range.
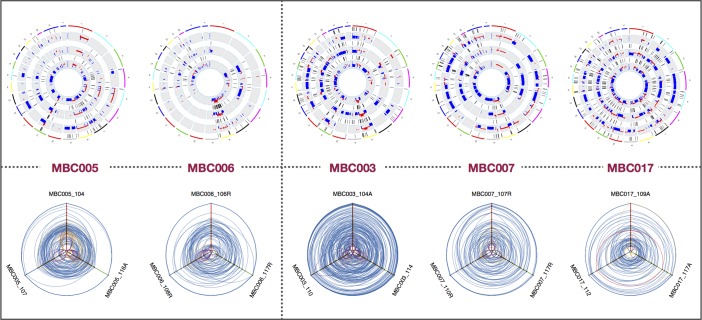
We appropriated hive plots, a network visualization tool (17), to visualize the allele frequencies of SNVs and small indels among metastases in more detail, and these are displayed along with the corresponding circle plot for each patient, depicting CNV and LOH for each metastasis (Figure 6). The global pattern of genetic variation in metastases is evident from these plots, as the shared allele frequency distributions are notably different (consistent with the violin plots, showing common mutations mostly at high and near-50% allele frequency) in patients MBC005 and MBC006. These patients harbor less overall copy number variation than MBC003, MBC007, and MBC017; all 3 of the latter patients have shared variants across all allele frequencies. Extensive shared CNV was apparent in patients MBC007 and MBC017, consistent with the TP53 mutation observed in those patients, and prominent CNV was seen in patient MBC003 as well.
Figure 6. Hive plots, copy number variation, and loss of heterozygosity profiles reveal patient-specific patterns.
Hive plots of allele frequencies for all variants, for each patient, suggest trajectories of variant accumulation and tumor evolution. In each hive plot, the axes represent allele frequency, with 0% at the center and 100% at the periphery. A variant in one metastasis is connected with a line to the appropriate allele frequencies in the other metastases. Variants specific to one metastasis are in purple; yellow denotes variants in 2 metastases. See Supplemental Figure 7 for an overview of hive plots. Also shown are copy number variation (CNV) and loss of heterozygosity (LOH) profiles for 3 metastases for each of the 5 patients. Copy number changes are displayed in red and blue, inside tracks with LOH marked in purple, in concentric rings for related metastases.
Discussion
Using genome-wide data from exome sequencing, coupled with histopathological evidence, we determined the mutational load as well as the extent of CNV and LOH, in addition to investigating specific mutations with known impact. Though we lacked information about the primary tumor and normal tissue, this approach enabled us to infer the relatedness of metastases from one patient and to determine whether they have a single clonal origin or derive from multiple clones in the primary tumor.
Patients MBC005 and MBC006 both have high-frequency variants shared among all 3 metastases, fewer mid- and low-allele frequency shared variants, and lower genetic similarity scores among metastases. In patient MBC005, metastases were discordant for commonly mutated driver/resistance genes in breast cancer (12, 13, 18, 19), including BRCA1, ARID1A, CDH1, and ESR1 mutations. Along with the strong histopathological evidence for multiple subtypes in the primary cancer and divergent (lobular vs. ductal) histology in the metastases, this suggests that metastases samples 104 (liver) and 116A (pancreas) derive from a separate subclone that then gave rise to metastasis sample 107 (pericardium) in the primary tumor. Similarly, metastases in patient MBC006 were discordant for PIK3CA and PTEN mutations, and CNVs were less conserved across these, as evident by lower Pearson correlation coefficients (Supplemental Figure 6). The higher genetic similarity score for patient MBC017 was associated with a lower overall mutation burden than any of the other sets of metastases, though these metastases had extensive copy number alterations (as do the samples from patient MBC007), consistent with loss of TP53 (20–22).
The genomic structure and range of SNVs in metastases from patients MBC003, MBC007, and MBC017 are consistent with metastatic spread from a single subclone in a primary tumor. While variant allele frequencies span a much wider range in 2 of these patients (MBC007 and MBC017), these patients harbor a TP53 mutation that coincides with strikingly high CNV and LOH. In these cases, sharing of variants at low allele frequencies can be attributed to massive (and concordant) CNV and LOH seen in the metastases. Samples from patient MBC003 also displayed high correlation, marked by high mutation burden and low CNV. In all 3 cases, variants are shared at low allele frequencies, consistent with extensive shared CNVs.
In these 3 cases, it is apparent that, even as the metastatic tumors develop at distant sites at different rates and times, they can maintain a similar mutational landscape that includes SNVs, indels, and complex structural changes, suggesting that for these cases, therapies aimed toward one metastasis may affect all metastases equally. Thus, for any given therapy, global response or resistance may be seen. This pattern would also suggest that the selective pressure of any effective therapy may lead to acquired resistance and the emergence of subclones that could again be largely similar in their mutational landscape.
Two patients (MBC005 and MBC006), however, displayed a very different trajectory of metastatic tumor evolution. For both patients, we observed fewer overall structural alterations within each of the metastases, but metastases were discordant for major mutagenic events. Interestingly, for both of these patients, the primary and metastatic tumors were discordant for ER status, and the metastases were discordant among themselves for critical breast cancer mutations, suggesting multiple evolutionary trajectories among the metastases in each patient. One of the metastases from patient MBC005 harbors an endocrine therapy-resistant ESR1 mutation, and the other 2 metastases from the same patient have CDH1 loss-of-function mutations. This patient’s primary tumor had ductal histology with lobular features but was positive for E-cadherin labeling (9); the presence of a CDH1 mutation and the level of dissimilarity among metastases suggest that the metastases came from 2 separate subclones in the primary tumor, one lobular and one ductal. Metastases from patient MBC006, when compared with those from MBC005, displayed a similar profile of SNV and CNV sharing, including shared low-frequency events and few shared high-frequency events. In this patient, 1 of the 3 metastases had both a PTEN and a PIK3CA mutation that are not shared by the other 2 metastases. As these are significant and potentially driver mutations, it is possible that the metastases are derived from different subclones in this patient as well.
The approach to treating metastatic disease could theoretically be governed by the biological processes that gave rise to those tumors. Current practice for metastatic breast cancer is to biopsy an amenable lesion to reassess hormone receptor and HER2 status. Additionally, more patients are having such biopsies sequenced with the hope of finding an actionable mutation that may provide rationale for a clinical trial and/or off-label use of targeted therapies (23). However, our study suggests that a single biopsy specimen from the primary tumor may not give adequate information to guide treatment of metastatic disease, as the biopsy may not cover the relevant subclone; additionally, there may be multiple subclones that generate metastases.
The spectrum of shared variant allele frequencies may be informative; in the case of the 2 patients with metastases potentially derived from more than one subclone, they will share mostly homozygous or other highly prevalent mutations in the primary tumor and are less likely to share mutations that were at low allele frequencies in the primary tumor. This lack of shared passenger mutations signals divergent origins of the metastases. In at least one of these cases, the primary tumor displayed multiple histological subtypes. Biopsies of multiple metastases, and potentially circulating tumor DNA or tumor cells, may reveal the evolutionary complexity displayed in these patients. Large-scale analyses of data sets with multiple metastases per patient may establish genetic profiles most commonly associated with cancers disseminated from single versus multiple subclones, possibly enabling determination of the tumor evolution pattern (and thus the most effective treatment protocol) in a newly diagnosed patient without the benefit of genetic information from multiple metastases. During the preparation of this manuscript, Brown et al. reported similar results using primary and metastatic lesions from 10 autopsy patients (24). Their results and conclusions are strikingly similar to our own data, lending further credence to the idea that evolutionary patterns of metastases can be quite variable and may depend on the genetic complexity of the patient’s primary tumor.
Our results suggest that histologically and genetically homogeneous primary tumors produce homogenous metastases and, therefore, genotyping one metastatic lesion may be sufficiently informative to drive clinical decision regarding treatment course. On the other hand, primary tumors of mixed histology can produce a variety of metastases, with each metastatic lesion potentially having a unique susceptibility or resistance to a given therapy. Understanding a patient’s paradigm of metastases may enable clinicians to tailor treatment regimens and spare side effects by choosing agents that can be effective despite the degree of intertumor heterogeneity.
Methods
Case selection and rapid autopsy.
Autopsies were performed within 1–4 hours of death, and metastases used in this study were flash frozen for tumor banking. Detailed descriptions of this rapid autopsy series, case selection, autopsies, and histology have been previously provided (9).
Genomic DNA extraction.
For primary tumors, we extracted DNA from formalin-fixed, paraffin-embedded tissue. After H&E-stained slide review and tumor tissue selection, we manually microdissected the corresponding tissue from 5 unstained, 5-μm-thick tissue sections using Pinpoint reagent according the manufacturer’s protocol (Zymo Research). We purified DNA from the sample using the QIAmp DNA kit (Qiagen) and quantified it by spectophotometry.
For metastatic samples, flash-frozen tumors were manually minced into small pieces using a fresh razor blade for each sample within a bleached sterile hood to minimize contamination. The samples were lysed and DNA was extracted and purified using the Qiagen DNeasy Blood & Tissue kit per the manufacturer’s instructions. DNA yield was quantified using both picogreen and nanodrop.
Whole-exome sequencing.
Tumor samples were subjected to next-generation sequencing library construction and sequencing (Seqwright DNA Technology Services). Whole-exome probe capture, library construction, and sequencing were performed using the Illumina HiSeq platform. Average coverage was 50–80× for each sample (Supplemental Table 1).
Alignment and variant calling.
We aligned paired-end whole-exome sequencing reads to the human reference genome (GRCh38) using BWA mem (25), with default parameters, and generated BAM files with Samtools (26). We then optimized the alignments according to GATK (version 3.6) MuTect2 (27) best practices. We used sambamba (28) to sort and index the alignments, Picard MarkDuplicates (http://broadinstitute.github.io/picard) to identify duplicate artifacts, and GATK BaseRecalibrator with knownSites set to dbSNP build 147 (29) to account for systemic base quality errors. For variant calling, we used GATK MuTect2, a somatic variant caller with high sensitivity and specificity, with the common dbSNP build 147 database, and Catalog of Somatic Mutations in Cancer (COSMIC) coding mutations database version 77 (http://cancer.sanger.ac.uk/cosmic) (30). In the absence of matched control, we employed the ExAC (31) variant calls (ExAC.r0.3.1.sites.vep.chr.vcf) as our panel of normal controls. We used Picard LiftoverVcf to convert the ExAC database file to GRCh38 using chain file hg19toHg38.over.chain. Criteria for variant selection included removing variants that were found in more than 6 samples, requiring at least 20 supporting reads for each locus in all tumors, a base call quality greater than 30 (phred scale, 99.9% confidence), allele frequencies greater than 0.1, and at least 4 reads with the alternative allele (MuTect2 parameters: --analysis_type MuTect2 --reference_sequence [GRCh38] --input_file:tumor [recalibrated and sorted bam file] --normal_panel [PON from ExAC] --dbsnp [common dbSNP build 147] --cosmic [COSMIC version 77]).
To increase the accuracy of variant calling, we added a regenotyping step in which we used MuTect2 to call variants with the —targets.interval_list option, which restricts variant calling to specify genomic intervals (in this case, exome capture targets provided by Seqwright) (MuTect2 parameters: --analysis_type MuTect2 --reference_sequence [GRCh38] --input_file:tumor [recalibrated and sorted bam file]—normal_panel [PON from ExAC] --dbsnp [common dbSNP build 147] --cosmic [COSMIC version 77] -L [ vcf with variants from 3 mets combined]).
We assessed functional outcomes of variants (high, moderate, and low impact) with SnpEff (32), only considering canonical genes annotated in the GRCh38 genome build and annotating variants existing in dbSNP build 147 or in COSMIC database version 77 (30). Variants found in the ExAC or the common dbSNP databases but not found in COSMIC were taken as population polymorphisms, while variants that were either novel or found in the COSMIC database and not in ExAC or dbSNP were assumed to be somatic (see Supplemental Figure 1 for the analysis pipeline flowchart).
CNV calling.
To determine copy number variations, we used CNVkit (version 0.8.3) (33), with the tumor-only options (as recommended in CNVkit documentation), using the batch option with the following parameters: cnvkit.py batch [recalibrated and sorted bam file] —normal --targets [exome regions bed file] --fasta [GRCh38] --split --annotate [ftp://hgdownload.cse.ucsc.edu/goldenPath//hg38/database/refFlat.txt.gz] --access [cnvkit-master/data/access-10kb.hg38.bed] --output-reference [SAMPLE].cnn.
Data visualization.
Python and R scripts were used to construct plots depicting SNV and CNV distributions, utilizing functions from the VariantAnnotation and ggplot2 packages. To visualize the relationships among metastatic tumors, we utilized the HiveR package (34).
Variant sharing metrics.
We measured the pairwise relatedness of CNV profiles via Pearson correlation coefficients using R (cor.test) and calculated the relatedness of SNV profiles by generating a genetic similarity score for variants in each metastatic tumor in all categories, using the following formula: no. shared variants/(no. shared variants + no. unique variants/2).
Study approval.
Patients with widely disseminated metastatic breast cancer provided written consent to participate in a rapid autopsy program that was reviewed and approved by the Institutional Review Board of The Johns Hopkins Hospital and the Department of Defense.
Author contributions
PA and BHP conceived of the project. PA, ACM, JLH, and AMD obtained tissues, created tissue microarrays, and performed pathology assessment with stains and molecular probes. PA, SS, JF, and JS performed the rapid autopsy program and obtained tissues for this study. BEA performed extraction and preparation of genomic DNA for sequencing. SJW and BEA designed and performed computational analyses. BEA, SJW, BHP, and PA interpreted data. BEA, ACM, AMD, JLH, JS, SS, JF, PA, BHP, and SJW wrote and reviewed the manuscript.
Supplementary Material
Acknowledgments
This work was supported by the SPORE career development award (to ACM), the Avon Foundation (to BHP), the NIH (CA194024 to BHP and P30 CA006973), the Department of Defense Center of Excellence (W81XWH-04-1-0595), the Sandy Garcia Charitable Foundation, the Commonwealth Foundation, the Breast Cancer Research Foundation, the Marcie Ellen Foundation, the Helen Golde Trust, the Susan G. Komen Foundation, and the Canney Foundation. None of the funding sources influenced the design, interpretation, or submission of this manuscript.
Version 1. 12/21/2017
Electronic publication
Footnotes
Conflict of interest: B.H. Park is a paid member of scientific advisory boards for Loxo Oncology and has ownership interest in Loxo Oncology. B.H. Park has research contracts with Foundation Medicine Inc. Under separate licensing agreements between Horizon Discovery and Johns Hopkins University, B.H. Park is entitled to a share of royalties received by Johns Hopkins University from the sale of products. The terms of this arrangement are being managed by Johns Hopkins University, in accordance with its conflict-of-interest policies.
Reference information: JCI Insight. 2017;2(24):e96896. https://doi.org/10.1172/jci.insight.96896.
Contributor Information
Ashley Cimino-Mathews, Email: acimino1@jhmi.edu.
James Shin, Email: james3shin@gmail.com.
Saraswati Sukumar, Email: saras@jhmi.edu.
John Fetting, Email: jfetting@jhmi.edu.
Pedram Argani, Email: pargani@jhmi.edu.
References
- 1.Gerlinger M, et al. Intratumor heterogeneity and branched evolution revealed by multiregion sequencing. N Engl J Med. 2012;366(10):883–892. doi: 10.1056/NEJMoa1113205. [DOI] [PMC free article] [PubMed] [Google Scholar]
- 2.Lawrence MS, et al. Mutational heterogeneity in cancer and the search for new cancer-associated genes. Nature. 2013;499(7457):214–218. doi: 10.1038/nature12213. [DOI] [PMC free article] [PubMed] [Google Scholar]
- 3.Makohon-Moore A, Iacobuzio-Donahue CA. Pancreatic cancer biology and genetics from an evolutionary perspective. Nat Rev Cancer. 2016;16(9):553–565. doi: 10.1038/nrc.2016.66. [DOI] [PMC free article] [PubMed] [Google Scholar]
- 4.Bertucci F, et al. Comparative genomic analysis of primary tumors and metastases in breast cancer. Oncotarget. 2016;7(19):27208–27219. doi: 10.18632/oncotarget.8349. [DOI] [PMC free article] [PubMed] [Google Scholar]
- 5.Hoadley KA, et al. Tumor evolution in two patients with basal-like breast cancer: A retrospective genomics study of multiple metastases. PLoS Med. 2016;13(12):e1002174. doi: 10.1371/journal.pmed.1002174. [DOI] [PMC free article] [PubMed] [Google Scholar]
- 6.Chu D, et al. ESR1 mutations in circulating plasma tumor DNA from metastatic breast cancer patients. Clin Cancer Res. 2016;22(4):993–999. doi: 10.1158/1078-0432.CCR-15-0943. [DOI] [PMC free article] [PubMed] [Google Scholar]
- 7.Toy W, et al. ESR1 ligand-binding domain mutations in hormone-resistant breast cancer. Nat Genet. 2013;45(12):1439–1445. doi: 10.1038/ng.2822. [DOI] [PMC free article] [PubMed] [Google Scholar]
- 8.Zhou Z, et al. MRI detection of breast cancer micrometastases with a fibronectin-targeting contrast agent. Nat Commun. 2015;6:7984. doi: 10.1038/ncomms8984. [DOI] [PMC free article] [PubMed] [Google Scholar]
- 9.Wu JM, et al. Heterogeneity of breast cancer metastases: comparison of therapeutic target expression and promoter methylation between primary tumors and their multifocal metastases. Clin Cancer Res. 2008;14(7):1938–1946. doi: 10.1158/1078-0432.CCR-07-4082. [DOI] [PMC free article] [PubMed] [Google Scholar]
- 10.Avigdor BE, et al. Whole-exome sequencing of metaplastic breast carcinoma indicates monoclonality with associated ductal carcinoma component. Clin Cancer Res. 2017;23(16):4875–4884. doi: 10.1158/1078-0432.CCR-17-0108. [DOI] [PMC free article] [PubMed] [Google Scholar]
- 11.Cingolani P, et al. Using Drosophila melanogaster as a model for genotoxic chemical mutational studies with a new program, SnpSift. Front Genet. 2012;3:35. doi: 10.3389/fgene.2012.00035. [DOI] [PMC free article] [PubMed] [Google Scholar]
- 12.Gustin JP, Cosgrove DP, Park BH. The PIK3CA gene as a mutated target for cancer therapy. Curr Cancer Drug Targets. 2008;8(8):733–740. doi: 10.2174/156800908786733504. [DOI] [PMC free article] [PubMed] [Google Scholar]
- 13.Robinson DR, et al. Activating ESR1 mutations in hormone-resistant metastatic breast cancer. Nat Genet. 2013;45(12):1446–1451. doi: 10.1038/ng.2823. [DOI] [PMC free article] [PubMed] [Google Scholar]
- 14.Nelson WJ. Regulation of cell-cell adhesion by the cadherin-catenin complex. Biochem Soc Trans. 2008;36(Pt 2):149–155. doi: 10.1042/BST0360149. [DOI] [PMC free article] [PubMed] [Google Scholar]
- 15.Arriola E, et al. Genomic analysis of the HER2/TOP2A amplicon in breast cancer and breast cancer cell lines. Lab Invest. 2008;88(5):491–503. doi: 10.1038/labinvest.2008.19. [DOI] [PubMed] [Google Scholar]
- 16.Roslan N, Bièche I, Bright RK, Lidereau R, Chen Y, Byrne JA. TPD52 represents a survival factor in ERBB2-amplified breast cancer cells. Mol Carcinog. 2014;53(10):807–819. doi: 10.1002/mc.22038. [DOI] [PubMed] [Google Scholar]
- 17.Krzywinski M, Birol I, Jones SJ, Marra MA. Hive plots--rational approach to visualizing networks. Brief Bioinformatics. 2012;13(5):627–644. doi: 10.1093/bib/bbr069. [DOI] [PubMed] [Google Scholar]
- 18.Ellis MJ, et al. Whole-genome analysis informs breast cancer response to aromatase inhibition. Nature. 2012;486(7403):353–360. doi: 10.1038/nature11143. [DOI] [PMC free article] [PubMed] [Google Scholar]
- 19.Lefebvre C, et al. Mutational profile of metastatic breast cancers: A retrospective analysis. PLoS Med. 2016;13(12):e1002201. doi: 10.1371/journal.pmed.1002201. [DOI] [PMC free article] [PubMed] [Google Scholar]
- 20.Croessmann S, et al. NDRG1 links p53 with proliferation-mediated centrosome homeostasis and genome stability. Proc Natl Acad Sci USA. 2015;112(37):11583–11588. doi: 10.1073/pnas.1503683112. [DOI] [PMC free article] [PubMed] [Google Scholar]
- 21.Shlien A, et al. Excessive genomic DNA copy number variation in the Li-Fraumeni cancer predisposition syndrome. Proc Natl Acad Sci USA. 2008;105(32):11264–11269. doi: 10.1073/pnas.0802970105. [DOI] [PMC free article] [PubMed] [Google Scholar]
- 22.Rausch T, et al. Genome sequencing of pediatric medulloblastoma links catastrophic DNA rearrangements with TP53 mutations. Cell. 2012;148(1-2):59–71. doi: 10.1016/j.cell.2011.12.013. [DOI] [PMC free article] [PubMed] [Google Scholar]
- 23.Gagan J, Van Allen EM. Next-generation sequencing to guide cancer therapy. Genome Med. 2015;7(1):80. doi: 10.1186/s13073-015-0203-x. [DOI] [PMC free article] [PubMed] [Google Scholar]
- 24.Brown D, et al. Phylogenetic analysis of metastatic progression in breast cancer using somatic mutations and copy number aberrations. Nat Commun. 2017;8:14944. doi: 10.1038/ncomms14944. [DOI] [PMC free article] [PubMed] [Google Scholar]
- 25.Li H, Durbin R. Fast and accurate short read alignment with Burrows-Wheeler transform. Bioinformatics. 2009;25(14):1754–1760. doi: 10.1093/bioinformatics/btp324. [DOI] [PMC free article] [PubMed] [Google Scholar]
- 26.Li H, et al. The sequence alignment/Map format and SAMtools. Bioinformatics. 2009;25(16):2078–2079. doi: 10.1093/bioinformatics/btp352. [DOI] [PMC free article] [PubMed] [Google Scholar]
- 27.Cibulskis K, et al. Sensitive detection of somatic point mutations in impure and heterogeneous cancer samples. Nat Biotechnol. 2013;31(3):213–219. doi: 10.1038/nbt.2514. [DOI] [PMC free article] [PubMed] [Google Scholar]
- 28.Tarasov A, Vilella AJ, Cuppen E, Nijman IJ, Prins P. Sambamba: fast processing of NGS alignment formats. Bioinformatics. 2015;31(12):2032–2034. doi: 10.1093/bioinformatics/btv098. [DOI] [PMC free article] [PubMed] [Google Scholar]
- 29.Sherry ST, et al. dbSNP: the NCBI database of genetic variation. Nucleic Acids Res. 2001;29(1):308–311. doi: 10.1093/nar/29.1.308. [DOI] [PMC free article] [PubMed] [Google Scholar]
- 30.Forbes SA, et al. COSMIC: somatic cancer genetics at high-resolution. Nucleic Acids Res. 2017;45(D1):D777–D783. doi: 10.1093/nar/gkw1121. [DOI] [PMC free article] [PubMed] [Google Scholar]
- 31.Lek M, et al. Analysis of protein-coding genetic variation in 60,706 humans. Nature. 2016;536(7616):285–291. doi: 10.1038/nature19057. [DOI] [PMC free article] [PubMed] [Google Scholar]
- 32. doi: 10.4161/fly.19695. Cingolani P, et al. A program for annotating and predicting the effects of single nucleotide polymorphisms, SnpEff: SNPs in the genome of Drosophila melanogaster strain w1118; iso-2; iso-3. Fly (Austin). 2012;6(2):80–92. [DOI] [PMC free article] [PubMed] [Google Scholar]
- 33.Talevich E, Shain AH, Botton T, Bastian BC. CNVkit: genome-wide copy number detection and visualization from targeted DNA sequencing. PLoS Comput Biol. 2016;12(4):e1004873. doi: 10.1371/journal.pcbi.1004873. [DOI] [PMC free article] [PubMed] [Google Scholar]
- 34. Hanson BA. HiveR: 2D and 3D Hive Plots for R. Depauw University. http://academic.depauw.edu/~hanson/HiveR/HiveR.html Updated January 29, 2017. Accessed December 4, 2017.
Associated Data
This section collects any data citations, data availability statements, or supplementary materials included in this article.


