
Figure 3. TRIB2 expression in Cisplatin-resistant SCLC cells.
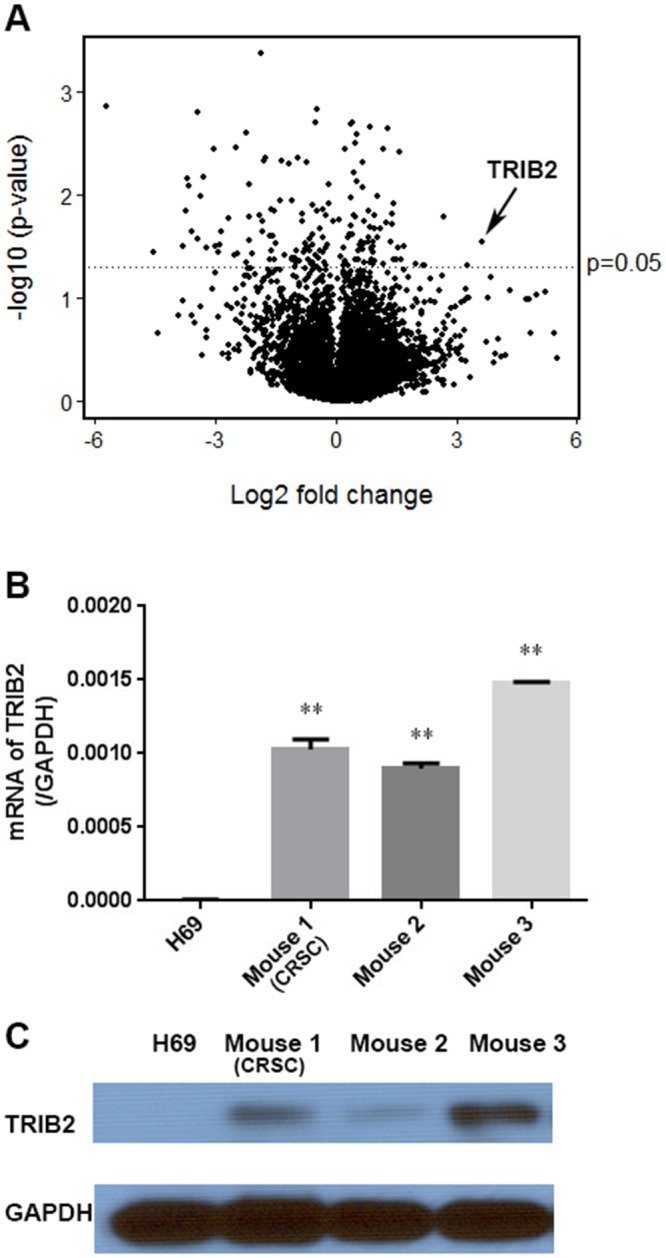
(A) Volcano plot showing the relationship between the statistical p-values and the gene expression change ratio of CRSC vs. H69 cells in microarray analysis. (B) TRIB2 mRNA expression in H69 cells and SCLC cells from the three Cisplatin-treated mice. (C) TRIB2 protein in H69 cells and SCLC cells from the Cisplatin-treated mice. (TRIB2 gene indicated with arrow. (**, P < 0.01 vs. H69).