

Abstract
Mitochondria are critical players involved in both cell life and death through multiple pathways. Structural integrity, metabolism and function of mitochondria are regulated by matrix volume due to physiological changes of ion homeostasis in cellular cytoplasm and mitochondria. Ca2+ and K+ presumably play a critical role in physiological and pathological swelling of mitochondria when increased uptake (influx)/decreased release (efflux) of these ions enhances osmotic pressure accompanied by high water accumulation in the matrix. Changes in the matrix volume in the physiological range have a stimulatory effect on electron transfer chain and oxidative phosphorylation to satisfy metabolic requirements of the cell. However, excessive matrix swelling associated with the sustained opening of mitochondrial permeability transition pores (PTP) and other PTP-independent mechanisms compromises mitochondrial function and integrity leading to cell death. The mechanisms of transition from reversible (physiological) to irreversible (pathological) swelling of mitochondria remain unknown. Mitochondrial swelling is involved in the pathogenesis of many human diseases such as neurodegenerative and cardiovascular diseases. Therefore, modeling analysis of the swelling process is important for understanding the mechanisms of cell dysfunction. This review attempts to describe the role of mitochondrial swelling in cell life and death and the main mechanisms involved in the maintenance of ion homeostasis and swelling. The review also summarizes and discusses different kinetic models and approaches that can be useful for the development of new models for better simulation and prediction of in vivo mitochondrial swelling.
Keywords: modeling analysis, mitochondria, matrix volume, ion transport, permeability transition pore, calcium
1. Introduction
Mitochondria are subcellular organelles that originated from primitive bacterial invasion of primordial eukaryotic cells (Sagan, 1967). Mitochondria are the powerhouse of the cell; ~90% of oxygen consumed by mammalian cells are used by mitochondria to produce ATP through oxidative phosphorylation (Rolfe and Brown, 1997). In addition to ATP production, mitochondria maintain a myriad of metabolic pathways such as ion homeostasis, cell growth, lipid oxidation and synthesis, and redox signaling. Mitochondria play a central role not only in cell life but also cell death (Balaban et al., 2005; O’Rourke et al., 1994; Tan et al., 1998). Due to their ability to store Ca2+ and respond to cytosolic Ca2+ signals, mitochondria together with endo(sarco)plasmic reticulum, participate in the regulation of intracellular Ca2+ homeostasis. Under normal conditions, mitochondrial Ca2+ (Ca2+m) regulates energy metabolism, whereas, at high concentrations, it stimulates mitochondria-mediated cell death pathways. Mitochondria respond to many different types of stress including oxidative and metabolic stresses. They are the main source of reactive oxygen species (ROS), a side product of respiration generated mainly at the electron transport chain (ETC) complexes I and III. Ca2+ overload along with high ROS and Pi, result in changes in mitochondrial membrane permeability and induces the opening of non-selective and high-conductance permeability transition pores (PTP) in the inner mitochondrial membrane (IMM). The PTP opening further compromises bioenergetics function and structural integrity of mitochondria leading to cell death (Halestrap et al., 1998; Petronilli et al., 2001; Rasola and Bernardi, 2011).
Importantly, under physiological conditions, the mitochondrial volume is regulated by ion fluxes, mainly by K+ and Ca+ fluxes across the IMM, (Garlid and Paucek, 2003; Szabo and Zoratti, 2014). Mild increases in matrix volume over the physiological range stimulate mitochondrial function and metabolism (Halestrap, 1989). Beneficial effects of matrix volume changes on mitochondrial metabolism and function may be due to structural and functional remodeling of the IMM, particularly, the fluidity of the membrane although precise mechanisms of these effects remain unknown.
Excessive mitochondrial swelling, which occurs mostly due to PTP opening, is a central player that can induce cell death through apoptosis or necrosis depending on availability of ATP. Notably, mitochondrial swelling is involved in the pathogenesis of many human diseases associated with oxidative stress such as ischemia (infarction)-reperfusion, hypoxia, inflammation and diabetes among others. Therefore, it is important to elucidate the mechanisms of mitochondrial swelling for understanding mitochondria-mediated cell death and development of new therapeutic strategies by targeting the mitochondrion. Regulation of the mitochondrial matrix volume may provide relief to stress, which would allow mitochondria to maintain their functional and morphological integrity (Kaasik et al., 2007); aiding in sustaining cellular life. As mentioned above, PTP opening induces mitochondrial swelling. However, inhibition of the PTP does not prevent mitochondrial swelling completely, suggesting a role of PTP-independent mechanisms are involved in the swelling (Eliseev et al., 2002; Gogvadze et al., 2004). The mechanisms of swelling are not clear, though ions, pHi, and membrane potential (ΔΨm) are the major players that regulate matrix swelling. Particularly, the concentration of K+ and Ca2+ across the IMM have been known to play a central role in creating the electrogenic transition leading to mitochondrial swelling (O’Rourke, 2007).
In this review, we discuss previous studies on the potential mechanisms of mitochondrial swelling as well as a variety of theoretical approaches to modeling mitochondrial swelling. Modeling analysis of mitochondrial swelling, particularly, the mechanisms of transition from physiological (reversible) to pathological (irreversible) swelling is important for understanding mitochondria-mediated cell death and organ/tissue dysfunction in human diseases.
2. Mitochondrial swelling: causes and consequences
Mitochondrial swelling begins with changes in ion homeostasis of the matrix, which induces an osmotic imbalance between the cytosol and the matrix. As a result, increased colloidal osmotic pressure enhances the water influx leading to matrix swelling. Notably, changes in matrix volume have an important role in regulating mitochondrial function and metabolism under physiological conditions. However, an extensive increase of the matrix volume or matrix swelling compromises mitochondrial function and initiates mitochondria-mediated cell death. Main transport mechanisms that regulate ion homeostasis and matrix volume in mitochondria are shown in Figure 1.
Figure 1. Main ion flux mechanisms that regulate ion homeostasis and matrix volume in mitochondria.
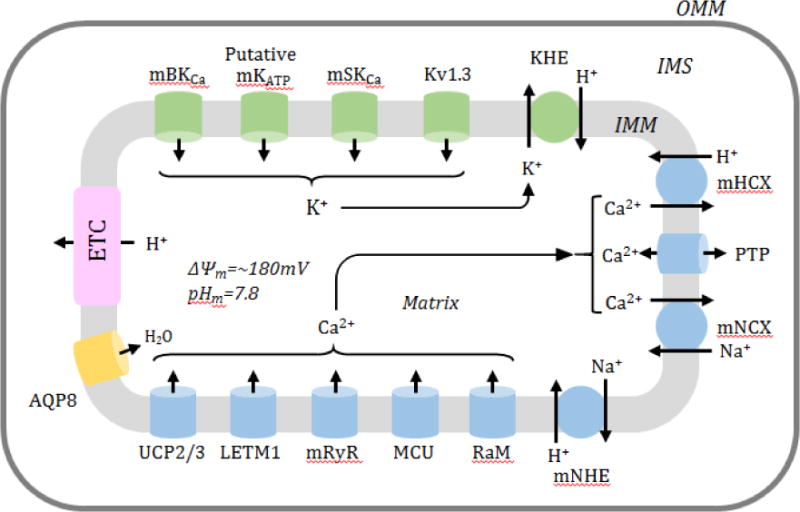
A schematic diagram represents the main Ca2+ (blue) and K+ (green) influx and efflux mechanisms that regulate the mitochondrial volume. Main Ca2+ influx mechanisms include the mitochondrial Ca2+ uniporter (MCU), rapid mode of Ca2+ uptake (RaM), mitochondrial ryanodine receptor (mRyR), leucine zipper-EF-hand-containing transmembrane protein 1 (LETM1) and uncoupling proteins 2 and 3 (UCP2/3). Ca2+ efflux mechanisms are important for balancing of Ca2+ as well as ion homeostasis in the matrix, and include Na+/Ca2+ exchange (mNCX), H+/Ca2+ exchange (mHCX) and mitochondrial permeability transition pore (PTP). Transport of K+ is equally important for mitochondrial metabolism and function and changes in K+ correlate with changes in matrix volume. K+ influx mechanisms include the mitochondrial Ca2+ regulated K+ large conductance channel (mBKCa), mitochondrial ATP activated K+ channel (mKATP), mitochondrial small-conductance Ca2+-activated potassium channel (mSKCa), and a voltage-activated K+ channel of the Kv1.3 type (mKv1.3), whereas K+ efflux mechanisms are limited to the K+/H+ exchanger (KHE). Additionally, the mitochondrial Na+/H+ exchanger (mNHE) and aquaporin 8 (AQP8) have been included in the regulation of ion homeostasis in mitochondria.
2.1. Physiological role of changes in matrix volume
2.1.1. Role of K+ and Ca2+ fluxes
Under physiological conditions, mitochondria maintain the matrix volume within a narrow range through the regulation of influx/efflux mechanisms for ions across the IMM. One of the main mechanisms regulating the matrix volume in unstressed mitochondria includes the movement of K+ in or out of the matrix (reviewed in (Garlid and Paucek, 2003; Halestrap, 1994)). In 1986, Halestrap et al (Halestrap et al., 1986) found that Ca2+ stimulated an energy dependent K+ uptake that provoked a swelling response in rat liver mitochondria. Under physiological conditions, K+-dependent Ca2+ influx induces an increase in matrix volume (Halestrap et al., 1986). Although the precise role of PTP in physiological swelling remains unclear (Mnatsakanyan et al., 2017), under pathophysiological conditions (e.g. oxidative stress), the PTP presumably stimulates a shift in osmotic pressure that leads to matrix swelling.
The main K+ influx mechanisms are the mitochondrial Ca2+ regulated K+ large conductance channel (mBKCa), a voltage-activated K+ channel of the Kv1.3 type (mKv1.3) and mitochondrial ATP activated K+ channels (mKATP). The K+/H+ exchanger (KHE) is responsible for K+ efflux from the matrix. Opening of the mBKCa increases the permeability of the IMM to K+ and which, in turn, decreases the mitochondrial Ca2+ buffering capacity due to membrane depolarization. The latter reduces the driving force for mitochondrial Ca2+ uptake and thereby, prevents Ca2+ overload (Giorgi et al., 2012). In favor of this, K+ influx mediated by the mBKCa improved respiratory function of mitochondria (Aon et al., 2010; Heinen et al., 2007a, 2007b). The beneficial effects of increased K+ influx on respiratory function were dependent on mitochondrial swelling with maintained ΔΨm(Aon et al., 2010). On the other hand, increased matrix K+ influx due to stimulation of mBKCa increased the ETC activity and mitochondrial respiration without altering ΔΨm (Heinen et al., 2007a, 2007b). The K+ entry into the matrix occurs mostly through the electrogenic putative mKATP channel, whereas K+ efflux mediated by KHE equilibrates the osmotic pressure across the IMM (Diwan, 1987). Hence, activation of the putative mKATP channel facilitates K+ influx and increases the matrix volume whereas stimulation of the K+ efflux through the KHE, in contrast, decreases the volume (Garlid, 1980). A myriad of intra- and extra-mitochondrial factors are involved in the regulation of the balance between K+ influx and efflux mechanisms in order to maintain matrix volume homeostasis. The molecular identities of the putative mKATP and the KHE have not been established. The mKv1.3 was initially discovered in mitochondria of lymphocytes (Szabo et al., 2005). Later, it was identified in the IMM of different cells, where, similar to other K+ channels, it likely participate in regulation of ΔΨm, matrix volume and ion homeostasis (Reviewed in (Szabo and Zoratti, 2014). A precise role of mKv1.3 under physiological conditions is not clear, however it plays a critical role in apoptosis, since knockout of the channel prevents apoptotic cell death (Bock et al., 2002). Also, a mitochondrial small-conductance Ca2+-activated K+ channel (mSKCa) was identified in the IMM of guinea pig (Stowe et al., 2013), rat and human (Yang et al., 2017) cardiomyocytes by using both biochemical and molecular biology techniques. Pharmacologically induced opening of the mSKCa prevented mitochondrial dysfunction and protected against cardiac ischemia-reperfusion injury (Stowe et al., 2013) and glutamate-induced oxytosis (Dolga et al., 2013).
In addition to K+, Ca2+ is involved in the regulation of mitochondrial ion homeostasis and matrix swelling. Mitochondria are known to play a vital role in buffering cytosolic and mitochondrial Ca2+ (Hoppe, 2010; Rizzuto et al., 2012). Mitochondrial Ca2+ signaling regulates metabolism and function of mitochondria providing a crosstalk between changes in matrix volume and Ca2+ influx/efflux mechanisms. Minute augmentations of Ca2+m may induce a tiny swelling of the matrix accompanied by upregulation of ETC activity and oxidative phosphorylation. Adversely, once Ca2+m reaches a critical threshold it triggers a pathological swelling effect caused by mitochondrial PTP opening (Szabo and Zoratti, 2014).
The main Ca2+ influx mechanisms include the mitochondrial Ca2+ uniporter (MCU), rapid mode of Ca2+ uptake (RaM) and mitochondrial ryanodine receptor (mRyR). The MCU is the main Ca2+ uptake channel, which is heavily dependent on the ΔΨm. Its activity is controlled by the mitochondrial Ca2+ uptake 1 (MICU1) protein, an essential regulator of Ca2+ uptake that prevents Ca2+ overload in mitochondria (Patron et al., 2013). Studies with genetic ablation of the MCU revealed its important role in Ca2+m accumulation suggesting that the Ca2+-induced PTP opening occurs due to MCU activation (Pan et al., 2013). Another mechanism regulating Ca2+m is the RaM. The optimal rate of Ca2+ uptake through the RaM mechanism is greater than the MCU at low Ca2+ and the rate declines with increasing Ca2+m (Santo-Domingo and Demaurex, 2010). Also, a Ca2+ influx in mitochondria is regulated by the mRyR. The role of RyR in Ca2+-induced Ca2+ release (CICR) within the endo(sarco)plasmic reticulum has been known for a long time, and discovery of the mRyR in 2001 (Beutner et al., 2001) opened new perspectives in the understanding of Ca2+ metabolism in mitochondria. Unlike the RyR, mRyR acts as a Ca2+ influx transporter allowing rapid sequestration of Ca2+ at low concentrations. The mRyR is inhibited at high Ca2+ concentration suggesting that it plays a physiological role in fast Ca2+ dynamics (Beutner et al., 2005). Since the RAM and mRyR have either a slow resetting time and/or are inhibited by high Ca2+, they have no significant effects on swelling.
The mitochondrial Na+/Ca2+ exchanger (mNCX), H+/Ca2+ exchanger (mHCX) and PTP are the main mitochondrial Ca2+ efflux mechanisms (Szabo and Zoratti, 2014). The mNCX is a highly selective Ca2+ efflux exchanger, which is regulated by Na+, K+, cytosolic Ca2+, and ΔΨm. It has been extensively debated whether the mNCX plays the role of an electrogenic or electroneutral channel, however an analysis of the mNCX in cardiac mitochondria has provided an evidence that the mNCX sustains a stoichiometry of 3 Na+:1 Ca2+ (Dash and Beard, 2008). However, later the same group demonstrated that the mNCX may undergo the transition from an electrogenic to an electroneutral state in a later publication (Blomeyer et al., 2013). The mNCX has been shown to function in a reverse mode under certain conditions that include the hyperpolarization of the mitochondria (Kim and Matsuoka, 2008; Smets et al., 2004). Although a vast amount of information about the function of the mNCX is known, its molecular identity has yet to be discovered (Castaldo et al., 2009). The NHE isoform 1 (mNHE) first identified in cardiac mitochondria (Javadov et al., 2011) has been shown to play a key role in Ca2+-induced mitochondrial swelling and PTP opening (Villa-Abrille et al., 2011). It regulates the mNCX activity by providing the Na+ efflux needed to maintain the concentration gradient of ions across the IMM.
The mHCX is known for its electroneutral capability to exchange 2 H+ (out) for 1 Ca2+ (in). It is activated by the Ca2+ gradient allowing it to pump H+ against the proton gradient. It should be noted that the exchanger can function in a reverse mode at high Ca2+m (Tsai et al., 2014). In addition, this study identified mHCX to be insensitive to ruthenium red and have an approximate Km of 25 μM. In recent knockout experiments, the mHCX has been identified as part of the leucine zipper-EF-hand-containing transmembrane protein 1 (LETM1) family, though the molecular identity of the transporter remains unknown (Jiang et al., 2009). When compared to the mNCX, it was found that the LETM1 (mHCX) did not play a significant role in extrusion of Ca2+, thus undermining its function in Ca2+ efflux (De Marchi et al., 2014). In addition, genetic studies (Graier et al., 2008; Trenker et al., 2007) demonstrated that uncoupling proteins (UCPs) 2 and 3 are important for mitochondrial Ca2+ uptake. However, mechanisms underlying the Ca2+ regulatory role of the UCPs remain to be elucidated. In addition to ion channels and transporters, aquaporins (AQP), the membrane proteins that transfer water across the membrane, can also contribute to mitochondrial swelling. The AQP8 found in the IMM was suggested to play an important role for rapid expansions of matrix volume and thus, regulate the activity of ETC complexes (complex IV) and oxidative phosphorylation (F0F1-ATP-synthase) (Calamita et al., 2005). However, it remains unclear whether AQP8 is present in all mitochondria and whether it, in addition to regulation of osmosis in the mitochondrial matrix, participates in the transport of other molecules across the IMM (Lee and Thevenod, 2006).
2.1.2. Role of transient PTP opening
Growing body of studies demonstrate that the matrix volume can also be regulated through a low-conductance PTP opening, which makes the IMM permeable to solutes, mostly ions, with molecular weight less than 300 Da. PTP flickering in a low-conductance mode, induces negligible matrix swelling (Ichas and Mazat, 1998). Inhibition of cyclophilin D (CypD), a major PTP inhibitor, prevented the Ca2+-induced swelling in liver mitochondria (Davidson and Halestrap, 1990) presumably due to normalization of Ca2+ levels in the matrix (Altschuld et al., 1992; Bernardi and Petronilli, 1996). Mice lacking CypD exhibited elevated levels of matrix Ca2+ presumably due to reduced physiological opening of the PTP (Elrod et al., 2010). Repetitive gating of the PTP can induce fluctuations in ΔΨm and the fast release of accumulated Ca2+ from the matrix thus serving as an emergency mechanism to regulate Ca2+ homeostasis and function of mitochondria (Huser and Blatter, 1999). In addition, mitochondria are excitable organelles that generate and convey electrical and Ca2+ signals, hence a low-conductance PTP opening can initiate mitochondrial depolarization spikes and generate Ca2+ waves through CICR from one mitochondrion to another (Ichas et al., 1997). Physiological role of PTP opening has been reviewed elsewhere (Brenner and Moulin, 2012; Javadov et al., 2017).
Thus, under physiological condition, the mitochondrial volume is regulated by ion fluxes through the IMM, mainly by the K+ and Ca2+ fluxes. Mild increases in matrix volume over the physiological range have been shown to stimulate mitochondrial function and metabolism. Particularly, an increase in matrix volume stimulated fatty acid oxidation associated with increased ETC activity and oxidative phosphorylation in rat liver mitochondria (Halestrap and Dunlop, 1986). Furthermore, increased mitochondrial volume may stimulate gluconeogenesis through stimulation of pyruvate carboxylase (Owen and Halestrap, 1993). We found that ischemic preconditioning, when the heart is exposed to brief periods (3–5 min) of ischemia followed by reperfusion, increased the matrix volume of cardiac mitochondria and stimulated their respiratory function (Lim et al., 2002). This study suggests that increased matrix volume may represent an important adaptive response to protect the mitochondria against severe oxidative stress. The molecular mechanisms underlying the beneficial effects of mild mitochondrial swelling on mitochondrial metabolism remain unknown. An increase in matrix volume can expand the IMM and thus, affect the fluidity of the membrane and stimulate ETC activity (Halestrap, 1989). In favor of this, previous studies demonstrated the dependence of the ETC activity on changes in the IMM fluidity (Armston et al., 1982; Okayasu et al., 1985). In addition, volume-induced changes in the IMM fluidity can affect the activity of ion channels and other transporters in the inner membrane and thus, regulate mitochondrial function and metabolism.
2.1.3. Mitochondrial flash activity: potential target for matrix volume changes
In addition to mitochondrial dynamics, changes in mitochondrial volume can affect the mitochondrial flash activity. The mitochondrial flashes reflect integrated snapshots that occur as transient and stochastic events in individual mitochondrion. They involve transient concurrent changes in superoxide generation, pH, and ΔΨm, and associated with the ETC activity and transient PTP opening (Wang et al., 2008). Mitochondrial flashes integrate the signals of ROS, pH, ΔΨm, and Ca2+ in individual mitochondrion, and thus, serve as a biomarker for mitochondrial activity under physiological and pathological conditions (Reviewed in (Wang et al., 2016). Interestingly, transient PTP openings play a causative role in triggering mitochondrial flashes since inhibition of CyP-D prevented mitochondrial flashes in cardiomyocytes (Gong et al., 2015; Shang et al., 2016). Since PTP opening (transient or permanent) affect the matrix volume, we can suggest a potential link between volume changes and flash activity of individual mitochondria. Interestingly, most recent studies demonstrated L-OPA1 regulates mitochondrial flash biogenesis by regulation of pH/ΔΨm coupling independently from membrane fusion (Rosselin et al., 2017). The authors proposed that OPA1 stabilizes structure of ETC supercomplexes which, in turn, enables mitochondria compensate a drop in ΔΨm by a matrix pH flash. In addition, PTP opening plays a causal role in disassembling of ETC supercomplexes in response to oxidative stress (Jang et al., 2016). Further studies are required for clarification of the cause-effect relationship between volume changes, cristae remodeling and flash activity in mitochondria.
2.1.4. Cristae remodeling and mitochondrial function
It should be noted, that there is a crosstalk between structural integrity of the IMM, particularly cristae ultrastructure, and functional activity of the membrane (Reviewed in (Mannella, 2006; Quintana-Cabrera et al., 2017; Rampelt et al., 2017). Cristae are the IMM invaginations (curvature) connected through tubular and narrow junctions, known as cristae junctions, to the boundary membrane (Frey and Mannella, 2000). Increases in matrix volume can affect dimensions (mainly, width) of the cristae junction and cristae lumen, and thus, stimulate: 1) functional association between ETC complexes (supercomplexes), and oxidative phosphorylation (Cogliati et al., 2013), 2) functional activity of membrane transporters, including ion exchangers and channels, and thereby, providing a regulatory crosstalk between ion influx and matrix swelling (Garlid, 1996; O’Rourke et al., 2005), 3) structural organization of cardiolipin, the main phospholipid which is localized in the inner leaflet of the IMM and plays a crucial role in maintaining of membrane proteins (Paradies et al., 2014), 4) release of cytochrome c, which can trigger apoptosis under pathological conditions (Scorrano et al., 2002), and 5) diffusion of proteins/metabolites across the IMM to the intermembrane space (IMS) (Frezza et al., 2006). Notably, cristae remodeling can affect the IMM architecture and dynamics without significant changes in mitochondrial volume (Rampelt et al., 2017). In addition to the matrix, physical interactions with the OMM apparently play a major role in maintenance of the IMM shape.
Topology of the IMM is also regulated by “mitochondria-shaping” proteins known as fission and fusion proteins (Reviewed in (Liesa et al., 2009), and changes in matrix volume can induce cristae remodeling through changes in mitochondrial dynamics. From all fission and fusion proteins only optic atrophy 1 (OPA1) is bound to the IMM and plays an essential role in fusion (Cipolat et al., 2004). Genetic ablation of OPA1 induces cristae remodeling and apoptosis independently on the fusion (Frezza et al., 2006). Conversely, overexpression of OPA1 prevented cytochrome c release and kept the cristae junctions tight during apoptosis suggesting a distinct function of the OPA1 in cristae remodeling (Frezza et al., 2006). OPA1 has been shown to regulate mitochondrial function, and assembly and stability of ETC supercomplexes through cristae remodeling (Cogliati et al., 2013). Overall, these studies provide evidence on the existence of tight relationship between mitochondrial function/metabolism and cristae shape, which can be modulated by volume changes.
2.2. Pathological swelling of mitochondria: key event that leads to cell death
Matrix swelling develops due to the formation of an osmotic pressure that transports water into the matrix causing morphologic and functional changes in mitochondria. Osmotic pressure across the IMM is generated by changes in the concentration of solutes, mainly ions, which increase the osmotic pressure on the IMM (Nowikovsky et al., 2009). Since the IMM is highly selective with low permeability to ions, changes in ionic concentration may occur by the following 3 ways to induce mitochondrial swelling: 1) high concentration of ions in the cytoplasm, 2) dysfunction of ion transport associated with increased rate of ion influx and decreased rate of ion efflux across the IMM, and 3) an increase in permeability of the IMM. Changes in mitochondrial volume occurs in response to oxidative and energy stresses in the cell. Under these conditions, an increase in cytosolic Ca2+ and decrease in pH are the main factors that stimulate mitochondrial Ca2+ buffering activity (Reviewed in (Bernardi and Di Lisa, 2015; Halestrap et al., 2004). Considering that the PTP should not open under a low pHm (Bernardi et al., 1992), Ca2+m may play an important role in inducing an osmotic drive towards the matrix resulting in mitochondrial swelling. Alterations in ion transport mechanisms in mitochondria have been known to play a crucial role in matrix volume regulation. Wolf-Hirschhorn syndrome is an ideal example of a dysfunctional mitochondrial transporter leading to changes in matrix volume (Nowikovsky et al., 2009). The disease induced by a mutation in the LETM1 gene, which codes the mitochondrial KHE, is associated with swelling of mitochondria due to the retention of higher K+ levels. In addition, increased IMM permeability was associated with mitochondrial dysfunction as evidenced by ΔΨm loss and ATP depletion (Nowikovsky et al., 2009).
A critical event that initiates mitochondria-mediated cell death is the excessive swelling of the mitochondrial matrix that occurs due to irreversible (high-conductance) PTP opening. PTP-induced cell death is involved in the pathogenesis of ischemia/reperfusion injury of different organs especially, heart and brain (Bernardi and Di Lisa, 2015; Halestrap et al., 2004; Kristian and Siesjo, 1998). During sustained opening of the PTP mitochondria become uncoupled and F0F1-ATP synthase (ETC complex V) works in a reverse mode that instead of producing ATP, hydrolyzes it. PTP opening allows entrance of water, ions and other solutes with a molecular weight less than 1500 Da into the matrix and thus, alters ion homeostasis in the mitochondrial matrix due to equilibration of the solutes on both sides of the IMM. However, mitochondrial proteins retain in the matrix that, together with high ion levels, increase the colloidal osmotic pressure leading to matrix swelling. Since the surface area of the IMM is significantly larger than the outer mitochondrial membrane (OMM), matrix swelling induces the rupture of the OMM in the presence of a relatively intact IMM. The rupture of the OMM facilitates the release of pro-apoptotic proteins such as cytochrome c, Smac/Diablo, apoptosis inducing factor, endonuclease G from the IMS to the cytosol thus initiating apoptotic death pathways. Under severe stress when cells have insufficient ATP to complete the apoptotic process, cell death occurs through necrosis.
Thus, excessive mitochondrial swelling plays a causative role and therefore, it is important to provide mathematical modeling and kinetic analysis of mechanisms underlying the transition from reversible swelling to irreversible swelling. Proposed steps and consequences of mitochondrial swelling are illustrated in Figure 2. Understanding these mechanisms can be helpful for the development of new potential therapeutic approaches to target mitochondrial swelling and prevent cell death.
Figure 2. Proposed steps and consequences of mitochondrial swelling.
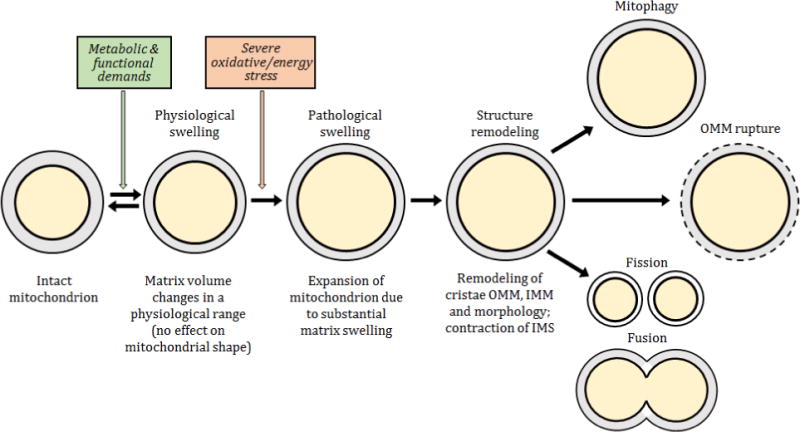
Mitochondria are dynamic organelles that are constantly adapting to changes in the environment. Increased cellular energy demands induces slight swelling of the mitochondrial matrix that stimulates ETC activity and oxidative phosphorylation. However, severe energy or oxidative stress provokes a transition of mitochondria from a functional to a dysfunctional metabolic state accompanied by pathological swelling. Consequently, in response to matrix swelling, structural remodeling of mitochondria that results in the following consequences including mitophagy, rupture of the OMM and/or mitochondrial fusion and fission
3. Methods for measurement of mitochondrial volume
Elucidating of molecular mechanisms of mitochondrial structure and metabolism under physiological and pathological conditions requires an accurate estimate of the mitochondria, particularly, matrix volume. Unfortunately, methods for measurement of mitochondrial volume in situ (in intact organs or tissue) are not available. The main method widely used for estimation of the mitochondrial volume is based on the measurement of absorbance (optical depth) in isolated mitochondria. The amount of light scattered by mitochondria depends on the matrix volume, where a decrease of absorbance is proportional to an increase of mitochondrial volume (Tedeschi and Harris, 1958). Although the term of “absorption” is broadly used in mitochondria studies, actual light absorption capacity of mitochondria is unknown. Instead of that, a light scattering effect that creates a decrease of sample light transmission spectrum is determined. Light scattering induced by matrix swelling decreases the light transmission spectrum. In other words, matrix swelling changes the refraction coefficient, decreases the scattering efficiency and increases the light transmission properties of the mitochondria. Since pathological swelling of mitochondria leads to PTP opening and Ca2+ release, measurement of the CICR can reflect the extent of swelling (Selivanov et al., 1998). However, both techniques have several disadvantages. For example, these techniques can be used only on isolated mitochondria, which do not reflect in vivo/in situ behavior of mitochondria in cell/tissue. In addition, isolation procedure per se that includes several steps of centrifugation in sucrose medium can affect morphology and shape of mitochondria leading to misestimation of real volume changes.
An accurate method was developed for measurement of the mitochondrial volume in cultured liver cells without cell disruption using 3H2O and [14C]-mannitol (Quinlan et al., 1983). In this approach, mannitol was used as an extramitochondrial marker and matrix volume was determined in situ based on the H2O to mannitol ratio. Importantly, values of mitochondrial volumes measured using3H2O and [14C]-mannitol in intact cells (Quinlan et al., 1983) were similar to those found in isolated mitochondria (Halestrap and Quinlan, 1983) (0.40 and 0.46 μl/mg of mitochondrial protein, respectively). A similar technique based on the intra- and extramitochondrial distribution of 3H2O and [14C]-sucrose was used for measurement of the matrix volume changes in isolated mitochondria (Lim et al., 2002). This method is more precise than the light scattering technique. In favor of this, conformational changes in the ANT induced by inhibitors (e.g. carboxyatractyloside and bongkrekic acid) cause distinct changes in absorbance and affect light scattering of mitochondria without any changes in matrix volume (Das et al., 2003; Klingenberg et al., 1971).
Microscopy techniques are used for the measurement of the mitochondrial volume in intact cells (fluorescent/confocal microscopy) and fixed cell/tissue samples (electron microscopy). However, these techniques also have a number of limitations in estimation of actual volume of mitochondria. For example, main disadvantages of confocal/light microscopy include low resolution, negative effect of light intensity (laser power, filters) on image quality, and diffraction limits. The mitochondrial uptake of the majority of fluorescent probes and potentiometric dyes depends on the ΔΨm and thus, can affect actual fluorescent imaging of mitochondria. This problem has been partially solved by using a variety of fluorescent proteins such as the green fluorescent protein (GFP), for in vivo imaging and estimation, among other parameters, the size/number of mitochondria (Chudakov et al., 2005; Rizzuto et al., 1995). Furthermore, to overcome the diffraction limits in optical microscopy, new fluorescence microscopies with super-resolution that allow imaging on a nanometer levels have been recently developed (Huang et al., 2009; Patterson et al., 2010). The artifacts due to sample preparation (fixation) and the study of non-functional cells are the drawbacks for electron microscopy. New electron microscopy technologies significantly improved quality of imaging and provide more detailed information about structure/volume changes of mitochondria. High-resolution scanning electron microscopy and electron tomography are able to provide 3D imaging of mitochondria where changes in morphology can be seen at molecular levels (Mannella, 2006; Perkins et al., 1997). In addition, cryo-electron microscopy and cryo-electron tomography are used to examine the interior architecture of mitochondria including structural composition of multiprotein complexes, cristae structure, shape modeling and other structural and molecular features at very high (nanoscale) resolution (Bartesaghi and Subramaniam, 2009; Letts et al., 2016). Also, the artefacts induced by sample processing such as chemical fixation, dehydration, and staining are excluded in these techniques.
Thus, several methods are available for quantitative analysis of volume changes in mitochondria in vitro. Lack of techniques for in situ measurement of the mitochondrial volume is the main obstacle in this area. Although electron microscopy is highly effective for the elucidation of ultrastructural and molecular changes, it cannot provide information of actual changes of the mitochondrial volume. If we assume that the mitochondrion has a sphere shape, a 25% increase in matrix volume would produce only a 3% increase in diameter of mitochondria based on cubic relationship between the volume and diameter. Also, changes in the IMS, and cristae remodeling may increase mitochondria diameter without changes in matrix volume (Frey et al., 2002). Nevertheless, the microscopy techniques alone or in combination with other methods provide information on the changes in the shape, cristae morphology and matrix volume of mitochondria under both physiological and pathological conditions.
4. Modeling of mitochondria swelling dynamics
4.1. General view of different modeling approaches
The development of an adequate modeling analysis for biological systems is essential for understanding and predicting a system behavior under different conditions. Modeling of the mitochondrial swelling process is based on the following two conceptually different types of approaches. The first approach develops the biological dynamics and fitting (kinetics) models, which consist of modeling kinetic schemes of the mitochondrial swelling process and approximating the simulation to experimental results. This includes the use of the law of mass action and dividing the mitochondria into un-swollen, semi-swollen, and fully swollen fractions while averaging their volume. Typically, the volume obtained by averaging the mitochondrial swelling fractions are converted to absorbance values to fit experimental data. The second approach is applied to develop the biophysical model, which takes into consideration the flux of one or more ions, changes in ΔΨm, mitochondrial respiration rates, and hydrodynamic flux across the IMM. This approach can be further divided into 2 groups: a) individual approach, which includes the detailed development of one transport mechanism, and b) holistic approach, which develops modeling based on two or more transport mechanisms. Main mechanisms involved in mitochondrial swelling are shown in Figure 3.
Figure 3. Main mechanisms for mitochondrial matrix swelling.
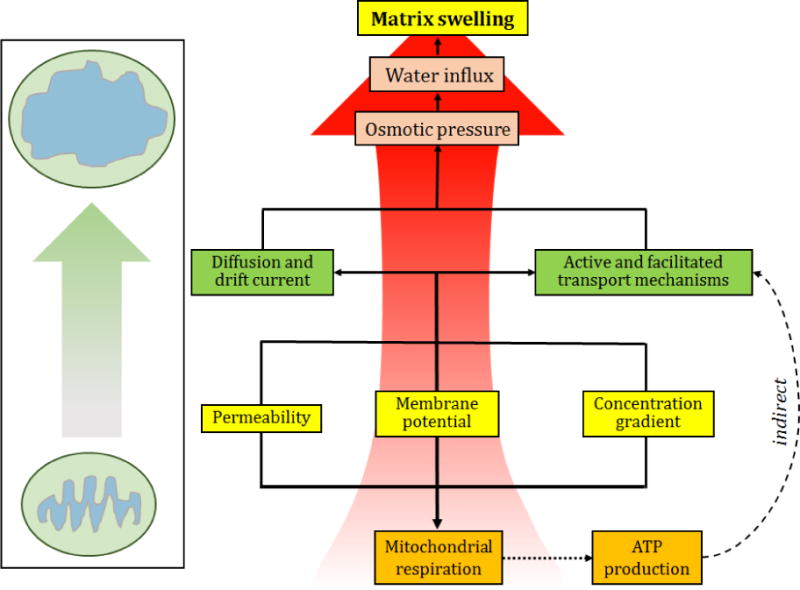
Changes in the ΔΨm and ion concentration gradient can affect the ion transport through the IMM. ATP production capacity as well as signalling pathways regulating ion channels/transporters can be involved in maintaining ion homeostasis/matrix volume. As a result, an imbalance in ionic transport mechanisms or diffusion process can cause changes of osmotic pressure in the matrix. Increased osmotic pressure can induce matrix swelling due to increased net water influx.
4.2. Biological dynamics and fitting models
Biological dynamics and fitting models simplify the analysis of swelling dynamics by ignoring the details of the biophysical and biochemical processes in living systems including mitochondria. Initially, a relationship between light scattering and matrix volume had to be developed before such fitting models could be created. The preliminary attempts to describe this relation were based on a linear relationship between absorbance and mitochondrial volume. However, the linear equation was only capable of describing the end portion of the nonlinear absorbance change that the data produced (Beavis et al., 1985; Tedeschi and Harris, 1955). The equation was further improved with the addition of a logarithmic relationship between the absorbance and volume change which was better capable of imitating the experimental absorption data (Massari, 1996). This kinetic model of mitochondrial swelling described the effects of different concentrations of PTP-inducers on the diameter and number of the pores The approach included a first order differential equation that described reversible Ca2+-induced permeabilization including the transition of non-swollen mitochondria to swollen mitochondria and vice versa as described before (Al-Nasser and Crompton, 1986). These populations were typically represented as a mitochondrial fraction that refers to the portion of the mitochondrial population found at a given transitional state such as un-swollen, swelling, or final swollen state. The mitochondrial fraction is assigned a given volume and the average of the total volumes assigned to the mitochondrial fractions would then be calculated. In the following study, the average volume of the total mitochondrial population only took into consideration the transition from the un-swollen to final swollen state. A logarithmic relationship between matrix volume and absorbance changes was developed to allow the model to be fitted to experimental data (Massari, 1996). The model was utilized to describe both the swelling pattern and complete swelling effect on the mitochondrial population provoked by Ca2+ and phenylarsine oxide (a PTP inducer). The model was capable of fitting the tail or ending portion of the experimental absorbance data, though it failed to replicate the initial portion. The authors stated that a linear kinetics could be expected with a stable membrane potential and in the absence of Ca2+ net movement suggesting that the model could be further improved. Increasing the complexity of the model to a second order relation could improve the fitting quality of the model.
Baranov et al. (Baranov et al., 2008) proposed a model, which was able to properly simulate the PTP-induced swelling process. The authors attempted to capture the Ca2+ autolytic activity from its reuptake upon PTP-induced Ca2+ release. In comparison with previous studies (Massari, 1996), the model was significantly improved by the addition of a lag phase. The latter allowed the model to be fitted to the swelling effects induced by Ca2+ at lower concentrations (1–20 μM). Additionally, it proved to be more practical because of its capability to distinguish the different mechanisms by which Mg2+ and Ru-360 inhibited Ca2+ uptake. However, the model did not take into account the changes in ΔΨm, that can alter Ca2+ uptake rates and additional ion transport mechanisms and thus, modulate the swelling process. The authors described mitochondrial Ca2+ uptake by a set of processes including a modified kinetic rate, which regulates the Ca2+ uptake dynamics. However, all kinetic processes included in the study were considered as irreversible. This limitation allows for the production of a simulation with acceptable accuracy for only the middle part of the experimental swelling curves or the portion of the absorbance data where swelling occurs. However, it does not precisely fit the “tail” of the swelling dynamics (Baranov et al., 2008). In addition, although parameter variations were tested and discussed for inducers and inhibitors of Ca2+ uptake, the effects of Ca2+-induced mitochondrial swelling at higher concentration (> 20 μM) were not studied in the model.
Ca2+ induced mitochondrial swelling was taken into account in the model developed by Eisenhofer et al. (Eisenhofer et al., 2010). The approach developed in this model is an extension of the aforementioned kinetic model (Massari, 1996). The mitochondrial fraction differential equation was extended from a first to second order differential equation including additional parameters. The parameters included a positive feedback within the swelling process (a), background swelling coefficient (b), a mean mitochondrial volume (k), and an average swelling time for a single mitochondrion to swell (τ). This equation was then applied to a secondary equation, which would calculate the average volume at a certain time point of the swelling process. At this time point, all mitochondria are divided into 3 states: un-swollen, swelling, and swollen states. This model introduced a set of variable-parameters that were adapted to changes in Ca2+ levels, thus allowing the prediction of the dynamics of swelling. The relationship between the averaged mitochondrial volume and time of swelling was determined by introducing the τ (Eisenhofer et al., 2010). This approach can be successively applied to fit experimental data of mitochondrial swelling, since it reveals a positive feedback behavior of mitochondrial swelling, and allows for analyses of the effects of swelling inducers and inhibitors. However, the model does not have clear biophysical basis as well as it does not include Ca2+ uptake in mitochondria (Eisenhofer et al., 2010). Therefore, the proposed approach can be considered as an abstract mathematical approach of the description of swelling process in mitochondria.
In conclusion, the biological dynamics and fitting models are based on a simpler approach that can be easily adopted to other systems/cells. Although the approach is limited due to a lack of consideration of the many factors that may affect swelling, it is promising in providing information about kinetic rates, pharmacological inhibition, and volume changes of swelling mitochondria. An extension of this type of modeling, including additional swelling factors, could better simulate in vivo mitochondrial swelling. However, it would vastly increase the complexity of the model.
4.3. Biophysical model
A biophysical model of the mitochondrial swelling process typically takes into account several processes in mitochondria such as mitochondrial respiration, ion transport, and membrane depolarization among others. Modeling of each of these processes creates sets of nonlinear differential equations, a solution of which is dependent on variable parameters related to the systems original and boundary conditions (e.g. Ca2+m, pHm, ΔΨm).
4.3.1. Individual approach
In contrast to the holistic approaches that evaluates the interaction between different mechanisms, individual approaches are applied to describe the contribution of an individual transporter to the ionic homeostasis and thus, mitochondrial swelling. Additionally, this approach can describe the characteristics of transporters under different conditions.
A kinetic model of the Ca2+ transport across the IMM was reported by Dash et al. (Dash et al., 2009). The authors took into account the MCU-mediated Ca2+ uptake mechanism in respiring mitochondria. The model is based on a multi-state catalytic binding and Eyring’s free-energy barrier including a transporter T, which forms a complex with Ca2+ denoted as [Ca2+..T]. The process of complex formation is reversible in the cytoplasm, but equilibrium is strongly shifted to the complex formation. The transporter T is located in the uniporter system, and the authors proposed reversible processes of Ca2+-T complex formation on the outer surface of the IMM as well as dissociation and formation of such complex on the inner surface of the IMM. The model also introduced the process of complex transformation of Ca2+ from the outer surface of IMM to its inner surface. Such modeling approach for Ca2+ transport by IMM correlated well with the ion transport process across the IMM. The model includes two conformational changes of the MCU binding site that are dependent on ΔΨm, a regulator of the Ca2+ uptake. The model showed that the charge distribution of the MCU does not linearly decrease with Ca2+ uptake. In other words, the Ca2+ translocation from the IMS to the matrix by the uniporter is not a linear process.
A similar modeling approach was used that included a set of equations to clarify the contributions of ΔΨm, Pi, and Mg2+ to the MCU-mediated Ca2+ uptake (Pradhan et al., 2010b, 2011). The model described the possible mechanisms of the inhibitory effect of Mg2+ on Ca2+ uptake. Based on the experimental data, it simulated a dual inhibitory role of Mg2+ which acts as a competitive and non-competitive inhibitor. Three model types based on 3 different Ca2+ and Mg2+ binding assumptions were described to acquire the data fitting. It might be interesting to develop an extended model that could describe the role of electrogenic transfer of Ca2+ in volume dynamics.
A biophysical model for the kinetics of mNCE was developed for understanding of mitochondrial Ca2+ homeostasis (Pradhan et al., 2010a). The model is thermodynamically balanced and adequately describes a number of independent experimental data sets under a variety of experimental conditions. It takes into consideration a multistate catalytic binding mechanisms for carrier-mediated facilitated transport and Eyring’s free energy barrier theory. The model is able to predict the effects of ΔΨm and pH on the electrogenic exchange activity of mNCE.
Bazil and Dash (Bazil and Dash, 2011) continued modeling of individual IMM transporters such as the RaM, where a 4 state (i.e. the transporter could assume 4 conformational states for Ca2+ uptake) approach of the transporter was created and analyzed to experimental data from the liver and the heart. The model analysis identified functional differences between both tissues such as RaM in cardiac mitochondria take longer to recover (90 sec) than liver mitochondrial RaM (1 sec). The model was based on a set of ordinary and algebraic differential equations and the experimental data was fitted utilizing the least squared method. Interestingly, despite the simplicity of the model, the data produced from the model highly correlated with experimental data.
In conclusion, the individual approach provides great information about transport mechanisms such as elucidating their functional role and acquiring a deeper understanding of the inhibitory mechanisms displayed in these transporters. It plays an important role in explaining contradictory experimental data that may come from underlying characteristics of the transporter. An integration of the models developed via this approach should provide a holistic model that could probably describe mitochondrial ion dynamics.
4.3.2. Holistic approach
Kinetic models based on holistic approaches take into account 2 and more factors (processes) that can contribute to swelling. A kinetic model developed by Selivanov et al. (Selivanov et al., 1998) for the analysis of Ca2+m dynamics is based on the application of the Goldman equation to explain Ca2+ oscillations and Ca2+ sparks generated by the CICR mechanism in mitochondria associated with PTP flickering at a low conductance mode. The Goldman equation was used to describe various ion fluxes across the IMM by taking into consideration four mechanisms including the MCU, PTP, ETC, and a weak acid transporter. In this study, the contributions of the mNCX and mHCX were ignored because of the followings: a) Na+ was excluded from the media in experiments that would reduce the mNCX activity, and b) the role of mHCX in Ca2+ transport was found to be negligible (Ichas et al., 1997; Ichas et al., 1994). The model proposed that Ca2+ per se does not trigger PTP opening during mitochondrial CICR, however, if the concentration of Ca2+ in the matrix is sufficient, PTP opening is observed due to changes in matrix pH (pHm) or ΔΨm (Selivanov et al., 1998). Ca2+ uptake decreases ΔΨm and increases pHm, i.e. these two factors can be considered as triggers of PTP opening. It should be noted, that changes in pHm per se have a substantial effect on the buffering capacity of Ca2+ within the matrix through modulation of the activity of NHX and HCX (Santo-Domingo and Demaurex, 2010). In addition, pHm can affect mitochondrial Ca2+ influx/efflux mechanisms (proteins) and thus, change the Ca2+ sequestrating capacity of mitochondria. For example, the pH dependence of mitochondrial Ca2+ uptake was shown in Jurkat cells (Zabłocki et al., 2005) suggesting a potential role of H+ in the regulation of mitochondrial Ca2+ buffering capacity. Further studies are required to understand the role of pHm in mitochondrial Ca2+ buffering as well as establish a cause-effect relationship between changes in the Ca2+ sequestering capacity, ΔΨm and pHm. Based on experimental data, it was concluded that ΔΨm does not trigger PTP opening, and pHm was included in the model as the trigger of PTP opening (pH > 7.0 opens whereas pH < 7.0 closes the PTP). Numerical analysis of the model demonstrated that time oscillations of external Ca2+, pH, and ΔΨm are highly correlated with experimental data reported by others (Ichas et al., 1997; Ichas et al., 1994).
Pokhilko et al. (Pokhilko et al., 2006) developed a mathematical model of mitochondrial ion homeostasis. The model proposed three modes of Ca2+ transport and was applied to experimental data for the analysis of different modes of Ca2+ uptake by mitochondria. Modeling analysis demonstrated that the kinetics of Ca2+ uptake is regulated by the total amount of Ca2+ in the system, and the Ca2+ handling can be defined in three conditions: (1) Low total Ca2+ levels (< 140 nmol Ca2+/mg protein), where all available Ca2+ is accumulated in the matrix without activation of the PTP. (2) Intermediate total Ca2+ levels (140–160 nmol Ca2+/mg protein), where the accumulation of Ca2+ generates periodic opening and closure of the PTP and oscillations of ion fluxes. (3) High total Ca2+ levels (> 160 nmol Ca2+/mg protein), PTP is permanently opened, the effect of membrane depolarization is observable and small ions are moved out from the matrix. The model included the correlation of ΔΨm with ion transport across the IMM based on the Nernst equation. The equation is applied to quasistationary conditions, i.e. equilibrium in Ca2+ levels between cytoplasm and mitochondria creating a much faster transport mechanism.
Data simulation at low and intermediate levels of Ca2+ provided good modeling of the matrix volume dynamics (Pokhilko et al., 2006). The model describes the PTP opening and transport of K+, H+, Ca2+ and anions. It displayed Ca2+ retention, oscillation and release at low, intermediate, and high Ca2+ levels, respectively. Increasing Ca2+ uptake rates induced faster PTP opening and the simulation suggests that the mitochondria can accumulate up to 140 nmol of Ca2+/mg of protein without PTP opening. However, the volume simulated by high Ca2+ failed to correspond with experimental data when mitochondrial volume decreased with the opening of high-conductance PTPs. Additionally, the model demonstrated an increase of pHm by 0.3 units at high total [Ca2+] in the matrix. This intuitively would not make sense considering that the matrix content could be diluted by cytoplasmic medium (pH 7) upon PTP opening. Although the model does not completely simulate the experimental data, it introduced a wide variety of parameters such as ion changes, pHm, ΔΨm, and volume fluxes that were not considered in other models at the time.
Bazil et al (Bazil et al., 2010b) developed a model using multiple non-linear differential equations and differential algebraic equations (DAE). The model included several factors including ion fluxes (K+ cycle, mNCX), the TCA cycle, ETC, and oxidative phosphorylation, and the modeling process was represented by reversible and thermodynamically balanced reactions. The authors took into account the effect of mitochondrial swelling based on mitochondrial bioenergetics, which highly correlated with experimental data. However, the developed model was mostly directed to the analysis of mitochondrial bioenergetics, and swelling was considered as a small perturbation. The swelling portion of the model was simplified by focusing on the K+ cycle excluding the PTP as well as detailed mechanisms of Ca2+ fluxes such as RaM, mRyR and mBKCa channels that are involved in the mitochondrial swelling dynamics. In a study conducted soon after, an improved version of the model was presented, including a PTP induced swelling mechanism and 3 states (subpopulations) of mitochondria: the aggregated, the orthodox, and post-transition state (Bazil et al., 2010a). The model displays the aggregated state as the functional mitochondria before PTP opening. Once the conditions favoring PTP opening are met, an irreversible transition from the aggregated to the orthodox state occurs that includes the collapse of the ΔΨm and matrix swelling. Additionally, the model includes PTP closure when the mitochondria transfer from the orthodox to the post-transition state. This is a recovery state where mitochondria attempt to reestablish their ΔΨm and ionic concentration after the loss of matrix contents. The model provides valuable information about PTP opening rate (with and without Mg2+ inhibition), the mitochondrial swelling process induced by the PTP, and Ca2+ retention capacity. Overall, the model predicted that increasing the KHE may prevent PTP-induced swelling and its devastating consequences and suggested an alternative approach for targeting the PTP induction.
Recent studies provided more detailed mathematical analysis of Ca2+m dynamics to describe Ca2+ influx and efflux mechanisms in mitochondria (Bazil et al., 2013; Tewari et al., 2014). Individual roles of MCU as the Ca2+ buffering pathway and the putative mitochondrial RyR as the bioenergetics pathway were taken into consideration to distinguish two modes of Ca2+ uptake (Tewari et al., 2014). Although these models provide substantial information on the mechanisms of ion dynamics, their extension is necessary for the precise description of Ca2+ fluxes, mitochondrial swelling and PTP opening dynamics. In 2013, an interesting model was developed to elucidate the dynamics of the MCU and mNCX based on the Ca2+ buffering capacity in and out of the matrix (Blomeyer et al., 2013). Usually, Ca2+ dynamics and mitochondrial buffering capacity is characterized as the rise of matrix Ca2+ in an equal proportion to the decrease of external Ca2+. The model revealed the existence of a non-reciprocal relationship between the matrix and external Ca2+. The differences in the matrix Ca2+ and external Ca2+ dynamics is explained by the Ca2+ buffering system in the matrix. Ca2+-phosphate precipitation was discussed as a mechanism of matrix Ca2+ buffering, where environmental conditions such as pHi could drastically mediate the effectiveness of the mitochondrial buffering capacity due to a shift in Ca2+-phosphate precipitation capacity. Additionally, the authors observed a Na-dependent relationship between external Ca2+ and activation of the mNCX (Blomeyer et al., 2013). This study provided experimental data that supported modeling analysis on the dynamic Ca2+ buffering power of the matrix (Bazil et al., 2013) although the study did not take into consideration the role of PTP opening in the maintenance of the Ca2+ buffering capacity in mitochondria.
A mathematical model that described mitochondrial energetics, pHm regulation, and ion homeostasis was developed to assess the cross talk between excitation-contraction coupling and ATP synthesis (Wei et al., 2011). The model elucidated the dependence of mitochondrial respiration and ΔΨm on the ion homeostasis. It simulated oxygen consumption and ATP synthase activity under different conditions such as hypoxia and uncoupling. The model described the changes in Na+, Pi and H+, but did not include mitochondrial volume changes. Further studies are necessary for the creation of a mitochondrial swelling model that could examine mitochondrial dysfunction in a large scale including both physiological and pathophysiological conditions. The model did not take into consideration K+ transport that was shown to affect both mitochondrial respiration and swelling.
Interaction between secondary ions (e.g. Mg2+) and transport mechanisms can be mediated through allosteric regulation of the transport mechanisms for primary ions such as Ca2+. In a recent study, an analysis of the effects of Mg2+ on mitochondrial Ca2+ buffering capacity was conducted by elucidating its effects on Ca2+ influx/efflux mechanisms (Blomeyer et al., 2016). A fluorescent labelling technique was applied to evaluate Mg2+ sensitive Ca2+ uptake and the effects on Ca2+ buffering capacity. It must be noted that all Ca2+ influx and efflux mechanisms were assumed to occur through the MCU and mNCX, respectively. As discussed previously (Dash et al., 2009), the MCU can function under two distinct modes including the slow and fast Ca2+ uptakes. The study found that Mg2+ reduced Ca2+ influx by the MCU in a slow Ca2+ uptake mode, and Ca2+ efflux by the mNCX. Interestingly, Mg2+ had no effect on the MCU-mediated Ca2+ influx at the fast Ca2+ uptake mode. Additionally, Ca2+ buffering capacity of mitochondria was compromised with the allosteric effect of Mg2+ on the MCU (slow Ca2+ uptake mode) and mNCX. Apparently, allosteric regulation of the ion channels/transporters should be taken into consideration for a detailed modeling analysis of ion transport mechanisms in the mitochondria. It would be interesting to extend the analysis to include mitochondrial K+ uptake on Ca2+ buffering capacity.
As mentioned above (section 2.1.4), mitochondrial swelling is tightly associated with structural changes in the IMM integrity that affect both functional and metabolic activity of mitochondria. Hence, elucidation of the relationship between swelling and morphology with the progression of mitochondrial dysfunction is important for understanding the pathogenesis of aging, diabetes, cancer, neurodegenerative and cardiovascular diseases. A modified Nernst-Plank equation was applied by Song et al. (Song et al., 2013) for the analysis of the correlation between the IMM structure and function of mitochondria to produce ATP. The authors developed a theoretical model to test the effects of IMM morphology on the ΔΨm. The modeling analysis suggested that differences in proton-generated forces in the cristae and a non-cristae portion of the inner membrane can significantly change the IMM morphology. It was also shown that morphology-dependent electrical potential gradient along the outer side of the IMM controls proton concentration in cristae, and a high surface-to-volume ratio of an individual crista increases the proton motive force (Song et al., 2013). Thus, increased surface of an individual crista can stimulate ATP synthesis. This model compiles morphology of mitochondrial crista at the meso-scale with mitochondrial function. Although the modeling analysis does not take into consideration mitochondrial swelling, it can be a starting point for the development of a new model that would investigate the mechanism of interaction between mitochondrial swelling, IMM morphology and mitochondrial function in detail.
In conclusion, the holistic approach unites different mechanisms that regulate the mitochondrial volume. Although the approach is highly effective in providing insight into a multivariable system it is difficult to verify the model experimentally and develop it based on the multifactorial analysis. Furthermore, although a major part of experiments and model analyses has been done on mitochondria under physiological conditions (equilibrium state), very little emphasis has been given to the analysis of mitochondria under pathological conditions when ion flux mechanisms and PTP induction are significantly affected.
5. Alternative modeling approaches to mitochondrial swelling dynamics
As mentioned in previous sections, mitochondrial Ca2+ transport is a complex process, which is strongly coupled with ΔΨm and pHm. All 3 factors (Ca2+, ΔΨm and pHm) affect the PTP induction and dynamics. Matrix swelling induced by differences in ion concentrations between the cytoplasm and the matrix modulates the ΔΨm, IMM morphology, and pHm due to dilution. Accordingly, the dilution process can also proportionally increase dynamics of metabolic processes in the matrix. Thus, the matrix behavior is significantly dependent on mitochondrial swelling dynamics induced by Ca2+ transport between the cytoplasm and matrix. In the following sections, we will focus on the elucidation of ion dynamics across the IMM.
5.1. Volume dynamics based on osmotic pressure
Under the given cytosolic environment hydraulic pressure acting on the mitochondria may be neglected and only changes in the osmotic pressure can be considered to cause water flux. The identification of an equation that relates the changes of osmotic pressure with the changes in ionic concentration across the IMM has not been established yet.
An interesting model was developed for analysis of transmembrane ion/molecule transport on the basis of ionic electro-diffusion and osmotic water flows through the plasma membrane (Mori, 2012). A system of partial differential equations describes the dynamics of ion concentration and fluid flow with boundary conditions on the membrane surface that were deformed by swelling. The model takes into account the energy conservation law, where the sum of the entropic, elastic and electrostatic free energy is dissipated through viscous, electro-diffusive and osmotic flows. The 3D theoretical model was approximated by 1D modeling analysis through the use of numerical analysis. However, it is not clear how a water cross-membrane flow factor was considered for analysis of osmotic pressure created by differences in ion concentrations between the cytosol and the external media. Accordingly, osmotic pressure used for analysis of the cell swelling for i-th ion can be determined as follows:
| (1) |
Where Pos is the osmotic pressure, Mi is the ion molecular/atomic mass, and is the weight averaged second virial coefficient. Taking into account ion transport, is the time-dependent parameter, i.e. osmotic pressure is a time-dependent value that induces deformation of the plasma membrane. . This simple analysis demonstrates that the dynamics of cell morphology is an important factor in cell life.
In conclusion, potential effects of changes in membrane structure were not taken into consideration in previous studies related to modeling analysis of the ion transport across the membrane. However, mathematical tools developed in previous studies (Bazil and Dash, 2011; Dash et al., 2009; Pradhan et al., 2010a) can be adapted to the theoretical study of the mitochondrial swelling dynamics induced by ion transport across the IMM.
5.2. Diffusion limit of non-electrically charged species uptake by the IMM
Ion flux by the IMM was already determined in the previous section, and here we will discuss the transport of non-electrically charged species (NECS) through the IMM taking into consideration the role of PTP opening. The relationship (extended form) for NECS transport across the IMM considering PTP opening is expressed as follows:
| (2) |
where is the velocity (cm/s) with which the volume of cytoplasmic solution moves along the r vector; DNECS is the diffusion coefficient. IMM surface in our case is considered as a “black surface”, where the permeability coefficient of NECS uptake equal to one (assuming NECS atomic mass < 1.5 kDa). Since convection fluxes are not created in the bio-cells, the last term can be neglected. Likewise, the second term can also be neglected due to the lack of charges and thus, the last relationship can be rewritten as Fick’s law of diffusion:
| (3) |
This relationship can be presented as follows:
| (4) |
where δ0 is an unknown parameter, which is dependent of NECS mobility coefficients in the cytoplasm. The last approximation is explained with the fact that the real stationary diffusion profile of the NECS concentration is presented by curve (1), while approximated profile is presented by linear line (2). The last relationship can be used to estimate NECS flux, which is passed to the matrix.
An approximate approach was proposed for estimatation of the time characteristics of nonstationary system development to quasistationary conditions in the diffusional limit case. The following equation was obtained: Thus, is a time characteristics of creation of quasistationary conditions.
Thus, diffusion of the NECS across the IMM during PTP opening can be considered for analysis of the osmotic driving force created by transport. Since most models take into consideration only the water flux through the movement of ionic species, this could provide insight into the water flux provided by other solutes such as glucose.
5.3. Application of thermodynamics
Many approaches developed earlier for analysis of the transport dynamics by IMM are based on the application of thermodynamics such as the Goldman’s and Nernst’s. By considering solute flux to be at equilibrium, the following may be considered: , the k1 and k−1 were defined as the rate constants of direct influx and efflux processes, respectively. The detailed analysis demonstrates that in general case A1 ≠ A−1 (A1, A−1 are pre-exponential factors of the respective k1 and k−1 constants). Thus, we can write in general case, , where Ea,1 and Ea,−1 are activation energies direct and inverse uptake processes. The ratio of can be estimated using a typical way as the ratio of cell volume (Vc) to mitochondrial volume (Vm). Thus, the relationship the ratio of helps determine the enthalpy of the uptake process, which is defined by the activation energy difference as follows:
| (5) |
A thermodynamic approach can be used to analyze enthalpy of the uptake process as a function of ΔΨm. On the other hand, the time characteristic equation (section 5.2.) can be applied to the analysis of the case, when the time of equilibrium creation by, for example Ca2+, is much shorter than the characteristics time of ΔΨm dynamics.
Basic statements of non-equilibrium thermodynamics were developed by Prigogine (Prigogine, 1961) that were further applied to the analysis of different non-equilibrium physical, chemical and biophysical/biochemical processes. We already discussed the simplest reversible process of such transport that can be further elaborated for Ca2+ transport. For equilibrium conditions, the equilibrium concentrations of Ca2+ “in” and “out” of the matrix can be defined as and , respectively. If the system is under non-equilibrium conditions but it is close to equilibrium conditions, the respective concentration ratio can be presented as follows (Glansdorff and Prigogine, 1978):
| (6) |
Where, is a difference of the chemical potentials of the Ca2+ ion “out” and “in” the mitochondrial matrix. The last relationship describes the non-equilibrium ratio of Ca2+ concentrations, when deviation from equilibrium conditions are very small. This is a simple case of the development and application of non-equilibrium thermodynamics tool, however, such tool can be further developed for large deviations from equilibrium conditions. Note that the problem discussed above can also be used to obtain the Goldman equation.
6. Conclusions
In the present review, we discussed the different potential approaches, which can be applied to the analysis of mitochondrial swelling. Apparently, Ca2+ and K+ play an important role in physiological and pathological swelling of mitochondria. The transport of Ca2+ and K+ across the IMM is associated with influx/efflux mechanisms for other ions such as Na+, Cl− and H+ (not completely addressed in the text) suggesting a complex interplay between mitochondrial swelling and ion homeostasis. This interplay maintains function and metabolism of mitochondria under normal physiological conditions. However, excessive mitochondrial swelling resulted from alterations in ion homeostasis in the cytoplasm and mitochondrial matrix has detrimental consequences leading to cell death. Mitochondrial swelling is involved in the pathogenesis of many human diseases such as neurodegenerative and cardiovascular diseases, diabetes, etc. Therefore, modeling analysis of the swelling process is important for understanding the mechanisms of mitochondria-mediated cell dysfunction. Analysis of existing literature showed that there are a limited number of studies dedicated to the modeling of the mitochondrial swelling dynamics. In this review, we attempted to discuss different modeling approaches that could explain the underlying mechanisms of swelling. Based on this analysis, we assume that a full model that could highly simulate in vivo swelling should include several processes that regulate ion transport in mitochondria. The main processes contributing to mitochondrial swelling are the rate of ion influx/efflux across the IMM and changes in ΔΨm, pHm, and redox state of mitochondria. Also, membrane structure, metabolic state as well as heterogeneity of mitochondria that can significantly change ionic transport dynamics should be taken into consideration. Kinetic models and different approaches to modeling discussed in this review can be useful for the development of new models of swelling in mitochondria as well as other systems (cell and organ levels).
Table 1.
Main parameters used for modeling analysis of mitochondrial swelling
| Variable | Definition | Value | Units |
|---|---|---|---|
| Pressure | |||
| ΔπIMM | Osmotic pressure changes across the IMM | – | atm |
| Permeability and diffusion coefficients | |||
| PIMM | Permeability of the IMM | – | cm2 |
| PIMM,i | Electroneutral and electrogenic permeability coefficient of ions (e.g. H+, K+, HCO3−, and PO43−) | – | min−1 mg−1(protein) min−1mV−1 mg−1 (protein) |
| Pmax,uncoupler | Maximum uncoupler (e.g. FCCP) H+ permeability coefficient | – | nmol mg−1(protein) min−1 |
| Dm,i±, DC,i± | Diffusion coefficients of ions (e.g. H+, K+, HCO3−, and PO43−) in matrix and cytoplasm | – | cm2s−1 |
| Energy parameters | |||
| ΔΨm | Electric potential difference across the IMM | −110 – −150 | mV (Nicholls and Ward, 2000; Petronilli et al., 1993) |
| ΔμH | Chemical potential difference across the IMM | 1.29 | kJ mol−1 (Nicholls and Ward, 2000) |
| ΔΨm+ΔμH/(zF)(1) | The proton motive force | 180 | mV (Nicholls and Ward, 2000) |
| Rate parameters | |||
| km,ATP | Rate constant of ATP synthesis/hydrolysis in the matrix | 7.5×10⁴ | nmol mg−1(protein) min−1 (Bazil et al., 2010a) |
| Vmax | Maximal transporter rate | – | min−1 mg−1(protein) |
| Km | Michaelis constant for ion transporters and matrix enzymes | – | mM |
| ko | The channel open probability rate constant (e.g PTP) | – | min−1 |
| kcl | The channel closing probability rate constant (e.g PTP) | – | min−1 |
| kA | Rate constant for the production of respiration activating molecules in the matrix | – | min−1 |
| Keq | Equilibrium constants for ion transporters and matrix enzymes | – | mM |
| Kd | Dissociation constant for ion binding proteins | – | mM |
| kuncoupler | Apparent uncoupler (e.g. FCCP) k½ constant | – | min−1 |
| Electrical properties | |||
| Cmito | Mitochondrial membrane capacitance | 1.45×10⁻³ | nmol (ion) mg−1 (protein) mV−1 (Magnus and Keizer, 1997) |
| gion channel | Conductance of ionic channels in the IMM | – | nS |
| Eion | Reversal potential based on the Nernst equation | – | mV |
| Iion | The current produced by electrogenic channels | – | pA |
| M | Electric mobility of ions in the matrix | – | cm2 mV−1 min−1 |
| ρ0 | Average surface charge density of the matrix | 1.5×10⁻³ | cm−2 (Song et al., 2013) |
| Oxidative phosphorylation | |||
| EATP | Energy used to synthesize 1 mole of ATP | 42.68–58.58 | kJ (Kocherginsky, 2009; Song et al., 2013) |
| ρATPase | Density of F0F1-ATP synthase | 2500 | mol μm−2 (Song et al., 2013) |
| ΔG | Gibb’s free energy of reaction for ATP hydrolysis | −4.51 | kJ mol−1 (Bazil et al., 2010a) |
| Geometrical parameters | |||
| dmit | Averaged diameter of mitochondria | 0.237 | μm (Song et al., 2013) |
| SOMM | Surface area of the OMM | 0.736 | μm2 (Song et al., 2013) |
| dcrista | Diameter of a crista junction | 20–40 | nm (Mannella, 2006) |
| L | Length of a crista junction | 30–200 | nm (Mannella, 2006) |
| SIMM | Surface area of the IMM | 0.708 | μm2 (Song et al., 2013) |
| VMat | Mitochondrial matrix water volume | – | μl mg−1 (protein) |
| Impermeable molecules | |||
| MPC | Matrix protein content | – | μg μl−1 |
Highlights.
Several regulatory mechanisms are involved in the maintenance of mitochondrial volume
Mitochondrial swelling plays a central role is in cell life and cell death
Modeling of mitochondrial swelling is important for understanding the mechanisms of metabolic and functional changes in the cell under physiological and pathological conditions
Different kinetic models and approaches for simulation and prediction of in vivo mitochondrial swelling are discussed
Acknowledgments
The authors apologize that they could not cite all important studies in this field due to space restriction. This study was supported by the NHLBI NIH Grants SC1HL118669 (to SJ). The authors are grateful to PR NASA EPSCoR (NASA Cooperative Agreement NNX13AB22A to V.M.).
The abbreviations used
- AQP8
aquaporin-8
- Ca2+m
mitochondrial Ca2+
- CICR
Ca2+-induced Ca2+ release
- CypD
cyclophilin D
- ETC
electron transport chain
- mHCX
mitochondrial H+/Ca2+ exchanger
- IMM
inner mitochondrial membrane
- IMS
intermembrane space
- KHE
K+/H+ exchanger
- KO
knockout
- Kv1.3
voltage regulated K+ channel
- mBKCa
mitochondrial Ca2+ regulated K+ large conductance channel
- mKATP
mitochondrial ATP activated K+ channels
- mKv1.3
mitochondrial voltage-activated K+ channel of the Kv1.3 type
- MCU
mitochondrial Ca2+ uniporter
- mRyR
mitochondrial RyR
- ΔΨm
mitochondrial membrane potential
- mSKCa
mitochondrial small-conductance Ca2+-activated potassium channel
- mNCX
mitochondrial Na+/Ca2+ exchanger
- mNHE
mitochondrial Na+/H+ exchanger
- OMM
outer mitochondrial membrane
- pHm
matrix pH
- PTP
permeability transition pore
- RaM
rapid mode of Ca2+ uptake
- ROS
reactive oxygen species
- RyR
ryanodine receptor
- TCA
tricarboxylic acid
- UCP
uncoupling proteins
Footnotes
Publisher's Disclaimer: This is a PDF file of an unedited manuscript that has been accepted for publication. As a service to our customers we are providing this early version of the manuscript. The manuscript will undergo copyediting, typesetting, and review of the resulting proof before it is published in its final citable form. Please note that during the production process errors may be discovered which could affect the content, and all legal disclaimers that apply to the journal pertain.
Author Disclosure Statement
None
References
- Al-Nasser I, Crompton M. The reversible Ca2+-induced permeabilization of rat liver mitochondria. Biochem J. 1986;239:19–29. doi: 10.1042/bj2390019. [DOI] [PMC free article] [PubMed] [Google Scholar]
- Altschuld RA, Hohl CM, Castillo LC, Garleb AA, Starling RC, Brierley GP. Cyclosporin inhibits mitochondrial calcium efflux in isolated adult rat ventricular cardiomyocytes. Am J Physiol. 1992;262:H1699–1704. doi: 10.1152/ajpheart.1992.262.6.H1699. [DOI] [PubMed] [Google Scholar]
- Aon MA, Cortassa S, Wei AC, Grunnet M, O’Rourke B. Energetic performance is improved by specific activation of K+ fluxes through K(Ca) channels in heart mitochondria. Biochim Biophys Acta. 2010;1797:71–80. doi: 10.1016/j.bbabio.2009.08.002. [DOI] [PMC free article] [PubMed] [Google Scholar]
- Armston AE, Halestrap AP, Scott RD. The nature of the changes in liver mitochondrial function induced by glucagon treatment of rats. The effects of intramitochondrial volume, aging and benzyl alcohol. Biochim Biophys Acta. 1982;681:429–439. doi: 10.1016/0005-2728(82)90185-2. [DOI] [PubMed] [Google Scholar]
- Balaban RS, Nemoto S, Finkel T. Mitochondria, oxidants, and aging. Cell. 2005;120:483–495. doi: 10.1016/j.cell.2005.02.001. [DOI] [PubMed] [Google Scholar]
- Baranov SV, Stavrovskaya IG, Brown AM, Tyryshkin AM, Kristal BS. Kinetic model for Ca2+-induced permeability transition in energized liver mitochondria discriminates between inhibitor mechanisms. J Biol Chem. 2008;283:665–676. doi: 10.1074/jbc.M703484200. [DOI] [PubMed] [Google Scholar]
- Bartesaghi A, Subramaniam S. Membrane protein structure determination using cryo-electron tomography and 3D image averaging. Curr Opin Struct Biol. 2009;19:402–407. doi: 10.1016/j.sbi.2009.06.005. [DOI] [PMC free article] [PubMed] [Google Scholar]
- Bazil JN, Blomeyer CA, Pradhan RK, Camara AK, Dash RK. Modeling the calcium sequestration system in isolated guinea pig cardiac mitochondria. J Bioenerg Biomembr. 2013;45:177–188. doi: 10.1007/s10863-012-9488-2. [DOI] [PMC free article] [PubMed] [Google Scholar]
- Bazil JN, Buzzard GT, Rundell AE. A bioenergetic model of the mitochondrial population undergoing permeability transition. J Theor Biol. 2010a;265:672–690. doi: 10.1016/j.jtbi.2010.06.001. [DOI] [PubMed] [Google Scholar]
- Bazil JN, Buzzard GT, Rundell AE. Modeling mitochondrial bioenergetics with integrated volume dynamics. PLoS Comput Biol. 2010b;6:e1000632. doi: 10.1371/journal.pcbi.1000632. [DOI] [PMC free article] [PubMed] [Google Scholar]
- Bazil JN, Dash RK. A minimal model for the mitochondrial rapid mode of Ca(2)+ uptake mechanism. PLoS One. 2011;6:e21324. doi: 10.1371/journal.pone.0021324. [DOI] [PMC free article] [PubMed] [Google Scholar]
- Beavis AD, Brannan RD, Garlid KD. Swelling and contraction of the mitochondrial matrix. I. A structural interpretation of the relationship between light scattering and matrix volume. J Biol Chem. 1985;260:13424–13433. [PubMed] [Google Scholar]
- Bernardi P, Di Lisa F. The mitochondrial permeability transition pore: molecular nature and role as a target in cardioprotection. J Mol Cell Cardiol. 2015;78:100–106. doi: 10.1016/j.yjmcc.2014.09.023. [DOI] [PMC free article] [PubMed] [Google Scholar]
- Bernardi P, Petronilli V. The permeability transition pore as a mitochondrial calcium release channel: a critical appraisal. J Bioenerg Biomembr. 1996;28:131–138. doi: 10.1007/BF02110643. [DOI] [PubMed] [Google Scholar]
- Bernardi P, Vassanelli S, Veronese P, Colonna R, Szabo I, Zoratti M. Modulation of the mitochondrial permeability transition pore. Effect of protons and divalent cations. J Biol Chem. 1992;267:2934–2939. [PubMed] [Google Scholar]
- Beutner G, Sharma VK, Giovannucci DR, Yule DI, Sheu SS. Identification of a ryanodine receptor in rat heart mitochondria. J Biol Chem. 2001;276:21482–21488. doi: 10.1074/jbc.M101486200. [DOI] [PubMed] [Google Scholar]
- Beutner G, Sharma VK, Lin L, Ryu SY, Dirksen RT, Sheu SS. Type 1 ryanodine receptor in cardiac mitochondria: transducer of excitation-metabolism coupling. Biochim Biophys Acta. 2005;1717:1–10. doi: 10.1016/j.bbamem.2005.09.016. [DOI] [PubMed] [Google Scholar]
- Blomeyer CA, Bazil JN, Stowe DF, Dash RK, Camara AK. Mg(2+) differentially regulates two modes of mitochondrial Ca(2+) uptake in isolated cardiac mitochondria: implications for mitochondrial Ca(2+) sequestration. J Bioenerg Biomembr. 2016;48:175–188. doi: 10.1007/s10863-016-9644-1. [DOI] [PMC free article] [PubMed] [Google Scholar]
- Blomeyer CA, Bazil JN, Stowe DF, Pradhan RK, Dash RK, Camara AK. Dynamic buffering of mitochondrial Ca2+ during Ca2+ uptake and Na+-induced Ca2+ release. J Bioenerg Biomembr. 2013;45:189–202. doi: 10.1007/s10863-012-9483-7. [DOI] [PMC free article] [PubMed] [Google Scholar]
- Bock J, Szabo I, Jekle A, Gulbins E. Actinomycin D-induced apoptosis involves the potassium channel Kv1.3. Biochem Biophys Res Commun. 2002;295:526–531. doi: 10.1016/s0006-291x(02)00695-2. [DOI] [PubMed] [Google Scholar]
- Brenner C, Moulin M. Physiological roles of the permeability transition pore. Circ Res. 2012;111:1237–1247. doi: 10.1161/CIRCRESAHA.112.265942. [DOI] [PubMed] [Google Scholar]
- Calamita G, Ferri D, Gena P, Liquori GE, Cavalier A, Thomas D, Svelto M. The inner mitochondrial membrane has aquaporin-8 water channels and is highly permeable to water. J Biol Chem. 2005;280:17149–17153. doi: 10.1074/jbc.C400595200. [DOI] [PubMed] [Google Scholar]
- Castaldo P, Cataldi M, Magi S, Lariccia V, Arcangeli S, Amoroso S. Role of the mitochondrial sodium/calcium exchanger in neuronal physiology and in the pathogenesis of neurological diseases. Prog Neurobiol. 2009;87:58–79. doi: 10.1016/j.pneurobio.2008.09.017. [DOI] [PubMed] [Google Scholar]
- Cipolat S, Martins de Brito O, Dal Zilio B, Scorrano L. OPA1 requires mitofusin 1 to promote mitochondrial fusion. Proc Natl Acad Sci U S A. 2004;101:15927–15932. doi: 10.1073/pnas.0407043101. [DOI] [PMC free article] [PubMed] [Google Scholar]
- Cogliati S, Frezza C, Soriano ME, Varanita T, Quintana-Cabrera R, Corrado M, Cipolat S, Costa V, Casarin A, Gomes LC, Perales-Clemente E, Salviati L, Fernandez-Silva P, Enriquez JA, Scorrano L. Mitochondrial cristae shape determines respiratory chain supercomplexes assembly and respiratory efficiency. Cell. 2013;155:160–171. doi: 10.1016/j.cell.2013.08.032. [DOI] [PMC free article] [PubMed] [Google Scholar]
- Chudakov DM, Lukyanov S, Lukyanov KA. Fluorescent proteins as a toolkit for in vivo imaging. Trends Biotechnol. 2005;23:605–613. doi: 10.1016/j.tibtech.2005.10.005. [DOI] [PubMed] [Google Scholar]
- Das M, Parker JE, Halestrap AP. Matrix volume measurements challenge the existence of diazoxide/glibencamide-sensitive KATP channels in rat mitochondria. J Physiol. 2003;547:893–902. doi: 10.1113/jphysiol.2002.035006. [DOI] [PMC free article] [PubMed] [Google Scholar]
- Dash RK, Beard DA. Analysis of cardiac mitochondrial Na+-Ca2+ exchanger kinetics with a biophysical model of mitochondrial Ca2+ handling suggests a 3:1 stoichiometry. J Physiol. 2008;586:3267–3285. doi: 10.1113/jphysiol.2008.151977. [DOI] [PMC free article] [PubMed] [Google Scholar]
- Dash RK, Qi F, Beard DA. A biophysically based mathematical model for the kinetics of mitochondrial calcium uniporter. Biophys J. 2009;96:1318–1332. doi: 10.1016/j.bpj.2008.11.005. [DOI] [PMC free article] [PubMed] [Google Scholar]
- Davidson AM, Halestrap AP. Partial inhibition by cyclosporin A of the swelling of liver mitochondria in vivo and in vitro induced by sub-micromolar [Ca2+], but not by butyrate. Evidence for two distinct swelling mechanisms. Biochem J. 1990;268:147–152. doi: 10.1042/bj2680147. [DOI] [PMC free article] [PubMed] [Google Scholar]
- De Marchi U, Santo-Domingo J, Castelbou C, Sekler I, Wiederkehr A, Demaurex N. NCLX protein, but not LETM1, mediates mitochondrial Ca2+ extrusion, thereby limiting Ca2+-induced NAD(P)H production and modulating matrix redox state. J Biol Chem. 2014;289:20377–20385. doi: 10.1074/jbc.M113.540898. [DOI] [PMC free article] [PubMed] [Google Scholar]
- Diwan JJ. Mitochondrial transport of K+ and Mg2+ Biochim Biophys Acta. 1987;895:155–165. doi: 10.1016/s0304-4173(87)80001-0. [DOI] [PubMed] [Google Scholar]
- Dolga AM, Netter MF, Perocchi F, Doti N, Meissner L, Tobaben S, Grohm J, Zischka H, Plesnila N, Decher N, Culmsee C. Mitochondrial small conductance SK2 channels prevent glutamate-induced oxytosis and mitochondrial dysfunction. J Biol Chem. 2013;288:10792–10804. doi: 10.1074/jbc.M113.453522. [DOI] [PMC free article] [PubMed] [Google Scholar]
- Eisenhofer S, Tookos F, Hense BA, Schulz S, Filbir F, Zischka H. A mathematical model of mitochondrial swelling. BMC Res Notes. 2010;3:67. doi: 10.1186/1756-0500-3-67. [DOI] [PMC free article] [PubMed] [Google Scholar]
- Eliseev RA, Gunter KK, Gunter TE. Bcl-2 sensitive mitochondrial potassium accumulation and swelling in apoptosis. Mitochondrion. 2002;1:361–370. doi: 10.1016/s1567-7249(01)00039-3. [DOI] [PubMed] [Google Scholar]
- Elrod JW, Wong R, Mishra S, Vagnozzi RJ, Sakthievel B, Goonasekera SA, Karch J, Gabel S, Farber J, Force T, Brown JH, Murphy E, Molkentin JD. Cyclophilin D controls mitochondrial pore-dependent Ca(2+) exchange, metabolic flexibility, and propensity for heart failure in mice. J Clin Invest. 2010;120:3680–3687. doi: 10.1172/JCI43171. [DOI] [PMC free article] [PubMed] [Google Scholar]
- Frey TG, Mannella CA. The internal structure of mitochondria. Trends Biochem Sci. 2000;25:319–324. doi: 10.1016/s0968-0004(00)01609-1. [DOI] [PubMed] [Google Scholar]
- Frey TG, Renken CW, Perkins GA. Insight into mitochondrial structure and function from electron tomography. Biochim Biophys Acta. 2002;1555:196–203. doi: 10.1016/s0005-2728(02)00278-5. [DOI] [PubMed] [Google Scholar]
- Frezza C, Cipolat S, Martins de Brito O, Micaroni M, Beznoussenko GV, Rudka T, Bartoli D, Polishuck RS, Danial NN, De Strooper B, Scorrano L. OPA1 controls apoptotic cristae remodeling independently from mitochondrial fusion. Cell. 2006;126:177–189. doi: 10.1016/j.cell.2006.06.025. [DOI] [PubMed] [Google Scholar]
- Garlid KD. On the mechanism of regulation of the mitochondrial K+/H+ exchanger. J Biol Chem. 1980;255:11273–11279. [PubMed] [Google Scholar]
- Garlid KD. Cation transport in mitochondria–the potassium cycle. Biochim Biophys Acta. 1996;1275:123–126. doi: 10.1016/0005-2728(96)00061-8. [DOI] [PubMed] [Google Scholar]
- Garlid KD, Paucek P. Mitochondrial potassium transport: the K(+) cycle. Biochim Biophys Acta. 2003;1606:23–41. doi: 10.1016/s0005-2728(03)00108-7. [DOI] [PubMed] [Google Scholar]
- Giorgi C, Agnoletto C, Bononi A, Bonora M, De Marchi E, Marchi S, Missiroli S, Patergnani S, Poletti F, Rimessi A, Suski JM, Wieckowski MR, Pinton P. Mitochondrial calcium homeostasis as potential target for mitochondrial medicine. Mitochondrion. 2012;12:77–85. doi: 10.1016/j.mito.2011.07.004. [DOI] [PMC free article] [PubMed] [Google Scholar]
- Glansdorff P, Prigogine I. Thermodynamic theory of structure, stability and fluctuations. Wiley-Interscience; London, New York: 1978. [Google Scholar]
- Gogvadze V, Robertson JD, Enoksson M, Zhivotovsky B, Orrenius S. Mitochondrial cytochrome c release may occur by volume-dependent mechanisms not involving permeability transition. Biochem J. 2004;378:213–217. doi: 10.1042/BJ20031193. [DOI] [PMC free article] [PubMed] [Google Scholar]
- Gong G, Liu X, Zhang H, Sheu SS, Wang W. Mitochondrial flash as a novel biomarker of mitochondrial respiration in the heart. Am J Physiol Heart Circ Physiol. 2015;309:H1166–1177. doi: 10.1152/ajpheart.00462.2015. [DOI] [PMC free article] [PubMed] [Google Scholar]
- Graier WF, Trenker M, Malli R. Mitochondrial Ca2+, the secret behind the function of uncoupling proteins 2 and 3? Cell Calcium. 2008;44:36–50. doi: 10.1016/j.ceca.2008.01.001. [DOI] [PMC free article] [PubMed] [Google Scholar]
- Halestrap AP. The regulation of the matrix volume of mammalian mitochondria in vivo and in vitro and its role in the control of mitochondrial metabolism. Biochim Biophys Acta. 1989;973:355–382. doi: 10.1016/s0005-2728(89)80378-0. [DOI] [PubMed] [Google Scholar]
- Halestrap AP. Regulation of mitochondrial metabolism through changes in matrix volume. Biochem Soc Trans. 1994;22:522–529. doi: 10.1042/bst0220522. [DOI] [PubMed] [Google Scholar]
- Halestrap AP, Clarke SJ, Javadov SA. Mitochondrial permeability transition pore opening during myocardial reperfusion–a target for cardioprotection. Cardiovasc Res. 2004;61:372–385. doi: 10.1016/S0008-6363(03)00533-9. [DOI] [PubMed] [Google Scholar]
- Halestrap AP, Dunlop JL. Intramitochondrial regulation of fatty acid beta-oxidation occurs between flavoprotein and ubiquinone. A role for changes in the matrix volume. Biochem J. 1986;239:559–565. doi: 10.1042/bj2390559. [DOI] [PMC free article] [PubMed] [Google Scholar]
- Halestrap AP, Kerr PM, Javadov S, Woodfield KY. Elucidating the molecular mechanism of the permeability transition pore and its role in reperfusion injury of the heart. Biochim Biophys Acta. 1998;1366:79–94. doi: 10.1016/s0005-2728(98)00122-4. [DOI] [PubMed] [Google Scholar]
- Halestrap AP, Quinlan PT. The intramitochondrial volume measured using sucrose as an extramitochondrial marker overestimates the true matrix volume determined with mannitol. Biochem J. 1983;214:387–393. doi: 10.1042/bj2140387. [DOI] [PMC free article] [PubMed] [Google Scholar]
- Halestrap AP, Quinlan PT, Whipps DE, Armston AE. Regulation of the mitochondrial matrix volume in vivo and in vitro. The role of calcium. Biochem J. 1986;236:779–787. doi: 10.1042/bj2360779. [DOI] [PMC free article] [PubMed] [Google Scholar]
- Heinen A, Camara AK, Aldakkak M, Rhodes SS, Riess ML, Stowe DF. Mitochondrial Ca2+-induced K+ influx increases respiration and enhances ROS production while maintaining membrane potential. Am J Physiol Cell Physiol. 2007a;292:C148–156. doi: 10.1152/ajpcell.00215.2006. [DOI] [PubMed] [Google Scholar]
- Heinen A, Aldakkak M, Stowe DF, Rhodes SS, Riess ML, Varadarajan SG, Camara AK. Reverse electron flow-induced ROS production is attenuated by activation of mitochondrial Ca2+-sensitive K+ channels. Am J Physiol Heart Circ Physiol. 2007b;293:H1400–407. doi: 10.1152/ajpheart.00198.2007. [DOI] [PubMed] [Google Scholar]
- Hoppe UC. Mitochondrial calcium channels. FEBS Lett. 2010;584:1975–1981. doi: 10.1016/j.febslet.2010.04.017. [DOI] [PubMed] [Google Scholar]
- Huang B, Bates M, Zhuang X. Super-resolution fluorescence microscopy. Annu Rev Biochem. 2009;78:993–1016. doi: 10.1146/annurev.biochem.77.061906.092014. [DOI] [PMC free article] [PubMed] [Google Scholar]
- Huser J, Blatter LA. Fluctuations in mitochondrial membrane potential caused by repetitive gating of the permeability transition pore. Biochem J. 1999;343(Pt 2):311–317. [PMC free article] [PubMed] [Google Scholar]
- Ichas F, Jouaville LS, Mazat JP. Mitochondria are excitable organelles capable of generating and conveying electrical and calcium signals. Cell. 1997;89:1145–1153. doi: 10.1016/s0092-8674(00)80301-3. [DOI] [PubMed] [Google Scholar]
- Ichas F, Jouaville LS, Sidash SS, Mazat JP, Holmuhamedov EL. Mitochondrial calcium spiking: a transduction mechanism based on calcium-induced permeability transition involved in cell calcium signalling. FEBS Lett. 1994;348:211–215. doi: 10.1016/0014-5793(94)00615-6. [DOI] [PubMed] [Google Scholar]
- Ichas F, Mazat JP. From calcium signaling to cell death: two conformations for the mitochondrial permeability transition pore. Switching from low- to high-conductance state. Biochim Biophys Acta. 1998;1366:33–50. doi: 10.1016/s0005-2728(98)00119-4. [DOI] [PubMed] [Google Scholar]
- Jang S, Lewis TS, Powers C, Khuchua Z, Baines CP, Wipf P, Javadov S. Elucidating mitochondrial electron transport chain supercomplexes in the heart during ischemia-reperfusion. Antioxid Redox Signal. 2017;27:57–69. doi: 10.1089/ars.2016.6635. [DOI] [PMC free article] [PubMed] [Google Scholar]
- Javadov S, Jang S, Parodi-Rullan R, Khuchua Z, Kuznetsov AV. Mitochondrial permeability transition in cardiac ischemia-reperfusion: whether cyclophilin D is a viable target for cardioprotection? Cell Mol Life Sci. 2017;74:2795–2813. doi: 10.1007/s00018-017-2502-4. [DOI] [PMC free article] [PubMed] [Google Scholar]
- Javadov S, Rajapurohitam V, Kilic A, Hunter JC, Zeidan A, Said Faruq N, Escobales N, Karmazyn M. Expression of mitochondrial fusion-fission proteins during post-infarction remodeling: the effect of NHE-1 inhibition. Basic Res Cardiol. 2011;106:99–109. doi: 10.1007/s00395-010-0122-3. [DOI] [PubMed] [Google Scholar]
- Jiang D, Zhao L, Clapham DE. Genome-wide RNAi screen identifies Letm1 as a mitochondrial Ca2+/H+ antiporter. Science. 2009;326:144–147. doi: 10.1126/science.1175145. [DOI] [PMC free article] [PubMed] [Google Scholar]
- Kaasik A, Safiulina D, Zharkovsky A, Veksler V. Regulation of mitochondrial matrix volume. Am J Physiol Cell Physiol. 2007;292:C157–163. doi: 10.1152/ajpcell.00272.2006. [DOI] [PubMed] [Google Scholar]
- Kim B, Matsuoka S. Cytoplasmic Na+-dependent modulation of mitochondrial Ca2+ via electrogenic mitochondrial Na+-Ca2+ exchange. J Physiol. 2008;586:1683–1697. doi: 10.1113/jphysiol.2007.148726. [DOI] [PMC free article] [PubMed] [Google Scholar]
- Klingenberg M, Grebe K, Scherer B. Opposite effects of bongkrekic acid and atractyloside on the adenine nucleotides induced mitochondrial volume changes and on the efflux of adenine nucleotides. FEBS Lett. 1971;16:253–256. doi: 10.1016/0014-5793(71)80363-0. [DOI] [PubMed] [Google Scholar]
- Kocherginsky N. Acidic lipids, H(+)-ATPases, and mechanism of oxidative phosphorylation. Physico-chemical ideas 30 years after P. Mitchell’s Nobel Prize award. Prog Biophys Mol Biol. 2009;99:20–41. doi: 10.1016/j.pbiomolbio.2008.10.013. [DOI] [PubMed] [Google Scholar]
- Kristian T, Siesjo BK. Calcium in ischemic cell death. Stroke. 1998;29:705–718. doi: 10.1161/01.str.29.3.705. [DOI] [PubMed] [Google Scholar]
- Lee WK, Thevenod F. A role for mitochondrial aquaporins in cellular life-and-death decisions? Am J Physiol Cell Physiol. 2006;291:C195–202. doi: 10.1152/ajpcell.00641.2005. [DOI] [PubMed] [Google Scholar]
- Letts JA, Fiedorczuk K, Sazanov LA. The architecture of respiratory supercomplexes. Nature. 2016;537:644–648. doi: 10.1038/nature19774. [DOI] [PubMed] [Google Scholar]
- Liesa M, Palacin M, Zorzano A. Mitochondrial dynamics in mammalian health and disease. Physiol Rev. 2009;89:799–845. doi: 10.1152/physrev.00030.2008. [DOI] [PubMed] [Google Scholar]
- Lim KH, Javadov SA, Das M, Clarke SJ, Suleiman MS, Halestrap AP. The effects of ischaemic preconditioning, diazoxide and 5-hydroxydecanoate on rat heart mitochondrial volume and respiration. J Physiol. 2002;545:961–974. doi: 10.1113/jphysiol.2002.031484. [DOI] [PMC free article] [PubMed] [Google Scholar]
- Magnus G, Keizer J. Minimal model of beta-cell mitochondrial Ca2+ handling. Am J Physiol. 1997;273:C717–733. doi: 10.1152/ajpcell.1997.273.2.C717. [DOI] [PubMed] [Google Scholar]
- Mannella CA. Structure and dynamics of the mitochondrial inner membrane cristae. Biochim Biophys Acta. 2006;1763:542–548. doi: 10.1016/j.bbamcr.2006.04.006. [DOI] [PubMed] [Google Scholar]
- Massari S. Kinetic analysis of the mitochondrial permeability transition. J Biol Chem. 1996;271:31942–31948. [PubMed] [Google Scholar]
- Mnatsakanyan N, Beutner G, Porter GA, Alavian KN, Jonas EA. Physiological roles of the mitochondrial permeability transition pore. J Bioenerg Biomembr. 2017;49:13–25. doi: 10.1007/s10863-016-9652-1. [DOI] [PMC free article] [PubMed] [Google Scholar]
- Mori Y. Mathematical properties of pump-leak models of cell volume control and electrolyte balance. J Math Biol. 2012;65:875–918. doi: 10.1007/s00285-011-0483-8. [DOI] [PubMed] [Google Scholar]
- Nicholls DG, Ward MW. Mitochondrial membrane potential and neuronal glutamate excitotoxicity: mortality and millivolts. Trends Neurosci. 2000;23:166–174. doi: 10.1016/s0166-2236(99)01534-9. [DOI] [PubMed] [Google Scholar]
- Nowikovsky K, Schweyen RJ, Bernardi P. Pathophysiology of mitochondrial volume homeostasis: potassium transport and permeability transition. Biochim Biophys Acta. 2009;1787:345–350. doi: 10.1016/j.bbabio.2008.10.006. [DOI] [PubMed] [Google Scholar]
- O’Rourke B. Mitochondrial ion channels. Annu Rev Physiol. 2007;69:19–49. doi: 10.1146/annurev.physiol.69.031905.163804. [DOI] [PMC free article] [PubMed] [Google Scholar]
- O’Rourke B, Cortassa S, Aon MA. Mitochondrial ion channels: gatekeepers of life and death. Physiology (Bethesda) 2005;20:303–315. doi: 10.1152/physiol.00020.2005. [DOI] [PMC free article] [PubMed] [Google Scholar]
- O’Rourke B, Ramza BM, Marban E. Oscillations of membrane current and excitability driven by metabolic oscillations in heart cells. Science. 1994;265:962–966. doi: 10.1126/science.8052856. [DOI] [PubMed] [Google Scholar]
- Okayasu T, Curtis MT, Farber JL. Structural alterations of the inner mitochondrial membrane in ischemic liver cell injury. Arch Biochem Biophys. 1985;236:638–645. doi: 10.1016/0003-9861(85)90668-x. [DOI] [PubMed] [Google Scholar]
- Owen MR, Halestrap AP. The mechanisms by which mild respiratory chain inhibitors inhibit hepatic gluconeogenesis. Biochim Biophys Acta. 1993;1142:11–22. doi: 10.1016/0005-2728(93)90079-u. [DOI] [PubMed] [Google Scholar]
- Pan X, Liu J, Nguyen T, Liu C, Sun J, Teng Y, Fergusson MM, Rovira II, Allen M, Springer DA, Aponte AM, Gucek M, Balaban RS, Murphy E, Finkel T. The physiological role of mitochondrial calcium revealed by mice lacking the mitochondrial calcium uniporter. Nat Cell Biol. 2013;15:1464–1472. doi: 10.1038/ncb2868. [DOI] [PMC free article] [PubMed] [Google Scholar]
- Paradies G, Paradies V, De Benedictis V, Ruggiero FM, Petrosillo G. Functional role of cardiolipin in mitochondrial bioenergetics. Biochim Biophys Acta. 2014;1837:408–417. doi: 10.1016/j.bbabio.2013.10.006. [DOI] [PubMed] [Google Scholar]
- Patron M, Raffaello A, Granatiero V, Tosatto A, Merli G, De Stefani D, Wright L, Pallafacchina G, Terrin A, Mammucari C, Rizzuto R. The mitochondrial calcium uniporter (MCU): molecular identity and physiological roles. J Biol Chem. 2013;288:10750–10758. doi: 10.1074/jbc.R112.420752. [DOI] [PMC free article] [PubMed] [Google Scholar]
- Patterson G, Davidson M, Manley S, Lippincott-Schwartz J. Superresolution imaging using single-molecule localization. Annu Rev Phys Chem. 2010;61:345–367. doi: 10.1146/annurev.physchem.012809.103444. [DOI] [PMC free article] [PubMed] [Google Scholar]
- Perkins G, Renken C, Martone ME, Young SJ, Ellisman M, Frey T. Electron tomography of neuronal mitochondria: three-dimensional structure and organization of cristae and membrane contacts. J Struct Biol. 1997;119:260–272. doi: 10.1006/jsbi.1997.3885. [DOI] [PubMed] [Google Scholar]
- Petronilli V, Cola C, Massari S, Colonna R, Bernardi P. Physiological effectors modify voltage sensing by the cyclosporin A-sensitive permeability transition pore of mitochondria. J Biol Chem. 1993;268:21939–21945. [PubMed] [Google Scholar]
- Petronilli V, Penzo D, Scorrano L, Bernardi P, Di Lisa F. The mitochondrial permeability transition, release of cytochrome c and cell death. Correlation with the duration of pore openings in situ. J Biol Chem. 2001;276:12030–12034. doi: 10.1074/jbc.M010604200. [DOI] [PubMed] [Google Scholar]
- Pokhilko AV, Ataullakhanov FI, Holmuhamedov EL. Mathematical model of mitochondrial ionic homeostasis: three modes of Ca2+ transport. J Theor Biol. 2006;243:152–169. doi: 10.1016/j.jtbi.2006.05.025. [DOI] [PubMed] [Google Scholar]
- Pradhan RK, Beard DA, Dash RK. A biophysically based mathematical model for the kinetics of mitochondrial Na+-Ca2+ antiporter. Biophys J. 2010a;98:218–230. doi: 10.1016/j.bpj.2009.10.005. [DOI] [PMC free article] [PubMed] [Google Scholar]
- Pradhan RK, Qi F, Beard DA, Dash RK. Characterization of membrane potential dependency of mitochondrial Ca2+ uptake by an improved biophysical model of mitochondrial Ca2+ uniporter. PLoS One. 2010b;5:e13278. doi: 10.1371/journal.pone.0013278. [DOI] [PMC free article] [PubMed] [Google Scholar]
- Pradhan RK, Qi F, Beard DA, Dash RK. Characterization of Mg2+ inhibition of mitochondrial Ca2+ uptake by a mechanistic model of mitochondrial Ca2+ uniporter. Biophys J. 2011;101:2071–2081. doi: 10.1016/j.bpj.2011.09.029. [DOI] [PMC free article] [PubMed] [Google Scholar]
- Prigogine I. Introduction to thermodynamics of irreversible processes. 2nd. Interscience Publishers; New York: 1961. rev ed. [Google Scholar]
- Quinlan PT, Thomas AP, Armston AE, Halestrap AP. Measurement of the intramitochondrial volume in hepatocytes without cell disruption and its elevation by hormones and valinomycin. Biochem J. 1983;214:395–404. doi: 10.1042/bj2140395. [DOI] [PMC free article] [PubMed] [Google Scholar]
- Quintana-Cabrera R, Mehrotra A, Rigoni G, Soriano ME. Who and how in the regulation of mitochondrial cristae shape and function. Biochem Biophys Res Commun. 2017 doi: 10.1016/j.bbrc.2017.04.088. [DOI] [PubMed] [Google Scholar]
- Rampelt H, Zerbes RM, van der Laan M, Pfanner N. Role of the mitochondrial contact site and cristae organizing system in membrane architecture and dynamics. Biochim Biophys Acta. 2017;1864:737–746. doi: 10.1016/j.bbamcr.2016.05.020. [DOI] [PubMed] [Google Scholar]
- Rasola A, Bernardi P. Mitochondrial permeability transition in Ca(2+)-dependent apoptosis and necrosis. Cell Calcium. 2011;50:222–233. doi: 10.1016/j.ceca.2011.04.007. [DOI] [PubMed] [Google Scholar]
- Rizzuto R, Brini M, Pizzo P, Murgia M, Pozzan T. Chimeric green fluorescent protein as a tool for visualizing subcellular organelles in living cells. Curr Biol. 1995;5:635–642. doi: 10.1016/s0960-9822(95)00128-x. [DOI] [PubMed] [Google Scholar]
- Rizzuto R, De Stefani D, Raffaello A, Mammucari C. Mitochondria as sensors and regulators of calcium signalling. Nat Rev Mol Cell Biol. 2012;13:566–578. doi: 10.1038/nrm3412. [DOI] [PubMed] [Google Scholar]
- Rolfe DF, Brown GC. Cellular energy utilization and molecular origin of standard metabolic rate in mammals. Physiol Rev. 1997;77:731–758. doi: 10.1152/physrev.1997.77.3.731. [DOI] [PubMed] [Google Scholar]
- Rosselin M, Santo-Domingo J, Bermont F, Giacomello M, Demaurex N. L-OPA1 regulates mitoflash biogenesis independently from membrane fusion. EMBO Rep. 2017;18:451–463. doi: 10.15252/embr.201642931. [DOI] [PMC free article] [PubMed] [Google Scholar]
- Sagan L. On the origin of mitosing cells. J Theor Biol. 1967;14:255–274. doi: 10.1016/0022-5193(67)90079-3. [DOI] [PubMed] [Google Scholar]
- Santo-Domingo J, Demaurex N. Calcium uptake mechanisms of mitochondria. Biochim Biophys Acta. 2010;1797:907–912. doi: 10.1016/j.bbabio.2010.01.005. [DOI] [PubMed] [Google Scholar]
- Scorrano L, Ashiya M, Buttle K, Weiler S, Oakes SA, Mannella CA, Korsmeyer SJ. A distinct pathway remodels mitochondrial cristae and mobilizes cytochrome c during apoptosis. Dev Cell. 2002;2:55–67. doi: 10.1016/s1534-5807(01)00116-2. [DOI] [PubMed] [Google Scholar]
- Selivanov VA, Ichas F, Holmuhamedov EL, Jouaville LS, Evtodienko YV, Mazat JP. A model of mitochondrial Ca(2+)-induced Ca2+ release simulating the Ca2+ oscillations and spikes generated by mitochondria. Biophys Chem. 1998;72:111–121. doi: 10.1016/s0301-4622(98)00127-6. [DOI] [PubMed] [Google Scholar]
- Shang W, Gao H, Lu F, Ma Q, Fang H, Sun T, Xu J, Ding Y, Lin Y, Wang Y, Wang X, Cheng H, Zheng M. Cyclophilin D regulates mitochondrial flashes and metabolism in cardiac myocytes. J Mol Cell Cardiol. 2016;91:63–71. doi: 10.1016/j.yjmcc.2015.10.036. [DOI] [PubMed] [Google Scholar]
- Smets I, Caplanusi A, Despa S, Molnar Z, Radu M, VandeVen M, Ameloot M, Steels P. Ca2+ uptake in mitochondria occurs via the reverse action of the Na+/Ca2+ exchanger in metabolically inhibited MDCK cells. Am J Physiol Renal Physiol. 2004;286:F784–794. doi: 10.1152/ajprenal.00284.2003. [DOI] [PubMed] [Google Scholar]
- Song DH, Park J, Maurer LL, Lu W, Philbert MA, Sastry AM. Biophysical significance of the inner mitochondrial membrane structure on the electrochemical potential of mitochondria. Phys Rev E Stat Nonlin Soft Matter Phys. 2013;88:062723. doi: 10.1103/PhysRevE.88.062723. [DOI] [PMC free article] [PubMed] [Google Scholar]
- Stowe DF, Gadicherla AK, Zhou Y, Aldakkak M, Cheng Q, Kwok WM, Jiang MT, Heisner JS, Yang M, Camara AK. Protection against cardiac injury by small Ca(2+)-sensitive K(+) channels identified in guinea pig cardiac inner mitochondrial membrane. Biochim Biophys Acta. 2013;1828:427–442. doi: 10.1016/j.bbamem.2012.08.031. [DOI] [PMC free article] [PubMed] [Google Scholar]
- Szabo I, Bock J, Jekle A, Soddemann M, Adams C, Lang F, Zoratti M, Gulbins E. A novel potassium channel in lymphocyte mitochondria. J Biol Chem. 2005;280:12790–12798. doi: 10.1074/jbc.M413548200. [DOI] [PubMed] [Google Scholar]
- Szabo I, Zoratti M. Mitochondrial channels: ion fluxes and more. Physiol Rev. 2014;94:519–608. doi: 10.1152/physrev.00021.2013. [DOI] [PubMed] [Google Scholar]
- Tan S, Sagara Y, Liu Y, Maher P, Schubert D. The regulation of reactive oxygen species production during programmed cell death. J Cell Biol. 1998;141:1423–1432. doi: 10.1083/jcb.141.6.1423. [DOI] [PMC free article] [PubMed] [Google Scholar]
- Tedeschi H, Harris DL. The osmotic behavior and permeability to non-electrolytes of mitochondria. Arch Biochem Biophys. 1955;58:52–67. doi: 10.1016/0003-9861(55)90092-8. [DOI] [PubMed] [Google Scholar]
- Tedeschi H, Harris DL. Some observations on the photometric estimation of mitochondrial volume. Biochim Biophys Acta. 1958;28:392–402. doi: 10.1016/0006-3002(58)90487-6. [DOI] [PubMed] [Google Scholar]
- Tewari SG, Camara AK, Stowe DF, Dash RK. Computational analysis of Ca2+ dynamics in isolated cardiac mitochondria predicts two distinct modes of Ca2+ uptake. J Physiol. 2014;592:1917–1930. doi: 10.1113/jphysiol.2013.268847. [DOI] [PMC free article] [PubMed] [Google Scholar]
- Trenker M, Malli R, Fertschai I, Levak-Frank S, Graier WF. Uncoupling proteins 2 and 3 are fundamental for mitochondrial Ca2+ uniport. Nat Cell Biol. 2007;9:445–452. doi: 10.1038/ncb1556. [DOI] [PMC free article] [PubMed] [Google Scholar]
- Tsai MF, Jiang D, Zhao L, Clapham D, Miller C. Functional reconstitution of the mitochondrial Ca2+/H+ antiporter Letm1. J Gen Physiol. 2014;143:67–73. doi: 10.1085/jgp.201311096. [DOI] [PMC free article] [PubMed] [Google Scholar]
- Villa-Abrille MC, Cingolani E, Cingolani HE, Alvarez BV. Silencing of cardiac mitochondrial NHE1 prevents mitochondrial permeability transition pore opening. Am J Physiol Heart Circ Physiol. 2011;300:H1237–1251. doi: 10.1152/ajpheart.00840.2010. [DOI] [PubMed] [Google Scholar]
- Wang W, Fang H, Groom L, Cheng A, Zhang W, Liu J, Wang X, Li K, Han P, Zheng M, Yin J, Mattson MP, Kao JP, Lakatta EG, Sheu SS, Ouyang K, Chen J, Dirksen RT, Cheng H. Superoxide flashes in single mitochondria. Cell. 2008;134:279–290. doi: 10.1016/j.cell.2008.06.017. [DOI] [PMC free article] [PubMed] [Google Scholar]
- Wang W, Gong G, Wang X, Wei-LaPierre L, Cheng H, Dirksen R, Sheu SS. Mitochondrial Flash: Integrative Reactive Oxygen Species and pH Signals in Cell and Organelle Biology. Antioxid Redox Signal. 2016;25:534–549. doi: 10.1089/ars.2016.6739. [DOI] [PMC free article] [PubMed] [Google Scholar]
- Wei AC, Aon MA, O’Rourke B, Winslow RL, Cortassa S. Mitochondrial energetics, pH regulation, and ion dynamics: a computational-experimental approach. Biophys J. 2011;100:2894–2903. doi: 10.1016/j.bpj.2011.05.027. [DOI] [PMC free article] [PubMed] [Google Scholar]
- Yang M, Camara AKS, Aldakkak M, Kwok WM, Stowe DF. Identity and function of a cardiac mitochondrial small conductance Ca2+-activated K+ channel splice variant. Biochim Biophys Acta. 2017;1858:442–458. doi: 10.1016/j.bbabio.2017.03.005. [DOI] [PMC free article] [PubMed] [Google Scholar]
- Zabłocki K, Szczepanowska J, Duszyński J. Extracellular pH modifies mitochondrial control of capacitative calcium entry in Jurkat cells. J Biol Chem. 2005;280:3516–3521. doi: 10.1074/jbc.M411507200. [DOI] [PubMed] [Google Scholar]