Abstract
To use subharmonic imaging (SHI) to depict the vascularity of pancreatic masses compared to contrast-enhanced endoscopic ultrasound (EUS) and pathology.
Sixteen patients scheduled for biopsy of a pancreatic mass were enrolled in an IRB-approved study. Pulse-inversion SHI (transmitting/receiving at 2.5/1.25MHz) was performed on a Logiq 9 system (GE Healthcare, Milwaukee, WI) with a 4C probe, while contrast harmonic EUS (transmitting/receiving at 4.7/9.4MHz) was performed with a radial endoscope (GF-UTC180; Olympus, Tokyo, Japan) connected to a ProSound SSD α-10 scanner (Hitachi-Aloka, Tokyo, Japan). Two injections of the contrast agent Definity (Lantheus Medical Imaging, N Billerica, MA) were administrated (0.3–0.4ml and 0.6–0.8ml for EUS and SHI). Contrast-to-tissue ratios (CTRs) in the mass and an adjacent vessel were calculated. Four physicians independently scored the images (benign to malignant) for diagnostic accuracy and inter-reader agreement.
One subject dropped out before imaging, leaving 11 adenocarcinoma, 1 gastrointestinal stromal tumor with pancreatic infiltration and 3 benign masses. Marked subharmonic signals were obtained in all subjects with intra-tumoral blood flow clearly visualized using SHI. Significantly greater CTRs were obtained in the masses with SHI than with EUS (1.71±1.63 vs 0.63±0.89; p=0.016). There were no differences in CTR in the surrounding vessels or when grouped by pathology (p>0.60). The accuracies for contrast-EUS and SHI were low (<53%); albeit with a greater kappa value for SHI (0.34) than for EUS (0.13).
Diagnostic accuracy of contrast-EUS and trans-abdominal SHI for assessment of pancreatic masses was quite low in this pilot study. However, SHI demonstrated improved tumoral CTRs relative to contrast-EUS.
Keywords: Subharmonic imaging, endoscopic contrast ultrasound, pancreatic cancer
Introduction
With 53,070 new cases expected in 2016, pancreatic adenocarcinoma is among the most common cancers diagnosed in the United States [1]. It is the fourth leading cause of cancer-related death in both men and women, with nearly 41,780 deaths this year and five year survival rates at around 5 % [1–3]. One of the reasons that the mortality rate nearly parallels the incidence is that only 15 to 20 % of patients are considered resectable at the time of diagnosis. Another 20 to 25 % have locally advanced disease that is not amenable to surgical resection, and nearly half of patients present with metastatic disease (mainly to the liver) [1, 4]. Despite the “curative” intent of treatment for patients who present with surgically amenable pancreatic cancer, even when undergoing resection followed by adjuvant systemic therapy (with or without radiation), their median overall survival is still only 15 months [5]. Although endoscopic ultrasound (EUS) is frequently the imaging mode used for managing pancreatic cancer [6], to date there are no established guidelines for screening patients at high risk for developing pancreatic cancer [4, 6] with tests that are cost effective and have a high sensitivity and specificity. Hence, the long-term goal of this project is to develop such a screening technique based on contrast enhanced ultrasound (CEUS) imaging.
While contrast-enhanced EUS is a widely used technology in Europe and Asia, it is still not standard of care in the United States, due in part to the lack of approved contrast agents and contrast-specific EUS imaging equipment [6]. There are currently 3 ultrasound contrast agents approved by the United States’ Food and Drug Administration (FDA) for cardiology and radiology applications (the latter involves only one contrast agent, which was approved as recently as April of 2016). These agents consist of encapsulated gas microbubbles (< 8 µm in diameter) and have been shown to produce marked nonlinear signals at higher acoustic pressures (> 0.5 MPa), which are used in contrast-specific CEUS imaging modes [7–9]. Harmonic imaging (HI), transmitting at the fundamental frequency (f0) and receiving at the second harmonic (2f0), is one such CEUS imaging technique that is available on many commercial ultrasound scanners. However, HI suffers from reduced blood-to-tissue contrast caused by second harmonic generation in tissue [10]. Hence, subharmonic imaging (SHI), transmitting at the fundamental frequency (f0) and receiving at the subharmonic (f0/2), becomes an attractive alternative contrast-specific imaging mode (even with the reduced axial resolution relative to HI), due to a lack of subharmonic signals generated by the tissue [11–22]. Contrast studies of women with breast lesions (in up to 134 subjects) have demonstrated that SHI can detect the neovascularity associated with tumors with greater sensitivity than HI [12–14]. Moreover, a study in 45 patients with liver disease has shown that SHI can be successfully performed in the abdomen at depths up to 12 cm [15].
Thus, this pilot study investigated the feasibility of using contrast-enhanced, trans-abdominal SHI to depict pancreatic masses in patients scheduled for an endoscopically guided biopsy of a pancreatic mass. Results were compared to contrast-enhanced EUS as well as to pathology.
Material and Methods
Subjects
This pilot study enrolled 16 patients scheduled for an EUS-guided biopsy of a mass located in the head of the pancreas. The study was conducted during a 12 month period from May, 2014 to May of 2015. Before enrollment, each patient gave written informed consent. The study was approved by the University’s Institutional Review Board and was compliant with the Health Insurance Portability and Accountability Act. The mean age of the patients (9 female and 7 male) participating in the study was 67 years (range: 27 – 88 years; Table 1).
Table 1.
Patient population and biopsy results
| Patient ID | Gender | Age (years) | Tumor diameter (cm) |
Diagnosis |
|---|---|---|---|---|
| 1 | F | 78 | 3.65 | adenocarcinoma |
| 2 | M | 75 | 2.33 | adenocarcinoma |
| 3 | M | 61 | 2.93 | adenocarcinoma |
| 4 | F | 71 | 2.01 | adenocarcinoma |
| 5 | M | 72 | 3.56 | adenocarcinoma |
| 6 | F | 61 | 2.30 | chronic pancreatitis |
| 7 | M | 88 | 2.26 | adenocarcinoma |
| 8 | M | 27 | 6.37 | GIST with pancreatic infiltration |
| 9 | F | 68 | 5.31 | duodenitis & hyperplasia |
| 10 | F | 65 | 3.27 | adenocarcinoma |
| 11 | F | 67 | 3.73 | adenocarcinoma |
| 12 | F | 70 | 3.48 | chronic inflammation & fibrosis with gastric infiltration |
| 13 | F | 76 | 2.75 | adenocarcinoma |
| 14 | M | 67 | 3.27 | adenocarcinoma |
| 15 | F | 55 | 4.36 | adenocarcinoma |
This study was supported by Lantheus Medical Imaging (N Billerica, MA), which provided the ultrasound contrast agent used. However, the authors of this manuscript had sole control of the data generated by this trial and the information provided for publication.
Data acquisition
A Logiq 9 scanner (GE Healthcare, Milwaukee, WI) with a 4C probe was modified to operate in dual 4.0 MHz grayscale and pulse-inversion, grayscale SHI modes (to allow for simultaneous depiction of anatomy and contrast enhanced vascularity) with the latter mode transmitting 4 cycle pulses at 2.5 MHz and receiving with a 1 MHz wide bandpass filter centered at 1.25 MHz [16]. A 0.5 mm needle hydrophone (Precision Acoustics, UK) was used to establish that the maximum acoustic output pressure level was 3.34 MPa (peak to peak equivalent to a mechanical index or MI of 0.8) [15]. However, based on our previous experiences, the acoustic output power for SHI was kept below 25% (to minimize bubble destruction) [17]. The remaining parameters used for image acquisition were selected on an individual basis to optimize image quality by a sonographer with more than 15 years of experience (MS or TF).
The midline of the pancreatic mass was located (using conventional, individually optimized grayscale imaging), while also including some adjacent normal pancreatic tissue in the field of view. Prior to injection, lesion size (height, length and width) was measured. For CEUS, the midline imaging plane was maintained and the ultrasound contrast agent Definity (Lantheus Medical Imaging, N Billerica, MA) was injected (dose: 0.6–0.8 mL) through an antecubital vein followed by a 10 mL saline flush. The FDA has approved Definity, which consists of phospholipid shelled, octaflouropropane microbubbles approximately 1.1 to 3.3 µm in diameter [23], for use in echocardiography and it was used off-label in this study. The complete contrast wash-in and wash-out was imaged in SHI mode and a digital clip acquired (typically 45 – 75 seconds) for subsequent off-line analysis.
Next the subjects were intubated with a radial echoendoscope (GF-UTC180; Olympus, Tokyo, Japan) connected to a ProSound SSD α-10 scanner (Hitachi-Aloka, Tokyo, Japan) as part of their standard of care. The echoendoscope was advanced until the target lesion was identified and its features fully characterized for clinical purposes. Prior to the biopsy, state-of-the art, contrast harmonic EUS (transmitting at 4.7 MHz and receiving at 9.4 MHz) was performed at low acoustic power (an MI < 0.25) following a second injection of Definity (dose: 0.3–0.4 mL) [24, 25]. The time between injections was at least 10 minutes to allow the agent to clear the blood pool. A 1–2 minute digital clip of the contrast wash-in and wash-out was acquired for comparison to SHI and to the biopsy results.
Data analysis
In order to quantify the ability of the two imaging modes to delineate between the mass and the normal pancreas, the contrast-to-tissue ratio (CTR) at peak contrast enhancement was used. The CTR is defines as [26]:
| (1) |
where µtand µn represents the mean image signal strength in the target (here the mass) and within normal pancreatic tissue, respectively; σ2tand σ2n represents the variance in the respective regions calculated based on region-of-interest (ROI) selections. For all subjects and both imaging modes, a circular ROI (10 mm in diameter) was placed in the mass and compared (one at a time) to 2 ROIs placed within the normal pancreatic tissues using ImageJ (v 1.48; NIH, Bethesda, MD) and eqn. (1). Likewise, a 10 mm ROI was placed on an adjacent large, normal vessel outside of the mass and compared to the same 2 pancreatic tissue ROIs as described above in order to evaluate the impact of contrast concentration. Results were compared by location, by imaging mode and by pathology with unpaired t-tests assuming a 5 % significance level (using Stata 12; Stata Corp, College Station, TX).
Next, two board-certified gastroenterologists specializing in EUS (with 11 and 17 years of experience, respectively) and two board-certified body imaging radiologists (with 14 and 19 years of experience) blinded to the pathological findings independently evaluated the real-time CEUS clips (i.e., 2 assessments for contrast EUS and 2 for SHI). The 4 physicians all had 10+ years of experience in CEUS. Off-line diagnoses were made based on a five-point scale: 1) benign, 2) probably benign, 3) indeterminate, 4) probably malignant, and 5) malignant with hypo-enhancing lesions considered more likely to be malignant, while iso- and hyper-enhancing masses were considered more benign characteristics [25, 28]. The vascular density and morphology relative to the surrounding normal pancreatic tissues were also considered. The accuracy of the imaging diagnoses was analyzed using receiver operating characteristics (ROC) analyses [27]. Differences between ROC curves were tested by computing Mann-Whitney statistics, while inter-reader agreement was assessed by calculating the kappa-statistic (using Stata 12).
Results
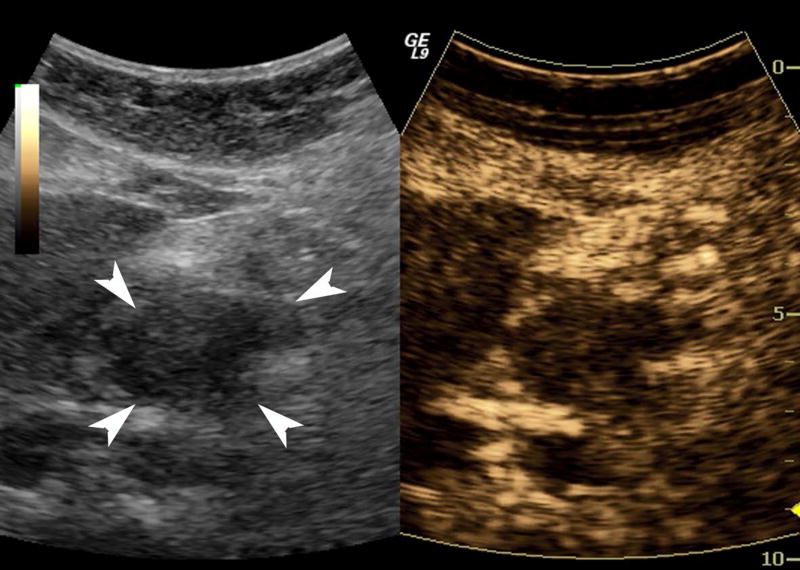
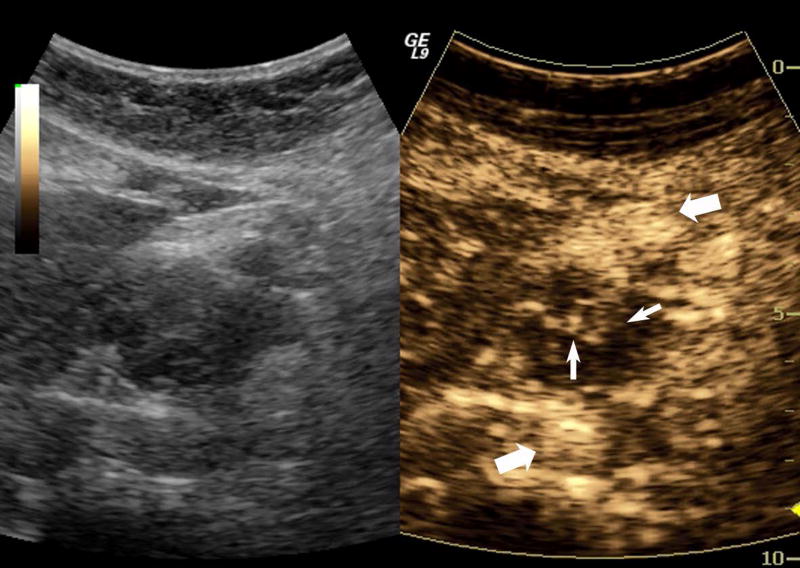
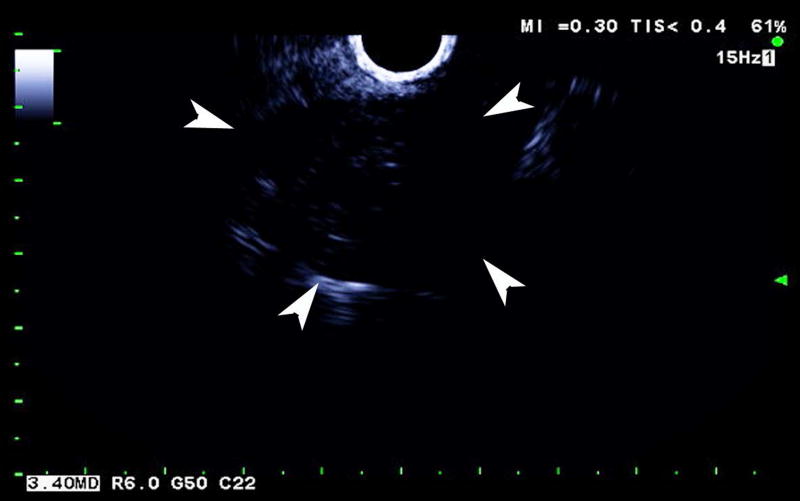
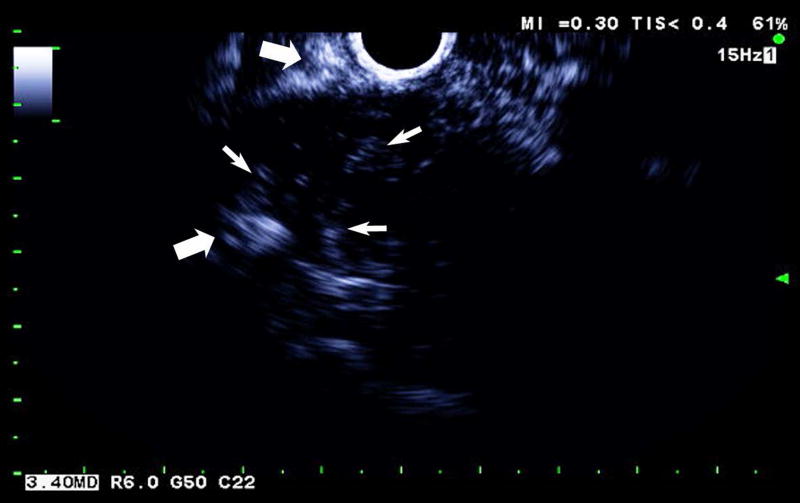
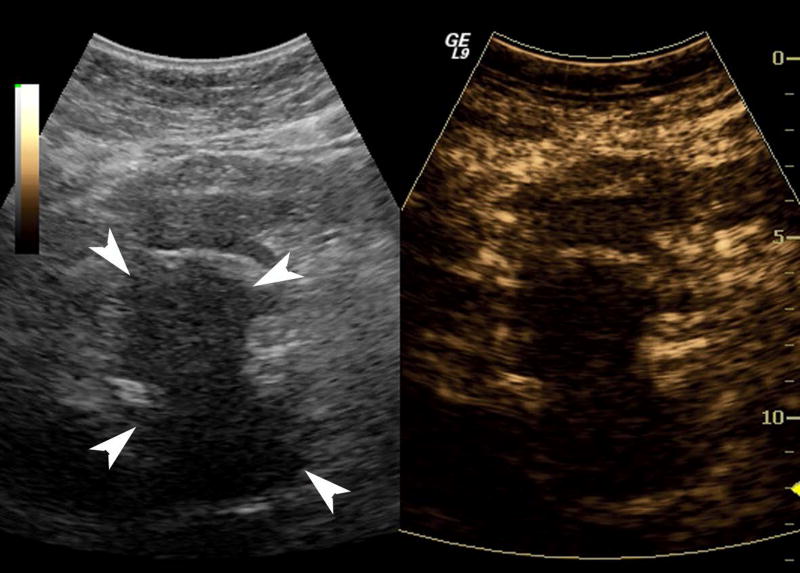
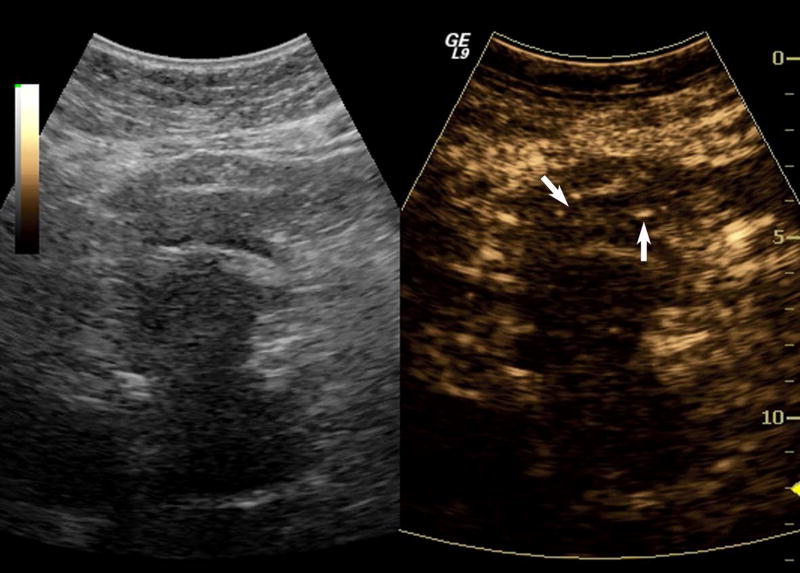
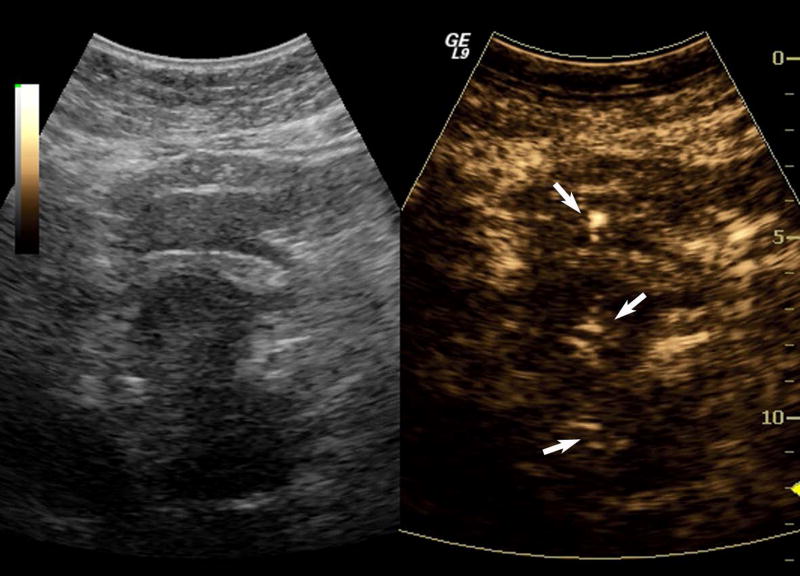
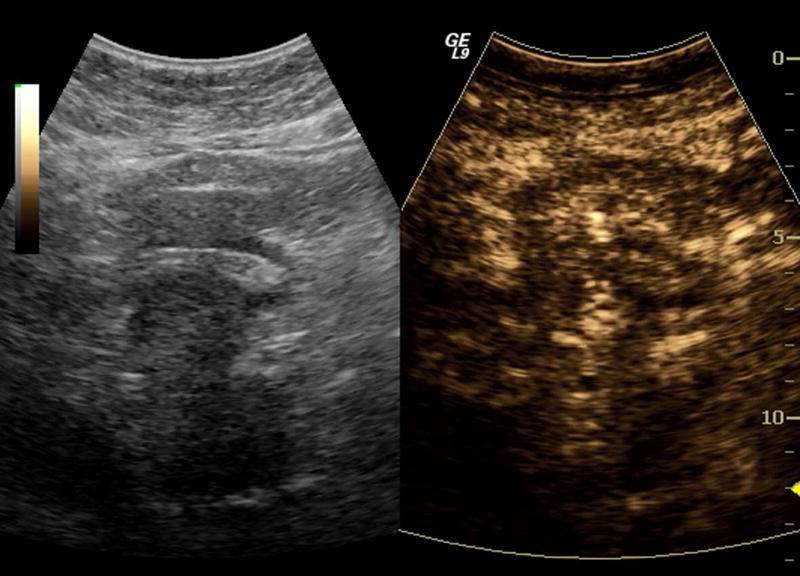
One subject dropped out before imaging was initiated, leaving 15 subjects with an average lesion diameter of 3.07 cm (range: 1.39 – 6.37 cm) who completed this pilot study. The pathological reference standard found 11 adenocarcinoma, 1 gastrointestinal stromal tumor (GIST) with pancreatic infiltration and 3 benign masses (Table 1). Marked subharmonic signals and reasonable tissue-suppression were obtained in all subjects with intra-tumoral blood flow clearly visualized using SHI as demonstrated in the example of Figure 1. While larger vessels external to the pancreatic mass were seen with both EUS and SHI, smaller neovessels in the mass were more easily visualized with SHI; in spite of the reduced axial resolution and deeper scanning depths of SHI relative to EUS (compare Figs. 1b and 1d). Moreover, the larger field of view associated with SHI was particularly useful in depicting anatomical relationships on a greater scale than EUS, such as the gastric inflow into a GIST tumor with pancreatic infiltration (Figure 2).
Figure 1.
A pancreatic adenocarcinoma (arrowheads) scanned in dual grayscale/SHI mode (SHI is depicted in golden hues on the right) before (a) and after (b) injection of Definity. The size of this tumor was approximately 3.0×4.0×4.4 cm. The same lesion depicted in contrast EUS mode before (c) and after (d) contrast administration. Notice, the larger vessels (large arrows) external to the cancer seen with both EUS and SHI, while smaller neovessels inside the mass are more prominent in SHI mode (small arrows).
Figure 2.
Large GIST tumor with pancreatic infiltration (around 6.4 cm in diameter; arrowheads) imaged with dual grayscale/SHI (SHI is depicted in golden hues on the right) (a) pre-contrast administration, (b) 21.25 seconds after Definity injection as the initial microbubbles appear outside the pancreas (arrows) and (c) 0.5 seconds later the bubbles are seen spreading deeper into the mass (arrows) followed by (d) complete enhancement of the tumor 3 seconds later (24.25 seconds post-injection).
Significantly greater CTRs were obtained in the pancreatic masses with SHI than with EUS (1.71 ± 1.63 vs 0.63 ± 0.89; p = 0.016; Table 2), while there were no differences in CTR when comparing the enhancement of the adjacent large, normal vessels (p = 0.72; Table 2). Together these results indicate that contrast concentration is not a factor and that trans-abdominal SHI is able to depict smaller neovessels inside a pancreatic mass better than contrast EUS (as also demonstrated in Figure 1). When the CTR values were grouped by pathology into benign and malignant cases no statistical differences were found for either imaging mode (0.60 ± 0.88 vs 0.64 ± 0.91 and 1.25 ± 2.03 vs 1.63 ± 1.49 for EUS and SHI, respectively; p > 0.60). The diagnostic accuracies for contrast EUS and for SHI (in the form of the area under the ROC curve – Az) were quite low at 0.09 and 0.52 as well as 0.32 and 0.45, respectively (Table 3). The Az of one of the EUS readers was lower than those based on SHI (p < 0.005). No other Az comparisons were significant (p > 0.05). The inter-reader agreement was greater for SHI than for EUS (0.34 vs 0.13; Table 3).
Table 2.
CTR values for EUS and SHI comparisons.
| CTR | EUS | SHI | p-value |
|---|---|---|---|
| mass vs tissue | 0.63 ± 0.89 | 1.71 ± 1.63 | 0.016 |
| vessel vs tissue | 5.50 ± 5.69 | 5.01 ± 3.85 | 0.72 |
Table 3.
Diagnostic accuracy (ROC analysis) and inter-reader agreement.
| EUS | SHI | |||
|---|---|---|---|---|
| Reader 1 | Reader 2 | Reader 3 | Reader 4 | |
| Az | 0.52 | 0.09* | 0.33 | 0.46 |
| κ (% agreement) | 0.13 (38 %) | 0.34 (80 %) | ||
p < 0.005 vs. SHI (i.e., reader 2 vs. readers 3 or 4).
Discussion
In this pilot study, trans-abdominal SHI improved (quantified via the CTR metric) the depiction of contrast microbubbles in the small angiogenic neovessels associated with pancreatic masses compared to contrast EUS (Figure 1 and Table 2) allowing the tortuous morphology of tumor angiogenesis [7] to be visualized in greater detail. Moreover, the increased field of view with SHI was shown to be useful for providing a detailed overview of the vascular supply to pancreatic lesions (cf., Figure 2). These results are in agreement with our prior experiences in breast imaging, where SHI was found to detect tumor neovascularity with greater sensitivity than HI (i.e., the technology imbedded in contrast EUS) [12–14]. In vivo SHI CTR values of 5.74 ± 1.92 were previously reported by Eisenbrey and colleagues [18], which is greater than the 1.71 ± 1.63 measured in this pilot study. However, the former CTR values were obtained in an open abdomen canine renal model and the discrepancies observed are most likely due to the attenuation and contrast concentration (i.e., flow) differences between a human pancreas and a dog kidney. Thus, contrast enhanced SHI appears to depict pancreatic masses better than contrast EUS (at least for lesions located in the head of the pancreas).
The diagnostic accuracy of SHI and contrast EUS was rather low (Az < 0.55) in this small pilot study of 15 subjects (Table 3). Results from this study also demonstrated greater agreement between readers of SHI (80 %) compared to EUS (38 %; cf., Table 2). While this is (to the best of our knowledge) the first report on SHI of pancreatic cancers in patients, contrast EUS has been studied more extensively. One recent study of 147 pancreatic masses imaged with contrast EUS reported a sensitivity of 94 % and a specificity of 71 % [25]. A meta-analysis of 12 studies involving 1139 patients found a similar diagnostic accuracy of 0.97 based on ROC analysis with a pooled sensitivity and specificity of 94 % and 89 %, respectively [28]. Most likely the small sample size in this pilot study accounts for most of these differences.
Nonetheless, these results indicate that the clinical niche for SHI may be earlier in the management of pancreatic lesions. Currently, contrast enhanced computed tomography (CT) is used as the first line imaging modality for the pancreas [29]. However, ultrasound microbubble based contrast agents are exceptionally safe vascular tracers and, unlike CT with contrast, have very few contraindications (typically involving allergies to the gas encapsulation material) and involve no radiation. Moreover, the higher frame rates (i.e., temporal resolution) of ultrasound (including SHI) relative to CT will permit better quantification of blood flow kinetics. Finally, the sensitivity and specificity for CT detection of pancreatic masses is reported to range from 68 % to 86 % and from 50 % to 64 % making it lower than that of contrast EUS reported in the literature (94% and 89%, respectively) [28, 29]. Consequently, SHI may be a better imaging mode for the initial assessment of pancreatic lesions followed by a biopsy under EUS guidance (if required) and future studies should compare SHI and CT for this application.
Additionally, the improved depiction of pancreatic tumor neovascularity may be useful in determining whether or not a lesion is resectable as well as monitoring response to treatment in patients not eligible for surgical resection. If there are no distant metastases, the decision to resect a pancreatic tumor or not is largely driven by which vessels are involved (most critically the superior mesenteric artery and vein as well as the celiac and hepatic arteries) [29, 30]. These assessments can sometimes be difficult to resolve with CT or MRI and CEUS might improve specificity. This will be a topic for future investigations.
In conclusion, contrast enhanced SHI can potentially be employed as an imaging tool for identifying the vascularity of pancreatic masses. In this pilot study, SHI demonstrated improved tumoral CTRs relative to contrast EUS. However, the diagnostic accuracy of both contrast EUS and trans-abdominal SHI for assessment of pancreatic masses was quite low in this small population. While the long-term aim of this project is to develop a CEUS based screening technique for patients at high risk of developing pancreatic adenocarcinoma, it is first necessary to establish the utility of CEUS/SHI in characterizing pancreatic lesions, before beginning a trial to investigate whether these techniques aide in lesion detection. Hence, future efforts should initially be directed at comparing CT and SHI for imaging pancreatic masses or for monitoring the treatment response of pancreatic adenocarcinoma with SHI.
Acknowledgments
Supported in part by NIH R01 CA199646. Definity was supplied by Lantheus Medical Imaging, N. Billerica, MA.
References
- 1.Siegel RL, Miller KD, Jemal A. Cancer statistics, 2016. CA Cancer J Clin. 2012;66:7–30. doi: 10.3322/caac.21332. [DOI] [PubMed] [Google Scholar]
- 2.Cleary SP, Gryfe R, Guindi M, et al. Prognostic factors in resected pancreatic adenocarcinoma: analysis of actual 5-year survivors. J. Am. Coll. Surg. 2004;198:722–731. doi: 10.1016/j.jamcollsurg.2004.01.008. [DOI] [PubMed] [Google Scholar]
- 3.Kotopoulis S, Dimcevski G, Gilja OH, Hoem D, Postema M. Treatment of human pancreatic cancer using combined ultrasound, microbubbles, and gemcitabine: a clinical case study. Med Phys. 2013;40:072902. doi: 10.1118/1.4808149. [DOI] [PubMed] [Google Scholar]
- 4.Klein AP. Identifying people at a high risk of developing pancreatic cancer. Nat Rev Cancer. 2013;13:66–74. doi: 10.1038/nrc3420. [DOI] [PMC free article] [PubMed] [Google Scholar]
- 5.Yeo CJ, Cameron JL, Lillemoe KD, et al. Pancreaticoduodenectomy for cancer of the head of the pancreas. 201 patients. Ann Surg. 1995;221:721–731. doi: 10.1097/00000658-199506000-00011. [DOI] [PMC free article] [PubMed] [Google Scholar]
- 6.Luz LP, Al-Haddad MA, Sey MS, DeWitt JM. Applications of endoscopic ultrasound in pancreatic cancer. World J Gastroenterol. 2014;20:7808–7818. doi: 10.3748/wjg.v20.i24.7808. [DOI] [PMC free article] [PubMed] [Google Scholar]
- 7.Eisenbrey JR, Forsberg F. Contrast-enhanced ultrasound for molecular imaging of angiogenesis. Eur J Nuc Med Mol Imaging. 2010;37:138–146. doi: 10.1007/s00259-010-1449-6. [DOI] [PubMed] [Google Scholar]
- 8.Davidson BP, Lindner JR. Future applications of contrast echocardiography. Heart. 2012;98:246–253. doi: 10.1136/heartjnl-2011-300737. [DOI] [PMC free article] [PubMed] [Google Scholar]
- 9.Nolsøe CP, Lorentzen T. International guidelines for contrast-enhanced ultrasonography: ultrasound imaging in the new millennium. Ultrasonography. 2016;35:89–103. doi: 10.14366/usg.15057. [DOI] [PMC free article] [PubMed] [Google Scholar]
- 10.Hamilton MF, Blackstock DT. Nonlinear acoustics. San Diego: Academic Press; 1998. [Google Scholar]
- 11.Forsberg F, Shi WT, Goldberg BB. Subharmonic imaging of contrast agents. Ultrasonics. 2000;38:93–98. doi: 10.1016/s0041-624x(99)00148-1. [DOI] [PubMed] [Google Scholar]
- 12.Forsberg F, Piccoli CW, Merton DA, Palazzo J, Hall AL. Breast lesions: imaging with contrast-enhanced subharmonic US - initial experience. Radiology. 2007;244:718–726. doi: 10.1148/radiol.2443061588. [DOI] [PubMed] [Google Scholar]
- 13.Dave JK, Forsberg F, Fernandes S, et al. Static and dynamic cumulative maximum intensity display mode for subharmonic breast imaging - a comparative study with mammography and conventional ultrasound techniques. J Ultrasound Med. 2010;29:1177–1185. doi: 10.7863/jum.2010.29.8.1177. [DOI] [PubMed] [Google Scholar]
- 14.Sridharan A, Eisenbrey JR, Machado P, et al. Quantitative analysis of vascular heterogeneity in breast lesions using contrast-enhanced three-dimensional harmonic and subharmonic ultrasound imaging. IEEE Trans Ultrason, Ferroelec Freq Control. 2015;62:502–510. doi: 10.1109/tuffc.2014.006886. [DOI] [PMC free article] [PubMed] [Google Scholar]
- 15.Eisenbrey JR, Dave JK, Halldorsdottir VG, et al. Chronic liver disease: noninvasive subharmonic aided pressure estimation of hepatic venous pressure gradient. Radiology. 2013;268:581–588. doi: 10.1148/radiol.13121769. [DOI] [PMC free article] [PubMed] [Google Scholar]
- 16.Eisenbrey JR, Dave JK, Halldorsdottir VG, et al. Simultaneous grayscale and subharmonic ultrasound imaging on a modified commercial scanner. Ultrasonics. 2011;51:890–897. doi: 10.1016/j.ultras.2011.05.003. [DOI] [PMC free article] [PubMed] [Google Scholar]
- 17.Halldorsdottir VG, Dave JK, Leodore LM, et al. Subharmonic contrast microbubble signals for noninvasive pressure estimation under static and dynamic flow conditions. Ultrason Imaging. 2011;33:153–164. doi: 10.1177/016173461103300301. [DOI] [PMC free article] [PubMed] [Google Scholar]
- 18.Eisenbrey JR, Sridharan A, Machado P, et al. Three-dimensional subharmonic ultrasound imaging in vitro and in vivo. Acad Radiol. 2012;19:732–739. doi: 10.1016/j.acra.2012.02.015. [DOI] [PMC free article] [PubMed] [Google Scholar]
- 19.Shankar PM, Krishna PD, Newhouse VL. Advantages of subharmonic over second harmonic backscatter for contrast-to-tissue echo enhancement. Ultrasound Med Biol. 1998;24:395–399. doi: 10.1016/s0301-5629(97)00262-7. [DOI] [PubMed] [Google Scholar]
- 20.Chomas J, Dayton P, May D, Ferrara K. Nondestructive subharmonic imaging. IEEE Trans. Ultrason. Ferroelec. Freq. Contr. 2002;49:883–892. doi: 10.1109/tuffc.2002.1020158. [DOI] [PubMed] [Google Scholar]
- 21.Goertz DE, Frijlink ME, Tempel D, et al. Subharmonic contrast intravascular ultrasound for vasa vasorum imaging. Ultrasound Med Biol. 2007;33:1859–1872. doi: 10.1016/j.ultrasmedbio.2007.05.023. [DOI] [PubMed] [Google Scholar]
- 22.Faez T, Emmer M, Docter M, et al. Characterizing the subharmonic response of phospholipid-coated microbubbles for carotid imaging. Ultrasound Med Biol. 2011;37:958–970. doi: 10.1016/j.ultrasmedbio.2011.02.017. [DOI] [PubMed] [Google Scholar]
- 23.Miller AP, Nanda NC. Contrast echocardiography: new agents. Ultrasound Med Biol. 2004;30:425–434. doi: 10.1016/j.ultrasmedbio.2003.12.002. [DOI] [PubMed] [Google Scholar]
- 24.Dietrich CF, Ignee A, Frey H. Contrast-enhanced endoscopic ultrasound with low mechanical index: a new technique. Z Gastroenterol. 2005;43:1219–1223. doi: 10.1055/s-2005-858662. [DOI] [PubMed] [Google Scholar]
- 25.Yamashita Y, Kato J, Ueda K, et al. Contrast-enhanced endoscopic ultrasonography for pancreatic tumors. Biomed Res Int. 2015;2015:491782. doi: 10.1155/2015/491782. [DOI] [PMC free article] [PubMed] [Google Scholar]
- 26.Hill CR, Bamber JC, Cosgrove DO. Performance criteria for quantitative ultrasonography and image parameterisation. Clin Phys Physiol Meas. 1990;11(Suppl A):57–73. doi: 10.1088/0143-0815/11/4a/307. [DOI] [PubMed] [Google Scholar]
- 27.Metz CE. ROC methodology in radiologic imaging. Invest Radiol. 1986;21:720–733. doi: 10.1097/00004424-198609000-00009. [DOI] [PubMed] [Google Scholar]
- 28.Gong TT, Hu DM, Zhu Q. Contrast-enhanced EUS for differential diagnosis of pancreatic mass lesions: a meta-analysis. Gastrointest Endosc. 2012;76:301–309. doi: 10.1016/j.gie.2012.02.051. [DOI] [PubMed] [Google Scholar]
- 29.Xu MM, Sethi A. Imaging of the pancreas. Gastroenterol Clin North Am. 2016;45:101–116. doi: 10.1016/j.gtc.2015.10.010. [DOI] [PubMed] [Google Scholar]
- 30.Martin RC., 2nd Management of locally advanced pancreatic cancer. Surg Clin North Am. 2016;96:1371–1389. doi: 10.1016/j.suc.2016.07.010. [DOI] [PubMed] [Google Scholar]


