Abstract
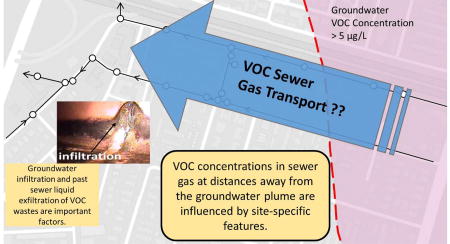
Sewer systems have been recently recognized as potentially important exposure pathways to consider during vapor intrusion assessments; however, this pathway has not been well-characterized and there is need for additional information about the occurrence of volatile organic compounds (VOCs) in sewer systems. This paper reports the results of sewer gas sampling conducted in a sanitary sewer over the years of 2014–2017. Sewer gas samples were collected and analyzed using several different techniques, including TO-15 (grab), TO-17 (passive), Radiello® (passive) and a novel continuous monitoring technique, the Autonomous Rugged Optical Multigas Analyzer (AROMA). The applicability of each of the different approaches used in this study is discussed in the context of investigating sanitary sewers as a vapor intrusion alternative pathway. The data confirmed that trichloroethylene (TCE) concentrations in sewer gas were detected adjacent to and extending hundreds of feet away from a previously defined vapor intrusion area, where TCE was a primary contaminant. TCE concentrations detected in sewer gas ranged from non-detect to 1600 µg/m3. Temporal variability was observed in TCE concentrations over timescales that ranged from minutes to months to years at discrete sampling locations. Spatial variability in sewer gas concentrations was also observed throughout the study area. Temporal and spatial variability may be caused by groundwater contamination sources in the study area, as well as sewer gas transport mechanisms.
Keywords: Vapor intrusion, sewer systems, trichloroethylene, sampling methods
Graphical abstract
1. Introduction
Commonly, vapor intrusion (VI) has been conceptualized as the entry of volatile organic compound (VOC) vapors into overlying buildings through cracks in foundations and basements; however, alternative entry pathways, such as piping systems connected to sewers, are being increasingly identified as important pathways for VI (e.g. Riis et al., 2010; Pennell et al., 2013; Guo et al., 2015; EPA, 2015a; Jacobs et al., 2015; McHugh et al., 2017) . VOC transfer into sewer systems can be either intermittent or continuous. VOCs present in soil vapors or groundwater can infiltrate sewer systems through cracks and other openings. In addition, VOCs can be discharged directly to sewers from a variety of sources, such as groundwater remediation system effluents and other legal (or even illegal) discharge sources.
Once VOCs have entered sanitary sewer systems, there are many pathways by which they can unintentionally enter back into the environment. VOCs in sewers can exit through cracks in sewer pipes and contaminate subsurface soil and groundwater. VOCs can also be transported through sanitary sewer systems and vapors can migrate through indoor plumbing systems that are not properly maintained and sealed, as documented by Riis et al. (2010), Pennell et al. (2013) and McHugh et al. (2017).
Theoretically, in buildings with perfectly installed and maintained plumbing systems, the sewer gas to indoor air pathway would not be complete. Nevertheless, imperfections in plumbing systems could lead to VOC entry into indoor air spaces. Ultimately, exposure risks from this pathway would depend on many factors—importantly, building air exchange rates and the rate of sewer gas entry into indoor air spaces. Understanding inhalation exposure risks due to VOC vapors entering indoor air spaces through sanitary and other plumbing systems at VI sites is a growing interest (EPA 2015a). Beyond the United States, the Denmark has identified sewer systems as an important alternative VI exposure pathway at more than 20% of contaminated drycleaner sites in the Central Denmark Region (Nielsen and Hvidberg, 2017).
VI alternative pathways are important to the national issue of aging infrastructure. In 2017, the American Society of Civil Engineers (ASCE) issued an infrastructure report card for the United States (US), assigning a D+ grade for wastewater in part due to many of the challenges aging sewer lines pose for modern cities (ASCE, 2017). Over 800,000 miles of sewer mains exist in the US, with an additional 500,000 miles of sewer laterals (i.e. pipes that connect buildings to the mains). The sanitary sewer pipe system investigated in this research study serves a neighborhood in the South San Francisco Bay area and is an example of the aging infrastructure issue. The sanitary sewer system is constructed of vitrified clay pipe (VCP), which is known to crack and leak over time, and was installed in the 1950s (with upgrades in the 1960s). The sewer system historically received concentrated hazardous chemicals discharged as part of the semiconductor and electronics manufacturing industry.
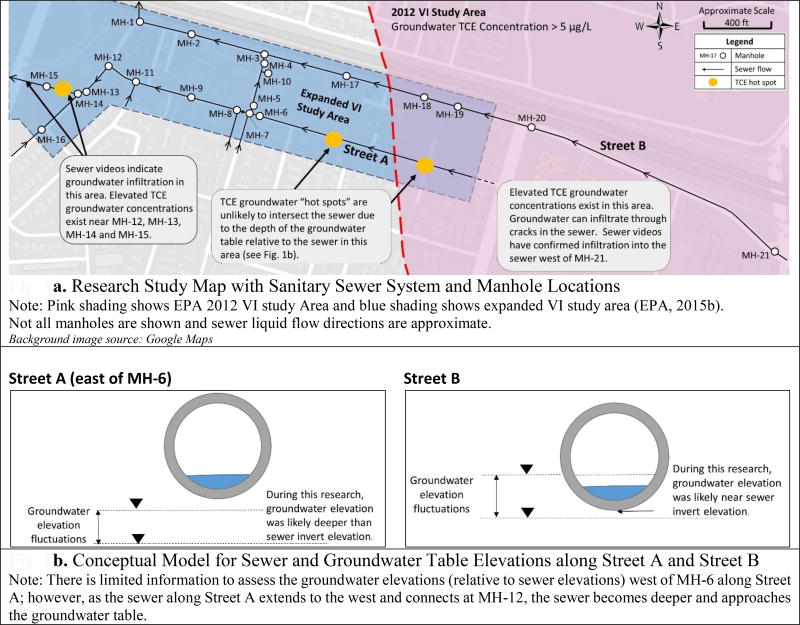
Extensive groundwater contamination exists near the study area, including a large TCE groundwater plume (>5 µg/L) (EPA, 1989; EPA, 2010). A portion (see pink shading) of the 1.5-mile (north-south) chlorinated solvent groundwater plume is shown on Fig. 1a. In the mid-2000s, subsurface contamination was discovered outside the well-delineated TCE groundwater plume; and, the historic release of TCE to the sewer system was identified as by EPA as the source of TCE “hot spots” throughout the neighborhood to the west (CPEO, 2013; CPEO, 2014; EPA 2015b; Bureau Veritas, 2013; Cornerstone Earth Group, 2017). As shown on Fig. 1a, the Environmental Protection Agency’s (EPA) VI study area was expanded beyond the extent of the TCE groundwater plume to include the portion of the neighborhood where TCE “hot spots” had been identified (EPA, 2015b). This research study included sampling in the residential area within the expanded VI study area (see blue shading).
Fig. 1.
a. Research Study Map with Sanitary Sewer System and Manhole Locations
b. Conceptual Model for Sewer and Groundwater Table Elevations along Street A and Street B
Fig. 1a and Fig. 1b provide a preliminary site conceptual model for TCE contaminated groundwater infiltrating into the sewer system. Fig. 1b shows, conceptually, a range of historic groundwater fluctuations relative to the sewers along Street A and Street B. While VOC vapors in soil gas can potentially enter the sewer through diffusive and/or convective transport, groundwater entry is assumed to be a more significant source of VOCs in the sewer system. Once groundwater enters the sewer system, VOC vapors can be transported by convective and diffusive processes within the sewer system. Sewer gas can leave through sewer ventilation processes, which act to dilute the VOC concentrations in the sewer gas. As shown on Fig. 1b, Street B has more potential for groundwater infiltration than Street A based on groundwater and sewer main elevations; however, it is important to note that the groundwater near MH-12, MH-13, MH-14, and MH-15 also likely intersects the sewer system, which has important implications for this site.
Through the Freedom of Information Act (FOIA), EPA recently made sewer videos publicly available. These videos indicate multiple cracks exist throughout the sewer system and infiltration/exfiltration is possible into/from the sewer system (FOIA, 2017). Importantly, cracks exist west of MH-21 within the TCE plume, as shown on Fig. 1a. These cracks allow contamination to leak into and out of the sewer system. Videos also confirm groundwater infiltration east and west of MH-15 near an identified TCE groundwater “hot spot.” Cracks were also observed in other locations throughout the sewer system, but for simplification purposes are not explicitly shown on Fig. 1a.
This research study developed the preliminary conceptual model shown in Fig. 1a and 1b to evaluate VOC concentrations in the sanitary sewer system collected using different methods for sewer gas sampling (e.g. passive, grab and continuous). In addition, this study specifically addresses the lack of information about how often alternative VI pathways exist, and provides one of the few attempts to document the occurrence and variability of VOCs in sanitary sewer gas. The data herein also provides critical information about temporal and spatial variability of sewer gas concentrations. This information is needed to ultimately inform about developing appropriate sampling strategies, which are still emerging.
2. Methods and materials
2.1 Field sampling manholes and cleanouts
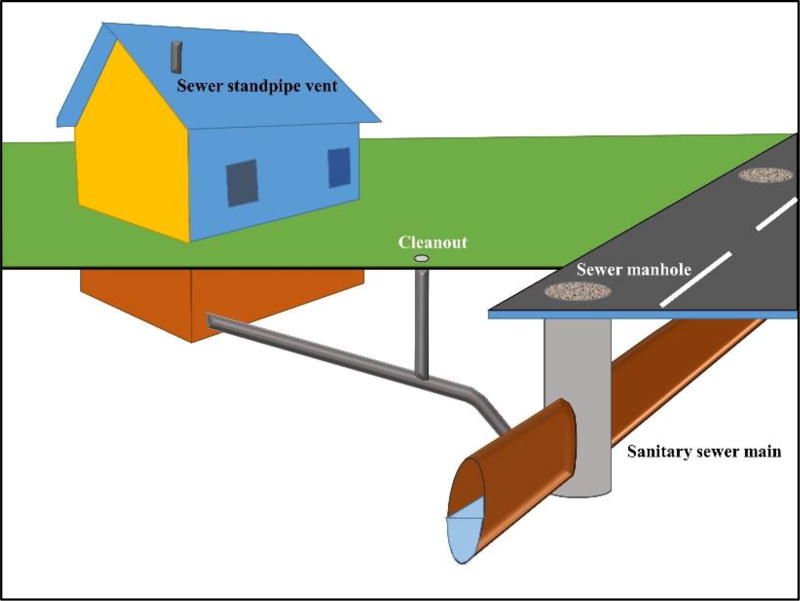
A total of nineteen (19) manholes and twenty (20) cleanouts were sampled as part of this study. Cleanouts were located along sewer laterals and manholes were located in the street along sewer mains (Fig. 2). Passive, grab and continuous sampling methods were utilized at both cleanouts and manholes. Manhole covers were left in place throughout all sampling activities. The vent holes in the manhole covers (approximately 1 inch in diameter) served as access points for sampling and data collection.
Fig. 2.
General Layout of Cleanout and Manhole Locations
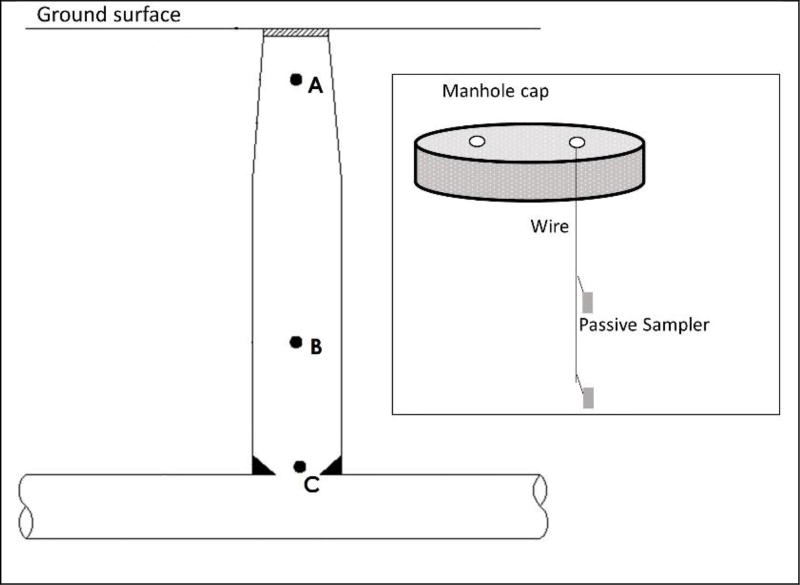
In general, passive and grab samples were collected at shallow depths (point A) in the manhole (Fig. 3) for this research study (2014–2017). In 2016 and 2017, additional depths at MH-15, MH-17 and MH-18 were investigated (points B and C) and passive samplers were nested, as shown. Most of the continuous monitoring data (AROMA sensor) were collected at the deep location (point C). Exact depths and details are given in the “Results and Discussion” section.
Fig. 3.
General Sampling Depths Inside Manholes
Note: A: TO-15/TO-17 (2014, 2015, 2016 and 2017), B: Select TO-17 samples @ MH-18 (2016) and Radiello® samples (2016 and 2017), C: AROMA data, except when noted (2016 and 2017).
Several different sampling approaches were required for cleanouts due to variability in size and pipe condition. Cleanout covers were inconsistent and, in some cases, non-existent. For grab sampling, it was difficult to obtain an airtight seal for some of the cleanouts. Therefore, in select cases the data may be subject to negative bias due to atmospheric dilution. For passive sampling, most cleanout covers were replaced with expandable well caps and passive sampler tubes were connected to the well caps with approximately 6 inches of wire during the sampling event. The expandable well caps provided an airtight seal on these cleanouts. In other cases, when expandable well caps could not be tightly fitted to the cleanout pipe, openings in cleanout pipes were covered; however, airtight seals on non-round pipe were not possible.
2.2 Passive sampling
Passive sewer gas sampling methods utilize adsorbent samplers to capture organic compounds from air without forcing the flow rate of gas. Two types of passive samplers were utilized in this study: stainless steel tubes packed with Carbopack X (TO-17) analyzed by Beacon Environmental Services, Inc. (Beacon); and Radiello® samplers, analyzed by EPA Region 9 Lab.
2.2.1. Carbopack X (TO-17)
Thermally-conditioned, stainless steel tubes packed with Carbopack X adsorbent material, provided by Beacon, were suspended in the targeted manholes and cleanouts using wire. Following sewer air exposure, these adsorbent tubes were sealed and returned to Beacon’s lab for analysis by Method TO-17. Thermal desorption-gas chromatography/mass spectrometry (TD-GC/MS) instrumentation targeted a custom set of chlorinated compounds. ISO 16017-2 procedure was used to convert the adsorbed mass on each sampler to a gas concentration.
These passive samplers (TO-17) were deployed for different durations. During the 2015 sampling event, they were installed at all sampling locations for a period of seven days. During the 2016 event, passive samplers were installed in MH-17 and MH-18 for 12 hours and 24 hours. Sample depths ranged from 1–3 ft below the manhole lid for most sampling locations, except when explicitly noted in the text. Background samples of atmospheric air were also collected during each event at various locations throughout the study area. Analyzed results of the atmospheric air samples were below detection limits for all events.
2.2.2. Radiello® samplers
Radiello® 130 samplers, which contain stainless steel net cylinders packed with activated charcoal, were deployed in MH-15 and MH-17 using wire during the 2016 and 2017 sampling events for several days. EPA Region 9 Laboratory in Richmond, California conducted analyses of selected VOCs by GC/MS. Analyses were compliant with the laboratory’s standard operating procedures that define requirements for calibration and acceptable results for QC parameters.
2.3 Grab samples (TO-15)
Sewer air grab samples were collected inside selected manholes and cleanouts for a sampling time of approximately <5 minutes. Manhole samples were collected at a depth of approximately 3 ft below the manhole lid. Sample depths from cleanouts varied depending on cleanout geometry. Samples were collected using 1/4” o.d. Teflon tubing. Sample collection by evacuated stainless steel canisters (1L and 400mL) was controlled by flow restrictors. Before field sampling, canisters were certified “clean” and flow controllers were verified by the laboratory.
Samples were analyzed by different labs for each of the distinct sampling events. Samples from the January and July 2014 and the 2015–2017 events were analyzed using Method TO-15 by EPA Region 9 Laboratory in Richmond, California. Samples from the February and March 2014 events were analyzed using Method TO-15 by Eurofins Air Toxics, Folsom, California. Prior to sampling, all canisters were certified “clean” and flow controllers were verified by the laboratory. All data from canisters are from canisters with acceptable vacuums upon receipt at the laboratory. Analyses were compliant with each laboratory’s standard operating procedures that define requirements for calibration and acceptable results for QC parameters.
2.4 AROMA Continuous Gas Monitor
To assess temporal variability, sewer gas samples were collected at MH-17 and MH-18 by AROMA. AROMA is a direct sampling vapor analyzer that determines analyte concentrations through a combination of Cavity Ring-Down Spectroscopy and a surface interaction-based chemical separation. Sewer vapor samples were automatically drawn into the instrument using onboard mass flow control. Sampling protocol was based on recently established sewer sampling methodology (McHugh et al., 2017). Sample inlet tubing consisted of 12 ft of 3 mm Nylaflow® tubing extended with 10 ft of 1/8” PTFE tubing with a total sample train volume of approximately 15 cm3. For each measurement, a purge volume of 100 cm3 (at standard conditions for temperature and pressure (STP), defined as 0°C and 1 atm) was extracted prior to sampling. A sample volume of 200 cm3 (STP) was drawn into the instrument over a 1-minute sampling time for analysis. For all measurements (excepting vertical profile measurements) the sample inlet was maintained at approximately 1 ft above the floor of the manhole shaft. Sample analysis was performed immediately after sampling and results were automatically logged. Analyses were completed using Entanglement Technologies’ standard operating procedures, and daily calibration check values (CCVs) were recorded. Total sampling plus analysis time was approximately 15 minutes. In the 200 cm3 (STP) sample configuration, the TCE limit of detection of the AROMA instrument was 1.5 µg/m3.
2.5. Sewer liquid analysis
Sewer liquid was collected from MH-17 and MH-18 during the 2016 sampling event (September 28, 2016). The depth to sewer liquid from ground surface was measured immediately prior to sampling. All measurements were collected through the manhole vents, so the manhole covers could be left in place during all sampling activities. The height of the sewer liquid (above the bottom of sewer pipe) fluctuated between 0.65 ft (measured at 8:44 am) and 0.38 ft (measured at 10:36 pm). Sewer liquid samples were collected with disposable bailers through sewer vent holes. Samples were transferred to 40 mL Volatile Organic Analysis (VOA) vials and delivered on ice to EPA Region 9 Laboratory, Richmond, California for analysis of select VOCs (TCE, PCE, chloroform, cis-1,2-dichloroethylene) using EPA Method 524.2. VOA vials were pre-conditioned to maintain a pH below 2 (pursuant to EPA, 1995).
2.6. Other site sampling
A photoionization detector (PID) (MiniRAE 3000) was used as a portable VOC monitor to screen locations with high total VOC concentrations. This PID has a detection range between 0.1 and 15,000 ppm and detects VOCs within three seconds. A Trimble GeoExplorer® 3000 series was used to record GPS information of all sampled manholes and cleanouts.
3. Results and discussion
Sewer gas samples were collected from the sanitary sewer located to the west of a well-defined TCE groundwater plume and the 2012 VI Study Area shown on Fig. 1a. Section 3.1 summarizes the results from 2014 sampling efforts (TO-15) that show temporal variation on a monthly (and biweekly) basis. Follow-up sampling in 2015 compared TO-17 passive sampling with TO-15 grab sampling (Section 3.2). These results, which are consistent with the data from 2014, confirm spatial variability in sewer gas concentrations (particularly TCE) throughout the sewer system, regardless of sampling method (grab vs. passive). Continuous monitoring using the AROMA sensor, combined with passive sampling, showed that temporal variation occurs even over the short-term (on the scale of hours) (Section 3.3). Section 3.4 summarizes the sampling results from the entire study (2014–2017) for MH-15, MH-17 and MH-18. The results highlight temporal variability and considerations for sampling depth.
3.1. 2014 manhole sampling using TO-15 (grab) method
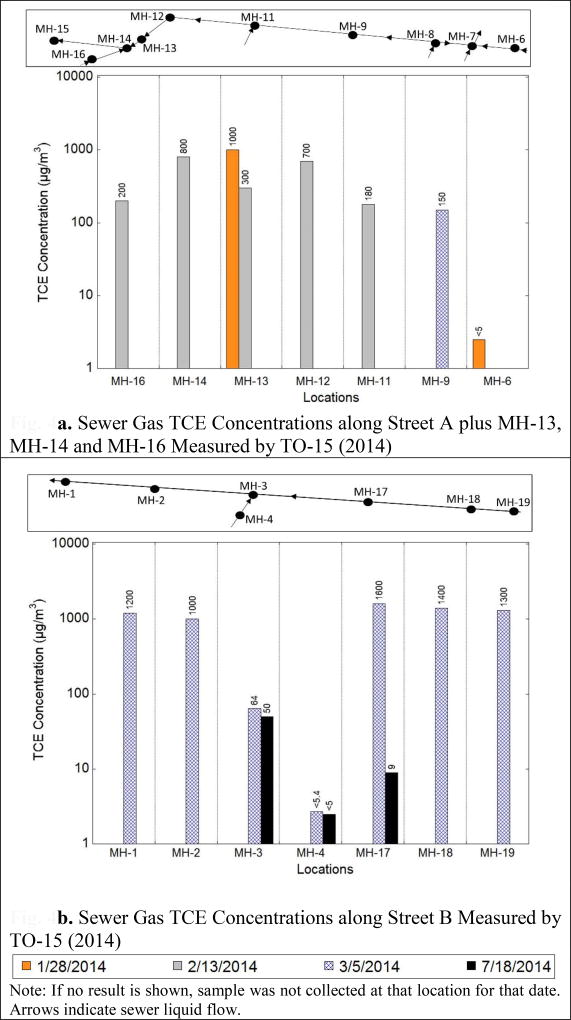
In 2014, sampling was conducted periodically from January through July. Fig. 4a and Fig. 4b show spatial variability in TCE sewer gas concentrations detected in manholes located throughout the research study area along Street A and Street B, respectively. Sewer flow direction along the area is also shown in Fig. 4a and Fig. 4b.
Fig. 4.
a. Sewer Gas TCE Concentrations along Street A plus MH-13, MH-14 and MH-16 Measured by TO-15 (2014)
b. Sewer Gas TCE Concentrations along Street B Measured by TO-15 (2014)
As shown on Fig. 4a, the highest TCE concentration in sewer gas along Street A was detected in MH-13 during 2014 sampling. This manhole is located downstream of a bend in the sewer system as Street A ends. Sewer liquid flows from MH-13 south into MH-14, while sewer liquid from MH-16 flows to the north into MH-14. During the February 2014 event, the TCE concentration was higher in MH-14 than in MH-13 or MH-14. While TCE sewer gas concentrations in MH-14 is a combination of streams from MH-13 and MH-16, which would not explain the higher concentration detected at MH-14, turbulent mixing at the “T” towards MH-15 may have also increased liquid-gas mass transfer in this manhole and influenced the sewer gas TCE concentrations. The lowest concentration was detected in MH-6, where the sewer was likely located above the groundwater table, as discussed previously.
Fig. 4b shows manholes located along Street B. Relatively high concentrations of TCE (≥1000 µg/m3) were detected in sewer gas at MH-1, MH-2, MH-17, MH-18 and MH-19. Lower concentrations were observed in MH-3 and MH-4. These manholes are located at the intersection of a sewer pipe with flow coming from the south, which may dilute sewer liquid concentration (and therefore sewer gas concentrations) in this local area; however, the intersection of sewer flow can also result in turbulence. Absent of other factors, this turbulence could have locally increased sewer gas concentrations in this area. Results from 2015 (Section 3.3, Fig. 5a and Fig. 5b) indicate the TCE concentration at MH-3 was higher relative to the other manholes. It is likely that both dilution from incoming sewer streams and liquid-gas mass transfer due to turbulence are complicating factors when interpreting sewer gas concentration data.
Fig. 5.
a. Sewer Gas TCE Concentrations measured by TO-15 (August 11, 2015)
b. Sewer Gas TCE Concentrations Measured by TO-17 (August 11–18, 2015)
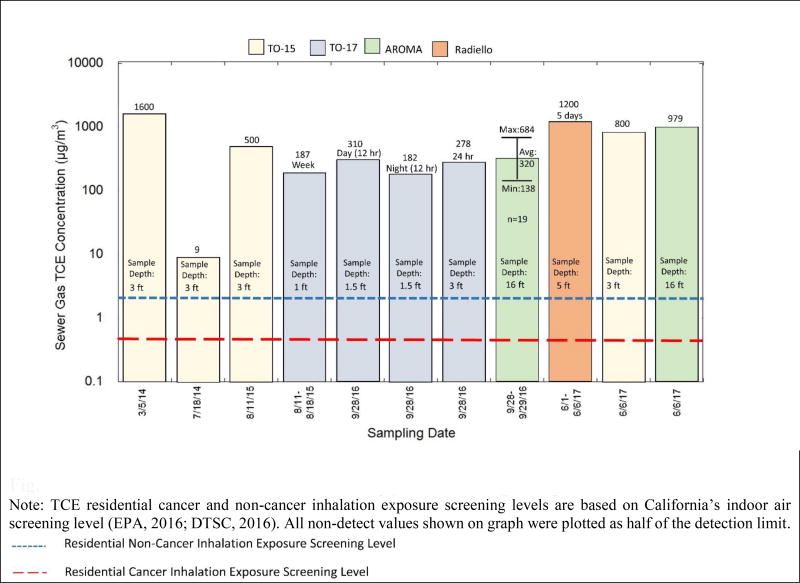
The highest TCE concentration was detected in MH-17 (1600 µg/m3) during the March 2014 event; however, four months later in July 2014, the TCE concentration had decreased three orders of magnitude to 9 µg/m3. The reason for this drastic decrease in TCE sewer gas concentration at MH-17 is not known; however, as discussed below, additional evaluation was conducted during 2016 and 2017 and temporal variation was observed during those sampling events as well. The concentration detected during the March 2014 event (1600 µg/m3) was the highest TCE sewer gas concentration detected at the site during this entire study (2014–2017).
There are many possible explanations for the observed temporal and spatial variability shown in Fig. 4a and Fig. 4b. For instance, manholes were sampled during different times of the day and sanitary sewers are well-known to have diurnal sewer usage patterns. However, sampling times typically ranged from late morning until early afternoon (see Supplementary Material). Other possible explanations may include: fluctuations in the rates of groundwater infiltration/exfiltration into/from the sewer in areas where the sewer system was cracked or deteriorated; variability in sewer gas ventilation rates and direction of sewer gas flow through manholes; variations in legal (or illegal) direct discharges to the sewer; variations in total sewer liquid flow; etc.
3.2. 2015 manhole sampling using TO-15 (grab) and TO-17 (passive, 1-week) methods
In 2015, additional sampling was conducted to investigate passive sampling by TO-17, given the temporal and spatial variability of TCE sewer gas concentrations detected in 2014. For comparison purposes, samples were collected by both TO-17 (passive, 1 week) and TO-15 (grab) methods. In addition to collecting sewer gas samples from manholes, sewer gas samples were also collected from cleanouts. Manholes provide information about the sewer gas concentrations in the sewer mains, while cleanouts provide information about the sewer gas concentrations closer to the building plumbing connections (see Fig. 2)—which may be useful when assessing potential exposure risks. Tracer studies capable of determining the fraction of sewer gas that enters each home would be useful in conjunction with cleanout sampling data (and indoor air sampling data) (e.g. Riis et al., 2010); however, home access would be necessary and was not feasible during this study.
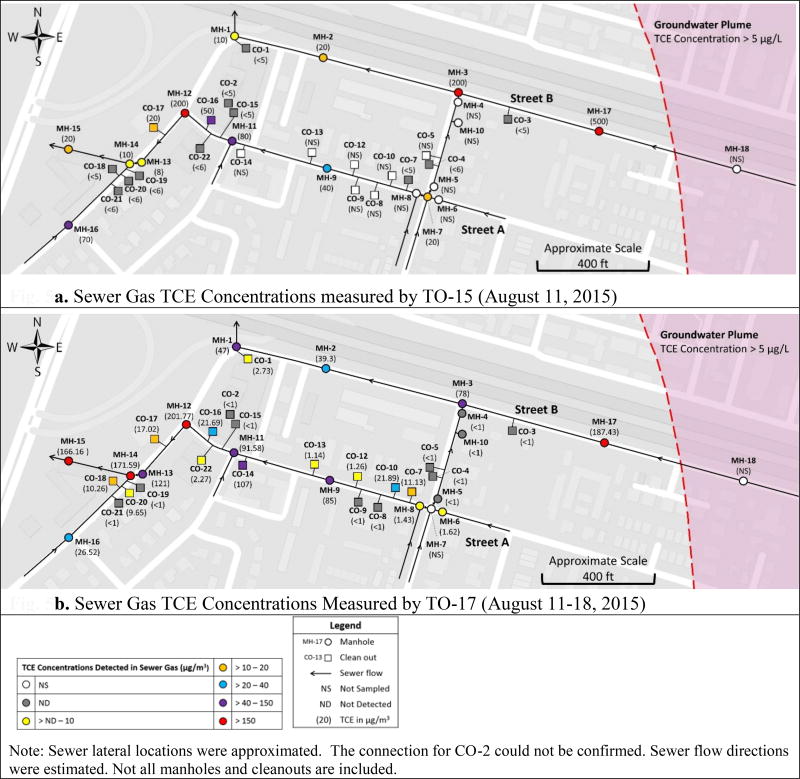
Fig. 5a and Fig. 5b illustrate spatial variation of TCE concentrations detected in sewer gas for the 2015 sampling event by TO-15 and TO-17 sampling methods, respectively. The concentrations detected during this sampling event were an order of magnitude lower (in general) than detected in 2014. The exact reasons for lower concentrations are not known; however, these lower concentrations were confirmed by two different sampling/analytical methods (TO-15 and TO-17) and, when combined with the rest of the data in this research study, they highlight the temporal nature of VOC sewer gas concentrations.
Along Street B, a sewer gas TCE concentration gradient originating from the 2012 VI Study Area (pink shaded region on Fig. 5a and Fig. 5b) and dissipating to the west is present; however, this trend is not necessarily expected to be always present—especially in recognition of the 2014 data shown in Fig. 4b. Along Street A, where tributaries complicate the sewer flow, sewer gas concentration gradients do not emerge. Collectively, Fig. 5a and Fig. 5b illustrate that relatively wide variations in TCE concentrations in sewer gas can exist laterally hundreds of feet from a well-established groundwater plume.
Several TCE “hot spots” are being investigated as part of ongoing regulatory activities due to historical discharge of TCE to the sewer system and because the sewer system pipes are suspected to have leaked. A TCE “hot spot” near MH-15 (see Fig. 1a) has been identified by others as part of ongoing site investigation activities in the area. Elevated TCE soil gas concentrations near MH-12, MH-13, MH-14 and MH-15 have been detected, with concentrations as high as 1.6 million µg/m3 near MH-14 and MH-15 (Bureau Veritas, 2013; Cornerstone Earth Group, 2017) and TCE groundwater concentrations have been detected up to 110,000 µg/L (FOIA, 2017). The results of these site investigations confirm TCE in groundwater, which is an important part of the site conceptual model, Fig. 1a.
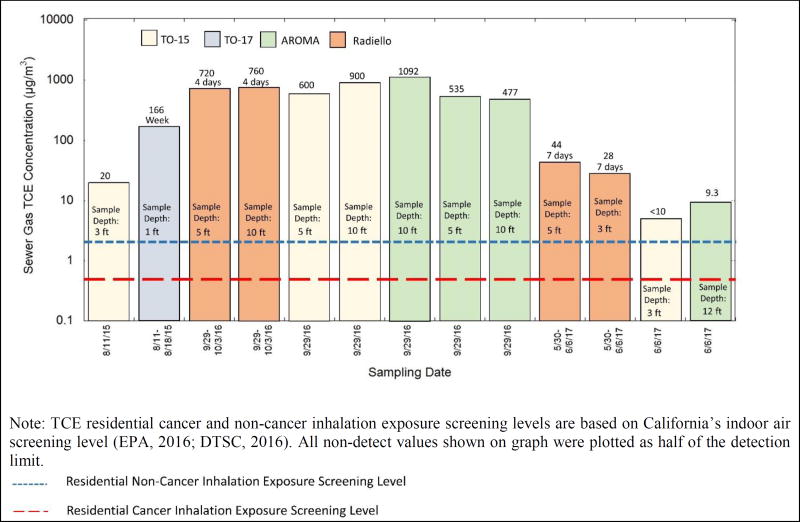
Comparing the sampling methods, TO-15 grab samples (Fig. 5a) did not detect as high of TCE sewer gas concentrations as the TO-17 (week-long passive) samples (with the exception of MH-12 and MH-16) in the western portion of the site. It is suspected that the subsurface contamination in this area may contribute to some of the variability in sewer gas concentrations. As discussed in Section 3.4, considerable temporal variability is observed in TCE sewer gas concentrations in MH-15 following the 2015 sewer gas sampling (see Fig. 8).
Fig. 8.
MH-15 Sewer Gas TCE Concentrations (µg/m3) and Sample Depths, 2015–2017
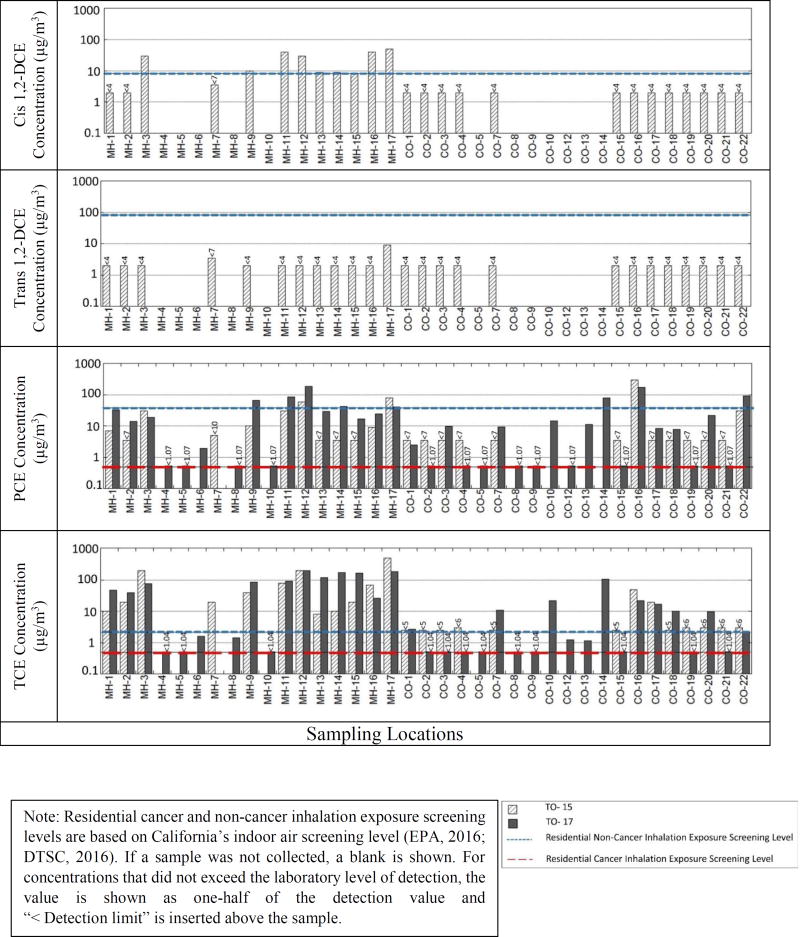
Fig. 6 compares the measured sewer gas concentrations of several additional chemicals with California’s cancer and non-cancer inhalation residential exposure screening levels for each chemical. A summary of all chemicals analyzed and detected in the sewer gas are provided in Supplementary Material. PCE and TCE are the chemicals that were most often detected at concentrations above California’s indoor air residential exposure screening levels. TCE was the VOC most frequently detected above California’s residential exposure air screening levels in the manholes and cleanouts in this study area.
Fig. 6.
Sewer Gas Concentrations Detected in Manholes and Cleanouts (2015)
Although residential exposure air screening levels do not directly relate to sewer gas concentrations, it is worth noting that TCE in sewer gas in many manholes and a few cleanouts was detected at concentrations 1–2 orders of magnitude greater than the indoor air screening levels. While building plumbing systems are designed to prevent sewer gas entry, plumbing systems are well-known to fail and sewer gas odors are a common example of these failures. However, the fraction of sewer gas that would enter a home as a result of a faulty plumbing connection and cause elevated indoor concentrations of a given VOC is not precisely known. Recent research by McHugh et al. (2017) showed that dilution of sewer gas into indoor spaces varies from approximately 50x to 500x during their study at the EPA VI Research Duplex.
Generally speaking, the concentrations detected in the manholes were greater than the concentrations detected in the cleanouts. Caution should be exercised when drawing linear relationships (i.e. attenuation factors) between manholes and cleanouts. Wastewater usage is likely subject to many variables and may be responsible for variable sewer gas concentrations. Additional research is needed to fully understand the variability of TCE concentrations in sewer gas inside manholes and cleanouts.
For instance, the TO-17 passive sampling results (Fig. 5b) shows that MH-9 had a TCE concentration of 85 µg/m3 and cleanouts, CO-12 and CO-13, on either side of MH-9 had concentrations of 1.26 and 1.14 µg/m3, respectively. To the west of CO-13, CO-14 had a concentration of 107 µg/m3, which is two orders of magnitude higher than CO-13. The nearest manhole to CO-14 is MH-11, which had a TCE concentration of 91.58 µg/m3. The TCE concentration detected at CO-14 was unexpectedly high based on nearby manholes and other cleanouts. In addition, as shown on Fig. 6, this cleanout contained the highest TCE concentration of all the cleanouts sampled. Follow-up sampling was conducted in 2016 using a Radiello® sampler and the concentration had decreased to <9 µg/m3.
Chloroform was occasionally detected in the sampling locations throughout the research study area (see Supplementary Material). This chemical is a byproduct of chlorination and organics in wastewater, and therefore does not directly relate to the issue of VI. However, it is interesting to note that the maximum concentration of chloroform reported by TO-17 is 8.95 µg/m3, while the highest concentration reported by TO-15 is 300 µg/m3. Several locations reported TO-15 chloroform concentrations >100 µg/m3. Considering that TO-15 samples were collected in the middle of the day during times of potentially high water use, these results suggest that elevated concentrations of chloroform in the sewer system may be associated with household appliances and laundry bleach, which Shepherd et al. (1996) reported is an important source of chloroform in wastewater systems.
3.2.1. Comparison of TO-15 and TO-17 methods for 2015
Fig. 5a and Fig. 5b highlight that several manholes consistently contain “high” TCE concentrations and “low” TCE concentrations (relative to other manholes) across the study area, regardless of sampling/analysis approaches. For instance, the TCE concentrations detected in MH-17 were among the highest detected by both TO-15 and TO-17. Similar results were obtained at MH-3 and MH-12. In addition, there are several cleanout locations such as CO-2 and CO-4 where undetected or “low” concentrations of TCE were reported by TO-15 and TO-17, as compared to other sampling locations.
However, compatibility between results of TO-15 and TO-17 was not observed at all sampling locations. For instance, comparing TO-15 and TO-17 data at MH-15 and MH-13 suggests inconsistency between the results. Coupled with the 2014 data (Fig. 4a and Fig. 4b), grab and passive sample results are not anticipated to necessarily correspond well due to temporal variability. Sampling periods for grab and passive samplers were <5 minutes and 1 week, respectively. The challenge is to determine how to assess this pathway with regard to potential variations and select the sampling method capable of providing the greatest insight about this pathway. Given the low concentrations detected during the 2015 event, as compared to concentrations detected during 2014, 2016 and 2017 (see Fig. 8 and Fig. 9), it is assumed that a single 1-week passive sampling period is insufficient to characterize sewer gas exposure risks. Multiple sampling events would likely be required, but more research is need to determine how many sampling events are necessary.
Fig. 9.
MH-17 Sewer Gas TCE Concentrations (µg/m3) and Sample Depths, 2014–2017
There were several locations where PCE and/or TCE was reported below detection limits by TO-15, but above the detection limits for TO-17. These data points are particularly important because the TO-15 method did not identify the presence of TCE and/or PCE in sewer gas, even though a longer sampling duration (TO-17) was able to identify the presence of the chemical. Other locations, where PCE and/or TCE were not detected by either method, suggest that both methods were equally able to corroborate the absence of the compound in sewer gas. Generally speaking, considering the significant temporal fluctuations observed in sewer gas concentrations (e.g. Fig. 4a and 4b and Fig. 6), these data suggest that TO-15 and TO-17 should not be expected to detect the same concentration at all locations at all times.
TO-15 grab samples may not detect sewer gas concentrations as frequently as TO-17 (longer duration) samples. TO-15 (grab sampling) and TO-17 (longer duration passive sampling) report chemical concentrations over different ranges of time. Short-term fluctuations in chemical concentrations are integrated over the longer TO-17 sample, whereas peaks and valleys in concentrations may or may not be captured during a TO-15 grab sewer gas sample. In some locations, such as cleanouts, TO-15 grab samples may not have resulted in detectable chemical concentrations because of difficulty creating an adequate seal over the short sampling duration. In these cases, passive samplers that can be sealed in place for several days may be advantageous.
There are some considerations for deploying passive samplers for several days. Air velocity and humidity may affect the uptake rate of passive samplers and result in biased concentrations. High humidity is an inescapable issue inside a sewer system. Hydrophobic and nonporous samplers are advantageous for application in high humidity and high velocity environments and were therefore used for TO-17 sampling during both 2015 and 2016 field studies (EPA, 2015c). The TO-17 samplers used in this research were packed with Carbopack X, which has been shown to be compatible for high humidity applications when the sampling tube is the same temperature as the air being sampled (Brown et al., 2015), such as the sampling application used here where samplers were deployed in sewer manholes and cleanouts for several days.
Passive sampling does not provide any information about temporal variation in VOC concentrations. To gain better insight into time-based fluctuations, continuous monitoring could be the best current option. Continuous monitoring (e.g. AROMA) was used in this study to record fluctuations in sewer concentrations over short time periods. While continuous monitoring provides benefits such as lower costs, quicker sampling rates, and on-site measurement capabilities, the instrumentation (e.g. gas chromatography analyzers) normally requires highly trained field personnel, frequent calibration, conditioning steps, and maintenance for quality assurance (Holton, 2016).
3.3. Field sampling (2016) using TO-17 and AROMA sensor sampling methods
To assess short-term (e.g. hourly) temporal variations of sewer gas TCE concentrations, MH-17 and MH-18 were investigated under fairly controlled conditions using passive (TO-17) and continuous (AROMA) sampling techniques. These manholes are located along Street B and are fairly close to the TCE groundwater plume. As shown on Fig. 1, MH-18 is located within the TCE groundwater plume (and 2012 VI Study Area), while MH-17 is located outside the plume area.
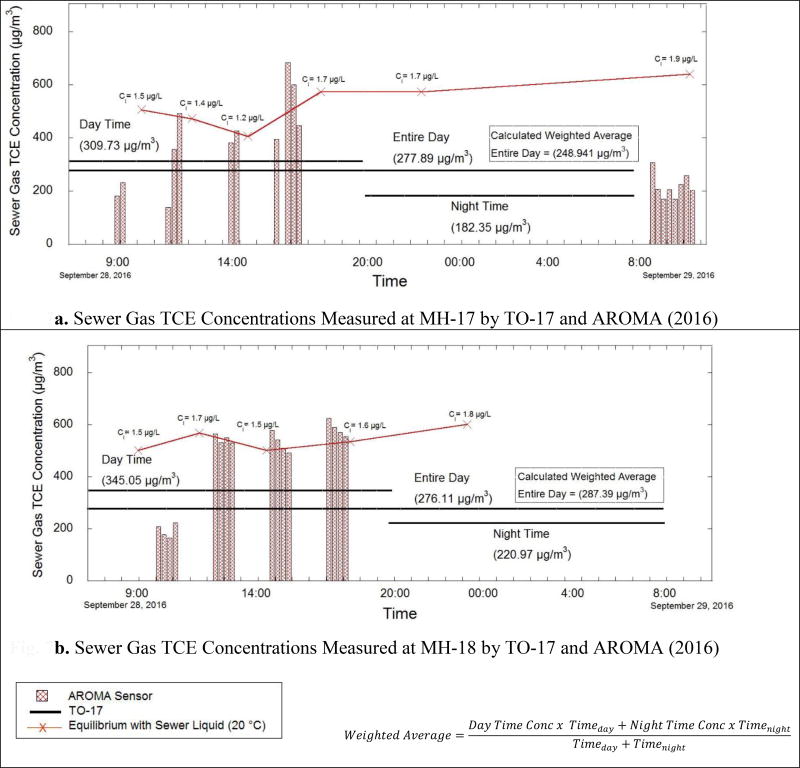
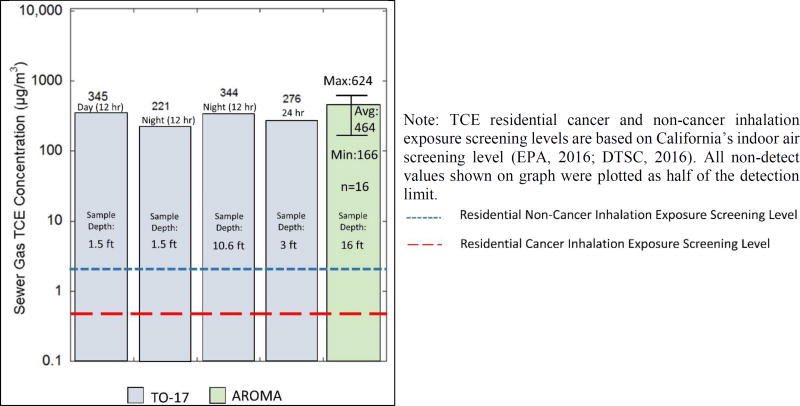
Sewer gas concentrations at MH-17 and MH-18 were measured by TO-17 for three time intervals: day time, night time, and entire day. Day time and night time samples had a residence time of approximately 12 hours, while “entire day” samples had a residence time of about 24 hours. Using the passive sample results, a calculated time-weighted average was determined. The entire-day average concentration and the measured entire-day concentration agree relatively well (Fig. 7a and Fig. 7b). For both manholes, day time and night time samples were collected at 1.5 ft below ground surface (bgs), and entire day samples were collected at 3 ft bgs. The AROMA sensor intake was suspended at 16 ft bgs in MH-17 and MH-18, to collect and analyze a series of samples collected periodically over several hours (Fig. 7a and Fig. 7b). A discussion of sample depth and implications for sewer gas concentration measurements is included in Section 3.4.
Fig. 7.
a. Sewer Gas TCE Concentrations Measured at MH-17 by TO-17 and AROMA (2016)
b. Sewer Gas TCE Concentrations Measured at MH-18 by TO-17 and AROMA (2016)
AROMA results suggest relatively high temporal variability of sewer gas TCE concentrations in both manholes. Higher TCE concentrations were observed during noon and afternoon sampling events compared to early morning. For MH-17, TCE concentrations fluctuated between 138 µg/m3 and 684 µg/m3, with an average of 394 µg/m3. For MH-18, TCE concentrations fluctuated between 165 µg/m3 and 624 µg/m3, with an average of 462 µg/m3. In addition, some significant variations occurred over short timescales; for example, the TCE vapor concentration more than doubled in the 15 minutes between AROMA samples at MH-17 during the noon sampling event. Overall, MH-17 (located outside of the 2012 VI Study Area) appeared to exhibit greater temporal variation than MH-18 (located inside the 2012 VI Study Area). Sewer videos indicate cracks upstream of both manholes (FOIA, 2017); however, it is not known whether infiltration was occurring during the time of this field study.
For the TO-17 results, TCE concentrations were higher in the day time than night time in both manholes. The night time TCE concentration was approximately 60% of the day time concentration for both manholes. The entire day sample for MH-17 was approximately 90% of the day time sample, whereas the entire day sample for MH-18 was approximately 80% of the day time sample. The TCE concentrations detected by AROMA and TO-17 highlight that even on a short-term (hourly to daily) basis, MH-17 and MH-18 exhibit variations in TCE sewer gas concentrations.
TCE concentrations in sewer liquid also exhibited temporal variations, as shown on Fig. 7a and Fig. 7b and summarized in Table 1. During the 2016 sampling event, sewer liquid samples were collected periodically during the 24 hour sampling period in MH-17 and MH-18. For comparison purposes, 2014 sewer liquid data is shown in Table 1 for manholes MH-20 and 21. Although MH-20 and MH-21 were not sampled as part of this research study, they are located to the east of MH-17 and MH-18, within the 2012 VI Study Area. Sewer videos indicate groundwater infiltration into the sewer may be occurring near those locations (FOIA, 2017). The sewer liquid data for these manholes (in 2014) show that fluctuations in concentrations varied based on sampling date and time (see Table 1). As shown on Fig. 1a, these manholes are important in terms of the conceptual model for the site.
Table 1.
Sewer Liquid Results for TCE
| Manhole | Sampling Date | Results (µg/L) |
|---|---|---|
| MH-17 | 3/27/2014, 2 pm | 1.80a |
| 3/28/2014, 6 am | 7.59 | |
| 9/28-29/2016 | 1.64 (1.2–2.1)b | |
| MH-18 | 9/28/2016 | 1.62 (1.5–1.8)b |
| MH-20 | 3/27/2014, 2 pm | 29.43 |
| 3/28/2014, 6 am | 77.56 | |
| MH-21 | 3/27/2014, 2 pm | 16.47 |
| 3/28/2014, 6 am | 36.22 |
Note:
Data below limit of quantification (LOQ) but above limit of detection (LOD) (City of Palo Alto, 2014).
Results for manhole are the 24-hour sampling average. Numbers in parentheses represent the variation of TCE detected over the 24-hour period.
Sewer headspace TCE concentrations were calculated assuming that liquid- and gas-phase concentrations are in static equilibrium. At equilibrium, the gas-phase VOC concentration, Cg, is given by the following equation:
| (1) |
Cl is the sewer liquid VOC concentration, and Hc is the dimensionless Henry’s Law constant that varies with temperature. Wastewater temperatures normally range between 10°C and 20°C (WEF, 2007). C_g values reported on Fig. 7b were determined using H_c at 20°C; however, it is worth noting that at 10°C, H_c is approximately 60% of the H_c value at 20°C.
In addition to sewer liquid VOC concentrations, sewer gas VOC concentrations are also a function of several other factors (Corsi and Birkett, 1995; Olson et al., 1998). Groundwater VOC concentrations, groundwater depth, sewer liquid temperature, soil properties, and slopes and elevations of sewer lines could influence liquid- and gas-phase VOC concentrations within the sewer system. Turbulence induced by a drop structure within a manhole can increase VOC stripping to the gas phase; however this alone does not appear to provide an explanation for the variability observed in the TCE sewer gas concentrations at the site. Sewer video logs can record this potential turbulence inside the sewer line. Sewer headspace velocity can have an important effect on VOC concentrations in the headspace and also on the VOC evaporation rates from sewer liquid to the gas phase. Several parameters control sewer headspace velocity, including sewer liquid flow rate, ambient air temperature and wind speed, and humidity and pressure gradient inside the sewer system. These considerations are outside the scope of this current research study; however, they are important in highlighting that sewer gas transport is a convective and diffusive process. Ongoing and future research related to these topics would be useful in better understanding which factors influence spatial and temporal variations of VOC concentrations in sewer gas.
The data collected from the AROMA sensor show temporal variability through the day time sampling period. No AROMA night time samples were collected. The passive samplers show day time concentrations were higher than night time concentrations. Together, these results indicate that the time of sample collection on any given day could influence the TCE concentration detected. Sewer liquid concentrations also showed fluctuations, which did not precisely map to the TCE concentration fluctuations measured in the associated sewer gas.
3.4. Implications for sample depth and temporal evaluation of results from 2014–2017
Beginning in 2014, most of the sewer gas samples included in this research study were collected at shallow depths (≤3 ft bgs). In general, it is useful for the sampling depth to be consistent throughout the sampling study for comparison purposes. While higher sewer gas concentrations are intuitively expected near the liquid-gas interface, it is of interest how various sample depths compare. To investigate the effect of sample depth, the results of sewer gas samples collected at different depths are summarized below. Fig. 8, Fig. 9 and Fig. 10 compare sampling depths and sewer gas concentrations for MH-15, MH-17 and MH-18, respectively. In addition, the data are combined with the data collected during all sampling events from 2014 through 2017. The data are shown on log scales so that the spread in the data can be shown across several orders of magnitude.
Fig. 10.
MH-18 Sewer Gas TCE Concentrations (µg/m3) Collected September 28, 2016
3.4.1 Manhole MH-15
Fig. 8 illustrates that regardless of depth or sampling type, TCE concentrations detected in MH-15 during 2016 sampling events were 1–2 orders of magnitude higher than detected in 2015 and 2017. MH-15 is located a considerable distance from the 2012 VI Study Area known (Fig. 1a). During the 2015 sampling, MH-15 (Fig. 5b and Fig. 8) showed elevated TCE sewer gas concentrations detected by TO-17. Ongoing subsurface investigations in the vicinity of this manhole confirm elevated TCE groundwater concentrations in its vicinity (Compliance and Closure, 2013; Stratus Environmental, 2010; Bureau Veritas, 2013; Cornerstone Earth Group, 2017). Groundwater infiltration into the sewer system can be intermittent and is a complicating factor when interpreting TCE sewer gas concentrations in this manhole.
Over the duration of this study, the TCE concentration detected in sewer gas in MH-15 fluctuated considerably. In August 2015, the TCE concentration detected by TO-15 was 20 µg/m3. And, during the same sampling event, TO-17 (1 week passive sample) detected the TCE concentration at 166 µg/m3. The maximum TCE concentration (1092 µg/m3) was detected in September 2016 by the AROMA sensor. Several other methods also confirmed elevated TCE concentrations during this time period. Many months later the TCE concentrations in MH-15 had decreased 1–2 orders of magnitude.
The exact reason for the observed temporal variations in TCE sewer gas concentrations is not known. Groundwater elevations relative to the bottom of the sewer elevation may have resulted in intermittent groundwater infiltration into the sewer system. In addition, the contribution of sewer ventilation as compared to mass transfer of TCE from sewer liquid to the gas phase during specific sampling dates could have played a role in the observed variablity. Additional research is needed to gain an understanding of the factors that are most important in temporal variability.
It is difficult to interpret the depth effect in the presence of the temporal changes in sewer gas concentrations. The most useful information in evaluating depth implications in this manhole is the passive sample results from September 2016, which showed that over the 4-day duration of Radiello® sampling, there was little difference between the TCE concentration detected in sewer gas at 5 feet and 10 feet. Overall, the results shown on Fig. 8 suggest that temporal variability may have played a more important role than sample depth in the observed TCE concentrations.
3.4.2 Manhole MH-17
In MH-17 (Fig. 9), measured sewer gas TCE concentrations also exhibited temporal variability and did not show a strong dependence on sampling depth. The highest (1600 µg/m3) and lowest (9 µg/m3) sewer gas TCE concentrations were detected in 2014 by grab sampling (TO-15). In June 2017, a fairly high concentration (1200 µg/m3) was detected by passive sampling (Radiello®), which suggests elevated TCE sewer gas concentrations were sustained over the four days of sampling.
During the September 2016 “day time” event, a TO-17 sampler was installed at 1.5 ft in MH-17 and the AROMA sensor measured concentrations at a depth at 16 ft. The “average” AROMA concentration was 320 µg/m3, which compares closely to the TO-17 result of 310 µg/m3. These results suggest that the depth of sampling did not considerably affect the measured TCE concentrations. The TCE concentration measured by the AROMA sensor for the 6/6/2017 sampling event (979 µg/m3) at depth of 16 ft is slightly higher compared to the TCE concentration detected by TO-15 measured at a depth of 3 ft (800 µg/m3). These samples were collected at different times—12:54 pm and 6:11 pm for AROMA and TO-15, respectively. Although the sewer gas concentrations cannot be directly compared since they were not collected at the exact same time, the results are quite similar and do not suggest a strong dependence on sample depth.
3.4.3 Manhole MH-18
For MH-18 (Fig. 10), depth appeared to play a limited role in the measured sewer gas concentrations. In this manhole, two “night time” TO-17 samplers were deployed at two different depths during the same sampling event (10.6 ft and 1.5 ft) and the results showed that the deeper sample was 1.6 times higher than the shallow sample. Similarly, the AROMA sensor consistently measured higher “average” day time concentrations (464 µg/m3, placed at 16 ft) when compared to the TO-17 day time sampler (345 µg/m3, placed at 1.5ft). Although depth appeared to play a limited role in this manhole, short-term temporal variability was observed to have a more substantial effect (Fig. 7b). Given the temporal variations shown by AROMA measurements (nearly a factor of 4), it is not easy to determine the importance of the depth effect on measured TCE sewer gas concentrations in the presence of other factors.
4. Conclusions
This research study highlights the variable nature of VOC concentrations (especially TCE) in a sanitary sewer system with multiple sampling techniques. Temporal variations in TCE concentrations are shown to exist in this sewer system over short-term (hourly) and longer-term (monthly) bases. The data, collected by three different methods, show considerable spatial variations also exist. It is plausible that the spatial and temporal variability of VOC concentrations in sewer gas observed in this study may also exist in sanitary sewer systems at (and near) other shallow VOC groundwater contaminated sites.
Sampling approaches to assess sewer gas concentrations need to account for the variability which were observed in this research study. Single short-term approaches (i.e. TO-15 grab sampling) may not be adequate for assessing long-term exposure risks associated with this pathway. Passive sampling provides an approach for assessing time-averaged sewer gas concentrations; however, there is difficulty in defining appropriate time over which to deploy a passive sampler, as well as the number of sampling events, given the high level of temporal variability reported in this study. Subsequent sampling events may be required to capture longer-term temporal variations (see Fig. 4a and Fig. 4b, Fig. 8 and Fig. 9). This research demonstrates that incorporating passive samplers with continuous monitoring devices can provide insight about temporal and spatial variations.
Sewer manholes and cleanouts are often easily accessible sampling locations for sewer pathway investigations. While manholes provide information about the sewer system itself, cleanouts can potentially provide information close to the point of exposure (e.g. inside buildings). Even while additional information is emerging about VI alternative pathways, multiple lines of evidence, such as VOC concentrations in and around the sewer system, nearby groundwater level measurements to evaluate sewer level elevations relative to groundwater table fluctuations, modeling, tracer studies to evaluate sewer gas transport, sewer videos, sewer as-built drawings etc. can be useful in conceptualizing field observations and making decisions about how and when to mitigate exposure risks.
When considering the spatial and temporal variations in VOC concentrations detected in the sewer system in this research study, there are several key observations that emerge. Manholes near the 2012 VI Study Area (e.g. MH-17 and MH-18) are likely being (or historically have been) impacted by groundwater infiltration from that general area and sewer videos are useful in providing evidence of sewer cracks. However, in MH-15, which is some distance from the 2012 VI Study Area, local groundwater infiltration/exfiltration in the area of MH-15 is likely occurring. Sewer videos (FOIA, 2017) provide evidence that infiltration could occur near MH-15 and historic subsurface sampling has indicated elevated TCE concentrations in the vicinity of MH-15 (Compliance and Closure, 2013; Stratus Environmental, 2010; FOIA 2017; Bureau Veritas, 2013; Cornerstone Earth Group, 2017). The temporal variation observed in this location is difficult to fully explain, especially in light of the subsurface contamination in the area. Other nearby manholes—MH-12, MH-13, and MH-14—also warrant additional evaluation; however, it is expected that sewer gas concentrations in those manholes would also exhibit a fairly high level of temporal variability.
Collectively, the data presented in this multi-year, multi-sampler research study demonstrates that VI alternative pathways may require investigation along sewer lines that are hundreds of feet away from well-defined groundwater contamination plumes. This is especially true for aging sewer lines that may have received chemical wastes discharges as part of historic operations. Interpreting sewer gas concentrations is complex due to spatial and temporal variations. Other lines of evidence are critical to fully understanding the fate and transport of VOCs in sewer systems and to assess the resulting inhalation exposure risks that may exist in buildings that are connected to the sewer systems.
While research emerges with improved methods for characterizing VI alternative pathways, exposure risks to sewer gas could be reduced by various mitigation techniques, including proper plumbing maintenance, sewer venting, and controlling VOC entry into sewers through sewer maintenance that addresses aging infrastructure issues. Perhaps one of the most prudent and time-sensitive approaches to risk reduction might include monitoring and ensuring proper operation of indoor plumbing fixtures, as well as investing in upgrading aging infrastructure in areas where shallow groundwater with known VOC contamination exists.
Supplementary Material
Highlights.
-
▪
Spatial variation of TCE sewer gas concentrations was observed throughout the study area.
-
▪
Temporal variation of TCE sewer gas concentrations was observed on short-term (hourly) and longer-term (month/year) bases.
-
▪
Single short-term grab samples did not reflect TCE sewer gas concentrations in manholes during subsequent sampling events.
-
▪
Locations of groundwater infiltration and past VOC exfiltration are important for sewer gas investigations.
-
▪
Incorporating passive samplers with continuous monitoring devices can provide insight when attempting to interpret sewer gas concentrations.
Acknowledgments
The authors thank Alana Lee of EPA Region 9. The authors also acknowledge the EPA Region 9 Laboratory for analysis of TO-15 samples, Radiello® samples and sewer liquid samples. In addition, the authors thank Michael Armen and Bruce Richman of Entanglement Technologies for their contributions to the development and construction of the AROMA-TCE analyzer. The project described was supported by a CAREER Award from the National Science Foundation (Award #1452800), a SBIR grant from the National Science Foundation (IIP-1215518), Grant Number P42ES007380 (University of Kentucky Superfund Research Program), and by NIH Grant Number 2R44ES022538 (Entanglement SBIR Superfund Research Program) from the National Institute of Environmental Health Sciences. This material is based upon work supported in part by the National Science Foundation under Grant No. IIP-1330903. The content is solely the responsibility of the authors and does not necessarily represent the official views of the National Institute of Environmental Health Sciences, the National Institutes of Health or the National Science Foundation.
Footnotes
Publisher's Disclaimer: This is a PDF file of an unedited manuscript that has been accepted for publication. As a service to our customers we are providing this early version of the manuscript. The manuscript will undergo copyediting, typesetting, and review of the resulting proof before it is published in its final citable form. Please note that during the production process errors may be discovered which could affect the content, and all legal disclaimers that apply to the journal pertain.
References
- ASCE (American Society of Civil Engineers) Infrastructure Report Card. A Comprehensive Assessment of America’s Infrastructure. 2017 Available at: ( https://www.infrastructurereportcard.org/wp-content/uploads/2016/10/2017-Infrastructure-Report-Card.pdf)
- Brown JL, Shimelis OI, Schultz KL, Vitkuske DS, Ye M, Halpenny MR. Use of unique retention properties of graphitized carbon toward passive sampling of 1, 3-butadiene and other hazardous pollutants in air. Poster presented at Conference & Expo; March 10, 2015; New Orleans, LA. 2015. [Google Scholar]
- Bureau Veritas. Site Investigation Report. Moffett-Gateway Property, Former Vector Control Yard 750 Moffett Boulevard and Northern Adjacent Caltrans 3-acre parcel Mountain View. Santa Clara County; California: 2013. Available at: ( https://yosemite.epa.gov/r9/sfund/r9sfdocw.nsf/688299b284b16e92882574260073faef/8ac40ed34e9df06888257c2400778071/$FILE/82019827.pdf/Investigation%20Rpt_Moffett%20Gateway%20F.pdf) [Google Scholar]
- California Department of Toxic Substances Control (DTSC) Human Health Risk Assessment (HHRA), NOTE NUMBER: 3, DTSC-modified Screening Levels (DTSC-SLs) 2016 Available at: ( https://www.dtsc.ca.gov/AssessingRisk/upload/HHRA_Note_3_-2016-06.pdf)
- Center for Public Environmental Oversight (CPEO) Mountain View, California’s Mystery TCE Hotspots. 2013 Available at: ( http://www.cpeo.org/pubs/MVHotspots.pdf)
- Center for Public Environmental Oversight (CPEO) A Protective Approach to Vapor Intrusion. 2014 Available at: ( http://www.cpeo.org/pubs/MEWVIProtection.pdf)
- City of Palo Alto. Regional water quality control plant lab letter dated April 28, 2014 to Kirsten Struve of Water Shed Protection from Samantha Bialorucki of City of Palo Alto, Results of Analysis of Samples 2014 [Google Scholar]
- Compliance and Closure, Inc. Letter to Ms. Elizabeth Wells from Gary R. Mulkey, dated July 15, 2013, Re: Review of Existing VOC field data, CCI Project No. 12186-3) 2013 Available at: ( https://geotracker.waterboards.ca.gov/regulators/deliverable_documents/2798978507/870%20Leong%20Drive%20Review%20of%20Existing%20VOC%20Field%20Data%20Rpt%20B.pdf)
- Cornerstone Earth Group. Soil Management Plan and Air Monitoring Plan - 750 Moffett Blvd (Moffett Gateway) Mountain View, CA: 2017. Available at: ( https://yosemite.epa.gov/r9/sfund/r9sfdocw.nsf/3dc283e6c5d6056f88257426007417a2/77150113b7fc80f98825813e007205c6/$FILE/49558409.pdf/486-2-6%20Final%20Soil%20Management%20Plan%20Moffett%20Gateway%2006.12.17.pdf) [Google Scholar]
- Corsi RL, Birkett S. A multi-parameter analysis of volatile organic compound emissions from sewers. Water Environment Research. 1995;67(5) [Google Scholar]
- EPA. Record of decision for Fairchild, Intel and Raytheon Sites, Middlefield/Ellis/Whisman (MEW) Study Area, Mountain Viewl, California. San Francisco, CA: 1989. Region 9. ( https://yosemite.epa.gov/r9/sfund/r9sfdocw.nsf/3dc283e6c5d6056f88257426007417a2/214a2ad20b145550882575f5006bb765/$FILE/Record%20of%20Decision,%20MEW%20Study%20Area%20-%206-9-89.pdf) [Google Scholar]
- EPA. National exposure research laboratory office of research and development. Method 524.2, Measurement of purgeable organic compounds in water by capillary column gas chromatography/mass spectrometry, Revision 4.1. 1995 Available at: ( https://www.epa.gov/sites/production/files/2015-06/documents/epa-524.2.pdf)
- EPA. Middlefield-Ellis-Whisman (MEW) superfund study area. Mountain View and Moffett Field, California; San Francisco, California: 2010. Record of decision amendment for the vapor intrusion pathway. Region 9. Available at: ( https://yosemite.epa.gov/r9/sfund/r9sfdocw.nsf/3dc283e6c5d6056f88257426007417a2/717b008a9431066288257782007790bc/$FILE/MEW%20VI%20ROD%20Amendment%20and%20RS%20-%20Aug%2016%202010.pdf) [Google Scholar]
- EPA. OSWER technical guide for assessing and mitigating the vapor intrusion pathway from subsurface vapor sources to indoor air. Environmental Protection Agency; Washington, DC: 2015a. 2015a. Available at: ( https://www.epa.gov/sites/production/files/2015-09/documents/oswervapor-intrusion-technical-guide-final.pdf) [Google Scholar]
- EPA. EPA Update: TCE Hot Spot Areas Source Investigation Findings, Middlefield-Ellis-Whisman (MEW) Superfund Study Area. Mountain View and Moffett Field CA: Neighborhood Meeting; 2015b. Available at: ( https://yosemite.epa.gov/r9/sfund/r9sfdocw.nsf/3dc283e6c5d6056f88257426007417a2/abf23a945d71295d88257f00007af0d7/$FILE/18687784.pdf/EPA%20TCE%20Source%20Investigation%20-%20Neighborhood%20Mtg%20-%20Nov%201,%202015.pdf) [Google Scholar]
- EPA. Passive Samplers for Investigations of Air Quality: Method Description, Implementation, and Comparison to Alternative Sampling Methods. 2015c Available at: ( https://nepis.epa.gov/Adobe/PDF/P100MK4Z.pdf)
- EPA. Regional Screening Levels (RSLs) - Generic Tables. 2016 Available at: ( https://www.epa.gov/risk/regional-screening-levels-rsls-generic-tables-may-2016)
- Freedom of Information Act (FOIA) City of Mountain View Sewer Videos Released by EPA, Region 9. EPA-R9-2017-003246. 2017 Available at: ( https://www.foia.gov)
- Geosyntec Consultants. 2016 Annual program report former Fairchild building 1–4, 9, and 18 Middlefield- Ellis- Whisman area. Mountain View; California: 2017. Available at: https://yosemite.epa.gov/R9/SFUND/R9SFDOCW.NSF/cf0bac722e32d408882574260073faed/fc31b0098cf5a9488825810600515a13/$FILE/88391596.pdf/2016%20Annual%20Progress%20Report%20-%20501%20Ellis%20Street.pdf. [Google Scholar]
- Guo Y, Holton C, Luo H, Dahlen P, Gorder K, Dettenmaier E, Johnson P. Identification of alternative vapor intrusion pathways using controlled pressure testing, soil gas monitoring, and screening model calculations. Environ. Sci. Technol. 2015;49(22) doi: 10.1021/acs.est.5b03564. 13472e13482. ( http://dx.doi.org/10.1021/acs.est.5b03564) [DOI] [PubMed] [Google Scholar]
- Holton C. Presented at EPA/AEHS Workshop. Association of Environmental Health Sciences (AEHS); San Diego, CA: 2016. Increasing Availability of Continuous and Real-Time VOC Monitoring Technologies for VI Assessment. Available at: ( https://iavi.rti.org/attachments/WorkshopsAndConferences/13_Holton_Cont_RT_Monitoring_AEHS_final.pdf) [Google Scholar]
- Jacobs JA, Jacobs OP, Pennell KG. One Alternate Exposure Pathway of VOC Vapors from Contaminated Subsurface Environments into Indoor Air – Legacy Sewer-Plumbing Systems. Groundwater Resources Association of California; Hydro visions. 2015:20–24. Available at: ( http://nebula.wsimg.com/390f6305810d89bb2eff5bfaf022df59?AccessKeyId=5161BD921A995425678B&disposition=0&alloworigin=1)
- McHugh T, Beckley A, Sullivan T, Lutes C, Truesdale R, Uppencamp R, Cosky B, Zimmerman J, Schumacher B. Evidence of a sewer vapor transport pathway at the EPA vapor intrusion research duplex. Science of the Total Environment. 2017;598:772–779. doi: 10.1016/j.scitotenv.2017.04.135. [DOI] [PMC free article] [PubMed] [Google Scholar]
- Nielsen KB, Hvidberg B. Remediation techniques for mitigating vapor intrusion from sewer systems to indoor air Remediation. 2017;27:67–73. ( https://doi.org/10.1002/rem.21520) [Google Scholar]
- Olson DA, Varma S, Corsi RL. A new approach for estimating volatile organic compound emissions from sewers: methodology and associated errors. Water Environment Research. 1998;70 [Google Scholar]
- Pennell KG, Scammell MK, McClean MD, Ames J, Weldon B, Friguglietti L, Suuberg EM, Shen R, Indeglia PA, Heiger-Bernays WJ. Sewer gas: an indoor air source of PCE to consider during vapor intrusion investigations. Ground Water Monit. Rem. 2013:119–126. doi: 10.1111/gwmr.12021. ( http://dx.doi.org/10.1111/gwmr.12021) [DOI] [PMC free article] [PubMed]
- Riis CE, Christensen AG, Hansen MH, Husum H. Vapor Intrusion through sewer systems: migration pathways of chlorinated solvents from groundwater to indoor air. Presented at the Seventh Battelle International Conference on Remediation of Chlorinated and Recalcitrant Compounds, Monterey. 2010 Available at: ( http://indoorairproject.files.wordpress.com/2011/03/sgsattachment-1.pdf)
- Shepherd JL, Corsi RL, Kemp J. Chloroform in Indoor Air and Wastewater: The Role of Residential Washing Machines. Journal of the Air & Waste Management Association. 1996;46:631–642. doi: 10.1080/10473289.1996.10467497. [DOI] [PubMed] [Google Scholar]
- Stratus Environmental, Inc. Letter to Ms. Elizabeth Wells from Gowri S. Kowtha, dated December 29, 2010, Re: Subsurface Environmental Site Assessment Report. 2010 Available at: ( https://geotracker.waterboards.ca.gov/regulators/deliverable_documents/8155500113/850%20Leong%20Environmental%20Site%20Assessment%20Rpt.pdf)
- Water Environment Federation (WEF) Characterization and Sampling of Wastewater. 2007 Available at: _ www.wefnet.org/...Wastewater.../Chapter%2017%20Revised_6th%20Edition.pdf.
Associated Data
This section collects any data citations, data availability statements, or supplementary materials included in this article.


