Abstract
Context:
Type 2 diabetes mellitus has profound implications on the skeleton. Even though bone mineral density is increased in type 2 diabetes mellitus patients, they are more prone for fractures. The weakening of bone tissue in type 2 diabetes mellitus can be due to uncontrolled blood sugar levels leading to high levels of bone turnover markers in blood.
Aims:
The aim of this study is to find the association between glycemic status and bone turnover markers in type 2 diabetes mellitus.
Settings and Design:
This case–control study was carried out in a tertiary health care hospital.
Subjects and Methods:
Fifty clinically diagnosed type 2 diabetes mellitus patients in the age group between 30 and 50 years were included as cases. Fifty age- and gender-matched healthy nondiabetics were included as controls. Patients with complications and chronic illness were excluded from the study. Depending on glycated hemoglobin (HbA1c) levels, patients were grouped into uncontrolled (HbA1c >7%, n = 36) and controlled (HbA1c <7%, n = 14) diabetics. Based on duration of diabetes, patients were grouped into newly diagnosed, 1–2 years, 3–5 years, and >5 years. Serum osteocalcin (OC), bone alkaline phosphatase (BAP), acid phosphatase (ACP), and HbA1c levels were estimated. OC/BAP and OC/ACP ratio was calculated.
Statistical Analysis Used:
Student's t-test, analysis of variance, and Chi-square tests were used for analysis. Receiver operating characteristic (ROC) curve analysis was done for OC/BAP and OC/ACP ratios.
Results:
Serum OC, HbA1c, and OC/BAP ratio were increased in cases when compared to controls and were statistically significant (P < 0.001). OC/ACP ratio was decreased in type 2 diabetes mellitus and was statistically significant (P = 0.01). In patients with >5-year duration of diabetes, HbA1c level was high and was statistically significant (P < 0.042). BAP levels were high in uncontrolled diabetics but statistically not significant. ROC curve showed OC/BAP ratio better marker than OC/ACP ratio.
Conclusions:
Uncontrolled type 2 diabetes mellitus affects bone tissue resulting in variations in bone turnover markers. Bone turnover markers are better in predicting recent changes in bone morphology and are cost effective.
Keywords: Bone turnover markers, glycated hemoglobin, osteocalcin to acid phosphatase ratio, osteocalcin to bone alkaline phosphatase, type 2 diabetes mellitus
Introduction
Diabetes mellitus is a common endocrine disease in most parts of the world. The chronic complications of diabetes include microvascular complications such as nephropathy, retinopathy, neuropathy, and macrovascular complications like acute coronary syndrome and stroke. Apart from above, various facets of the bone and its metabolism including the structure, density, skeletal integrity, and biochemical markers of bone turnover may be affected by diabetes. The fact remains that bone disease is frequently overlooked as a complication of diabetes.[1] Despite the higher bone mineral density (BMD), patients with type 2 diabetes mellitus are more susceptible to fractures than nondiabetic controls. The increased fracture risk is supported by a larger Danish study, where type 2 diabetics without late complications had a relative risk of any fracture of 1.13.[2] This indicates a weakening of bone biomechanical competence beyond what can be measured by BMD. This disruption of bone may be brought about by alterations in bone turnover rate and collagen synthesis, as BMD mainly reflects calcium content in the bone. Several studies have investigated the relationship between bone turnover markers and chronic systemic diseases, and type 2 diabetes mellitus is one among them. Recent research on effects of diabetes on skeletal system suggests that patients with type 2 diabetes mellitus are at increased risk of bone fragility because of impaired or poor glycemic control, longer disease duration, and complications of diabetes. These studies have investigated the changes in bone tissue in type 2 diabetes mellitus by radiographic and densitometry techniques. However, there are limited studies available reporting biochemical markers of bone turnover, the significance of osteocalcin (OC) to bone alkaline phosphatase (BAP) and OC to acid phosphatase (ACP) ratios in type 2 diabetes mellitus.
OC is a valid marker of bone turnover both when formation and resorption are uncoupled as well as when formation and resorption are coupled. OC becomes gamma carboxylated at three glutamine terminals; hence, it can interact with hydroxyapatite. When fewer than three terminals are gamma carboxylated, it is undercarboxylated (Uc). Besides being a marker of bone formation, OC and UcOC are also associated with beta-cell function and insulin sensitivity and may be involved in regulation plasma glucose levels.[3] A human study concluded that OC is associated with improved glucose tolerance.
BAP is a marker of bone formation and is increased in metabolic bone diseases including osteoporosis, osteomalacia, rickets, and hyperparathyroidism. The measurement of BAP has advantages over OC measurement because of its relatively long half-life in vivo and is unaffected by diurnal variation.[4] OC/BAP ratio can be one of the potential markers clinically used to predict fracture risk in type 2 diabetes mellitus men,[5] but only one study has reported this till now, and hence, our study assumes relevance in the measurement of OC/BAP ratio in type 2 diabetes mellitus.
ACP is one of the hydrolytic enzymes present in the lysosomes of cells from a variety of tissues and optimally active at pH 5 and is marker for bone resorption. OC/ACP ratio can be one of the novel markers studied in type 2 diabetes mellitus patients, and till now, no study has reported OC/ACP ratio in type 2 diabetes mellitus.
The primary aim of this study was to investigate the biochemical markers of bone turnover in serum of patients with type 2 diabetes mellitus and to find the association between glycated hemoglobin (HbA1c) and bone turnover markers.
Subjects and Methods
This case–control study was conducted at a tertiary health-care setup following approval by the Institute Ethics Committee. Fifty clinically diagnosed type 2 diabetes mellitus patients in the age group between 30 and 50 years of both genders who had attended the general medicine outpatient department were included as cases. Type 2 diabetes mellitus patients who were on oral hypoglycemic drugs like metformin were included in the study. An equal number of age- and gender-matched healthy controls were included in the study. An informed consent was obtained from all individual participants included in the study. Patients suffering from any other chronic illness such as thyroid, kidneys, autoimmune disorders, and alcoholics as well as tobacco chewers, smokers were excluded from the study. The patients who were on insulin, multivitamins, calcium, and other mineral supplements were excluded from the study.
After taking all aseptic precautions, 5 ml of venous blood was collected from the antecubital vein. Two milliliter was collected in a red stoppered plain tube, 1 ml in fluoride tube, and 2 ml in ethylenediaminetetraacetic acid vacutainer. Blood samples were centrifuged at 3000 rpm. Serum total ACP was assayed immediately by spectrophotometric technique and alkaline phosphatase by a spectrophotometric technique in autoanalyzer Hitachi 902.
BAP was estimated by heat inactivation method. In this method, 2 ml of serum was placed in a water bath for 5 min at 65°C and was immediately cooled in the ice box after this period. This stage of thermal incubation leads to inactivation of bone, liver, and intestinal isoenzymes to 100%. Following this procedure, the serum sample was estimated for BAP in autoanalyzer Hitachi 902. Serum OC was estimated by ELISA technique using a kit from DIA source – host, Belgium. OC/BAP and OC/ACP ratio was calculated. HbA1c was estimated in Bio-Rad D10 analyzer by high-performance liquid chromatography method. Type 2 diabetes mellitus cases were divided into two groups based on their HbA1c values as HbA1c >7% (uncontrolled) and HbA1c <7% (controlled) diabetics and based on their duration of diabetes as newly diagnosed cases, 1–2 years, 3–5 years, and >5 years.
Results
Descriptive and inferential statistical analysis was carried out in the present study. Results on continuous measurements were presented as mean ± standard deviation (minimum − maximum), and results on categorical measurements were presented in number (%). Statistical significance was assessed at 5% level of significance. P < 0.05 was considered statistically significant.
Analysis of variance was used to find the significance of study parameters between three or more groups of patients. Student's t-test (two-tailed, independent) was used to find the significance of study parameters on continuous scale between two groups (intergroup analysis) on metric parameters. Chi-square/Fisher Exact test was employed to find out the significance of study parameters on categorical scale between two or more groups and nonparametric setting for qualitative data analysis. The Statistical software, namely, SAS version 9.2 (SAS Institute Inc., Cary, NC, USA.), SPSS version 15.0 (SPSS Inc, Chicago), Stata version 10.1 (StataCorp. 2007. Stata Statistical Software: Release 10. College Station, TX: StataCorp LP.), MedCalc version 9.0.1 (MedCalc Software, Ostend, Belgium), SYSTAT version 12.0 (Systat Software, San Jose, CA), and R environment version 2.11.1 (R Foundation for Statistical Computing, Vienna, Austria) was used for the analysis of the data, and Microsoft Word and Excel were used to generate graphs and tables.
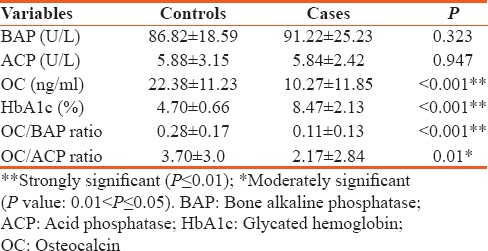
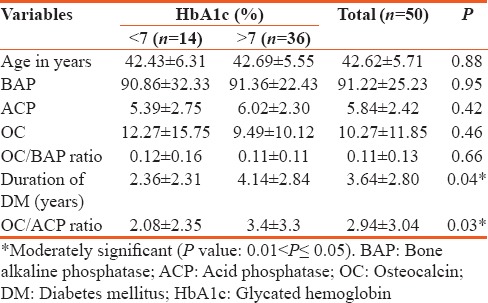
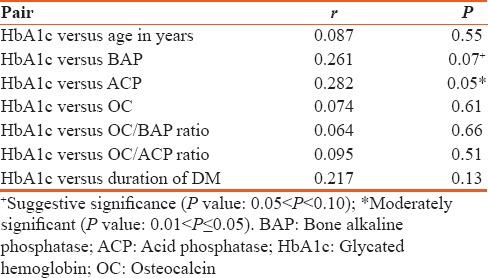
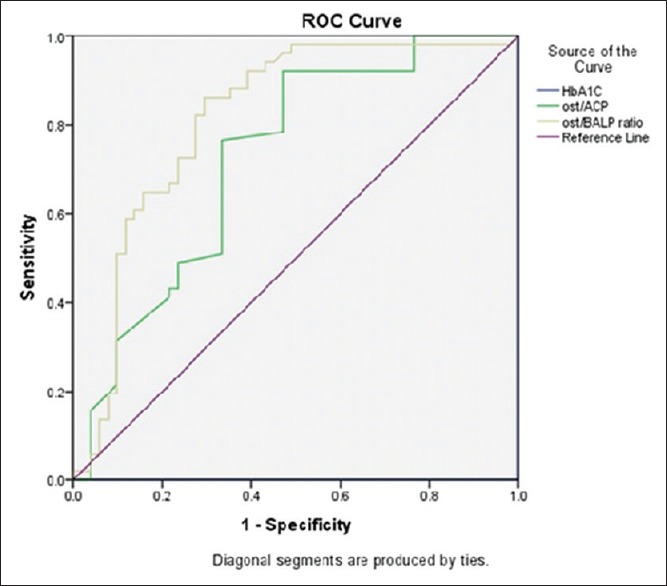
The mean age of type 2 diabetes mellitus cases was 42.62 ± 5.71 and in controls 40.10 ± 5.43 and is statistically significant (P < 0.026). Statistically significant elevation in serum OC, HbA1c, and OC/BAP ratio was seen in type 2 diabetes mellitus cases when compared to healthy nondiabetic as shown in Table 1 (P < 0.001). HbA1c was >7% in patients with >5 years of duration of diabetes and is statistically significant (P < 0.042). Serum OC and OC/BAP ratio was decreased in uncontrolled diabetics. BAP and ACP were increased in uncontrolled diabetics but statistically not significant as shown in Table 2. Table 3 depicts study parameters in different duration of diabetes. Serum OC, BAP, and ACP were decreased in patients with >5 years of duration of diabetes but statistically not significant. OC/ACP ratio was decreased in cases when compared to controls and is statistically significant (P = 0.01). Pearson correlation analysis was performed between HbA1c and bone turnover markers [Table 4]. There was no good correlation between HbA1c and bone turnover markers. HbA1C with BAP (r = 0.26, P = 0.07) and ACP (r = 0.28, P = 0.05) correlation was statistically significant. Receiver operating characteristic (ROC) curve [Figure 1] analysis was done for OC/BAP and OC/ACP ratios. It depicts area under the curve (AUC) for OC/BAP ratio is high [0.81, Table 5] compared to OC/ACP ratio (0.71) and is better marker compared to OC/ACP ratio.
Table 1.
Mean value of study variables in cases and controls

Table 2.
Mean values of study parameters in controlled and uncontrolled glycemic status in type 2 diabetes mellitus

Table 3.
Mean values of study parameters in different duration of diabetes

Table 4.
Pearson correlation between study parameters and glycated hemoglobin

Figure 1.

Receiver operating characteristic curve of osteocalcin/acid phosphatase and osteocalcin/bone alkaline phosphatase ratio
Table 5.
Receiver operating characteristics curve analysis

Discussion
Aging, sedentary lifestyle, and multifactorial causes have increased the incidence of diabetes mellitus population in most of the countries and complications such as the disorders of bone and mineral metabolism are becoming increasingly relevant in every day clinical practice. Consequently, the need for effective measures to be used in the screening, diagnosis, and follow-up of such pathologies has markedly grown. Together with clinical and imaging techniques, biochemical tests play an important role in the assessment and differential diagnosis of metabolic bone disease. These biochemical indices are noninvasive, comparatively inexpensive, and when applied and interpreted correctly, act as helpful tools in the diagnosis and therapeutic assessment of metabolic bone diseases. Many studies have reported about bone turnover markers in type 2 diabetes mellitus, but there are few studies reporting OC/BAP and OC/ACP ratios in type 2 diabetes mellitus with different duration of diabetes. The study group was divided based on their HbA1c levels into two groups as HbA1c <7% (controlled) and HbA1c >7% (uncontrolled type 2 diabetes mellitus).
Type 2 diabetes mellitus cases were on oral hypoglycemic drugs like metformin. The biguanides derivative metformin an insulin sensitizer has been shown to increase osteoblast proliferation and differentiation and also augments type 1 collagen formation in cell culture. In addition, it inhibits adipocyte differentiation and promotes osteoblast differentiation. In a study done by Vestergaard et al.,[6] metformin utilization was associated with decreased risk of fractures. There are limited numbers of studies on effect of sulfonylureas on bone metabolism, and there was no difference in the risk of fractures among users of thiazolidinedione and other antidiabetic drugs in a study done by Kumar et al.[7]
As the duration of diabetes increased, the level of HbA1c also increased and is statistically significant [Table 3, P < 0.042]. Studies conducted by Arnetz et al.[8] and Kilpatrick et al.[9] in diabetic patients have shown a significant positive correlation between HbA1c and age as well as the duration of diabetes. The mean value of BAP is slightly increased in uncontrolled type 2 diabetes mellitus compared to controls but statistically not significant. The elevation in BAP could be due to prolonged exposure to parathyroid hormone (PTH) which in turn increases osteoblastic activity,[10] but in our study, we did not quantify intact PTH because of limited funds. The decrease in serum OC in uncontrolled type 2 diabetes mellitus could be due to inhibition of osteoblast function due to impaired insulin secretion and increase in insulin resistance.[11] The increase in serum ACP in uncontrolled type 2 diabetes mellitus might be due to increased activity of lysosomal enzymes in hyperglycemic state.[12] Hence, in our study, OC/ACP ratio was decreased in type 2 diabetes mellitus when compared to controls and may indicate bone resorptive activity in type 2 diabetes mellitus, and till now, no studies have reported about OC/ACP ratio.
OC/BAP ratio was decreased in uncontrolled diabetics compared to controlled but statistically not significant. Kanazawa et al.[5] found that OC/BAP ratio is a predictor for the presence of vertebral fractures in men with type 2 diabetes mellitus and a negative correlation was found between the ratio and fracture risk. There are limited numbers of studies on OC/BAP ratio in uncontrolled type 2 diabetes mellitus.
The present study parameters were assayed in different duration of diabetes as shown in [Table 3]. BAP, ACP, and OC levels were decreased in >5 years of duration of diabetes compared to new cases but statistically not significant.[13] The serum OC levels were decreased in a group with >5 years of duration diabetes this could be due to inhibition of osteoblastic function due to hyperglycemia and insulin-resistant state.[14]
Pearson correlation analysis showed no correlation between HbA1C, OC, and BAP which is in accordance with a study done by Starup-Linde.[1] The glycemic status may increase, decrease, or may not change the serum OC level in type 2 diabetes mellitus. There was no good correlation between HbA1c with OC, BAP, ACP, OC/BAP, and OC/ACP ratios which implies the bone turnover in type 2 diabetes mellitus depends on long-term glycemic status of the patients rather than HbA1c which shows only previous 3-month glycemic status.
ROC curve analysis was done for OC/ACP and OC/BAP ratios [Table 5]. The OC/BAP ratio was having increased sensitivity, specificity, and AUC when compared to OC/ACP ratio and it implies OC/BAP ratio is a better marker to predict bone changes in type 2 diabetes mellitus.
Conclusions
This study suggests that in uncontrolled type 2 diabetes mellitus, serum OC level was decreased and ACP levels were increased can be due to increase in insulin resistance and increased activity of lysosomal enzymes, respectively. As the duration of diabetes increased, there was a decrease in the levels of bone turnover markers due to hyperglycemia-induced inhibition of osteoblastic function. Serum OC concentration can be helpful for monitoring follow-up changes in bone in type 2 diabetes mellitus. OC/BAP ratio can be a better bone turnover marker compared to OC/ACP ratio as indicated by ROC curve. These biochemical indices together with clinical and imaging studies can be helpful tools in the diagnosis and therapeutic assessment of metabolic bone diseases.
Financial support and sponsorship
Nil.
Conflicts of interest
There are no conflicts of interest.
References
- 1.Starup-Linde J. Diabetes, biochemical markers of bone turnover, diabetes control, and bone. Front Endocrinol (Lausanne) 2013;4:21. doi: 10.3389/fendo.2013.00021. [DOI] [PMC free article] [PubMed] [Google Scholar]
- 2.Sharifi F, Ahmadimoghadam N, Mousavinasab N. The relationship between type 2 diabetes mellitus and bone density in postmenopausal women. Int J Endocrinol Metab. 2006;3:117–22. [Google Scholar]
- 3.Lee AJ, Hodges S, Eastell R. Measurement of osteocalcin. Ann Clin Biochem. 2000;37(Pt 4):432–46. doi: 10.1177/000456320003700402. [DOI] [PubMed] [Google Scholar]
- 4.Sultan E, Taha I, Saber LM. Altered bone metabolic markers in type 2 diabetes mellitus: Impact of glycaemic control. J Taibah Univ Med Sci. 2008;3:104–16. [Google Scholar]
- 5.Kanazawa I, Yamaguchi T, Yamamoto M, Yamauchi M, Yano S, Sugimoto T. Serum osteocalcin/bone-specific alkaline phosphatase ratio is a predictor for the presence of vertebral fractures in men with type 2 diabetes. Calcif Tissue Int. 2009;85:228–34. doi: 10.1007/s00223-009-9272-4. [DOI] [PubMed] [Google Scholar]
- 6.Vestergaard P, Rejnmark L, Mosekilde L. Relative fracture risk in patients with diabetes mellitus, and the impact of insulin and oral antidiabetic medication on relative fracture risk. Diabetologia. 2005;48:1292–9. doi: 10.1007/s00125-005-1786-3. [DOI] [PubMed] [Google Scholar]
- 7.Kumar BS, Ravisankar A, Mohan A, Kumar DP, Katyarmal DT, Sachan A, et al. Effect of oral hypoglycaemic agents on bone metabolism in patients with type 2 diabetes mellitus and occurrence of osteoporosis. Indian J Med Res. 2015;141:431–7. doi: 10.4103/0971-5916.159287. [DOI] [PMC free article] [PubMed] [Google Scholar]
- 8.Arnetz BB, Kallner A, Theorell T. The influence of aging on hemoglobin A1c (HbA1c) J Gerontol. 1982;37:648–50. doi: 10.1093/geronj/37.6.648. [DOI] [PubMed] [Google Scholar]
- 9.Kilpatrick ES, Dominiczak MH, Small M. The effects of ageing on glycation and the interpretation of glycaemic control in type 2 diabetes. QJM. 1996;89:307–12. doi: 10.1093/qjmed/89.4.307. [DOI] [PubMed] [Google Scholar]
- 10.Withold W, Schulte U, Reinauer H. Method for determination of bone alkaline phosphatase activity: Analytical performance and clinical usefulness in patients with metabolic and malignant bone diseases. Clin Chem. 1996;42:210–7. [PubMed] [Google Scholar]
- 11.Milczarczyk A, Franck E. Osteoporosis and bone fractures in patients with diabetes mellitus. Diabetol Dośw Kliniczna. 2008;8:63–7. [Google Scholar]
- 12.Pushparani DS, Nirmala S. Comparison of acid phosphatase and β D-glucuronidase enzyme levels in type 2 diabetes mellitus with and without periodontitis. Int J Sci Eng Res. 2013;4:1164–8. [Google Scholar]
- 13.Rubin MR, Patsch JM. Assessment of bone turnover and bone quality in type 2 diabetic bone disease: Current concepts and future directions. Bone Res. 2016;4:16001. doi: 10.1038/boneres.2016.1. [DOI] [PMC free article] [PubMed] [Google Scholar]
- 14.Gerdhem P, Isaksson A, Akesson K, Obrant KJ. Increased bone density and decreased bone turnover, but no evident alteration of fracture susceptibility in elderly women with diabetes mellitus. Osteoporos Int. 2005;16:1506–12. doi: 10.1007/s00198-005-1877-5. [DOI] [PubMed] [Google Scholar]


