

Abstract
Postsynaptic density protein‐95 (PSD‐95) localizes AMPA‐type glutamate receptors (AMPARs) to postsynaptic sites of glutamatergic synapses. Its postsynaptic displacement is necessary for loss of AMPARs during homeostatic scaling down of synapses. Here, we demonstrate that upon Ca2+ influx, Ca2+/calmodulin (Ca2+/CaM) binding to the N‐terminus of PSD‐95 mediates postsynaptic loss of PSD‐95 and AMPARs during homeostatic scaling down. Our NMR structural analysis identified E17 within the PSD‐95 N‐terminus as important for binding to Ca2+/CaM by interacting with R126 on CaM. Mutating E17 to R prevented homeostatic scaling down in primary hippocampal neurons, which is rescued via charge inversion by ectopic expression of CaMR 126E, as determined by analysis of miniature excitatory postsynaptic currents. Accordingly, increased binding of Ca2+/CaM to PSD‐95 induced by a chronic increase in Ca2+ influx is a critical molecular event in homeostatic downscaling of glutamatergic synaptic transmission.
Keywords: calcium, calmodulin, dendritic spines, hippocampus, PSD‐95
Subject Categories: Neuroscience
Introduction
Most synapses in the brain utilize glutamate as their neurotransmitter (Micheva et al, 2010). It stimulates postsynaptic AMPA‐type glutamate receptors (AMPARs) that are exactly juxtaposed to presynaptic glutamate release sites (Tang et al, 2016; Sinnen et al, 2017). Basal synaptic transmission is largely mediated by Na+ influx through AMPARs. The synaptic strength is typically very stable over long periods of time but a temporary increase in synaptic activity can induce long‐term potentiation (LTP) or long‐term depression (LTD) at individual synapses, which are mediated by trafficking of AMPARs into and out of the activated synapses, respectively (Collingridge et al, 2004; Malenka & Bear, 2004; Huganir & Nicoll, 2013). In contrast, prolonged changes in synaptic activity causing a chronic increase or decrease in overall postsynaptic Ca2+ influx lead to a neuron‐wide down‐ or up‐regulation of postsynaptic strength, respectively, by regulating postsynaptic AMPAR content. Such homeostatic synaptic scaling is critical for keeping neurons in the correct dynamic range. Cumulative LTP events in an individual neuron could lead to overexcitation of a neuron. To curb excitation, a lasting substantial overall increase in synaptic input into a neuron triggers a uniform decrease in synaptic strength over its whole synapse population (O'Brien et al, 1998; Turrigiano et al, 1998), termed synaptic scaling down. Such homeostatic adaptation serves to stabilize the neuronal network by offsetting the destabilizing effect of such activity changes. In addition, it has been implicated in neurodevelopment (Desai et al, 2002) and in the etiology of neurological disorders (Pratt et al, 2011; Fernandes & Carvalho, 2016).
Scaling down of synaptic strength in response to chronic elevation of neuronal activity is expressed mainly by down‐regulation of synaptic AMPAR abundance (Wang et al, 2012). Previous studies have identified different signaling molecules and pathways regulating AMPAR postsynaptic localization in homeostatic synaptic scaling up induced by decreased synaptic input into a neuron. Accordingly, scaling up requires GRIP1, which binds to the C‐terminus of GluA2 subunits and can stabilize GluA2‐containing AMPARs at postsynaptic sites (Gainey et al, 2015; Tan et al, 2015); the μ3A subunit, which is typically a central part of the adaptor protein complex AP3A but appears to act on its own to redirect AMPARs away from the AP3A‐mediated trafficking to lysosomes (Steinmetz et al, 2016); and phosphorylation of the AMPAR subunit GluA1 on S845 by AKAP5‐anchored PKA (Diering et al, 2014; Kim & Ziff, 2014), which likely acts by driving GluA1 homomeric AMPARs to perisynaptic and ultimately postsynaptic sites (Hayashi et al, 2000; Esteban et al, 2003; Thiagarajan et al, 2005; Yang et al, 2008; He et al, 2009; Joiner et al, 2010; Sanderson et al, 2016). In the context of scaling up, S845 phosphorylation is further augmented by decreased dephosphorylation by the Ca2+/calmodulin‐dependent phosphatase calcineurin/PP2B as the reduction in neuronal activity that leads to scaling up decreases Ca2+ influx (Kim & Ziff, 2014). The reversal of S845 phosphorylation appears to contribute to scaling down (Diering et al, 2014) as does ubiquitination and proteasomal degradation of AMPARs (Hou et al, 2011) and disinhibition (i.e., activation) of the phosphatase PP1 due to phosphorylation of its endogenous antagonist inhibitor‐2 by the Ca2+/calmodulin‐dependent myosin light chain kinase, which might contribute to scaling down by dephosphorylating the AMPAR GluA2 subunit on S880 (Siddoway et al, 2013). Nevertheless, the molecular pathway linking chronic synaptic activation and homeostatic scaling down of AMPARs remains largely unmapped. This mechanism is absolutely critical for maintaining proper neuronal function because reiterative increases in excitatory input into a neuron as occurring upon multiple events of LTP over time could lead to overstimulation of this neuron.
PSD‐95 plays an important role in scaling down (Sun & Turrigiano, 2011). It anchors AMPARs at postsynaptic sites (El‐Husseini et al, 2000; El‐Husseini Ael & Bredt, 2002; Elias et al, 2006; Schluter et al, 2006). PSD‐95 consists of three PDZ domains, an SH3 domain, and a guanylate kinase homology domain (GK). It maintains postsynaptic AMPAR accumulation by interacting through its first and second PDZ domains with the very C‐terminal ends of auxiliary subunits called transmembrane AMPAR regulatory proteins (TARPs), including stargazin (Stg, γ2) and its homologs γ3, γ4, and γ8 (Chen et al, 2000; Schnell et al, 2002; Opazo et al, 2010). PSD‐95 itself is palmitoylated at two cysteine residues (C3 and C5) at its very N‐terminus, which is required for its postsynaptic localization (El‐Husseini Ael et al, 2002). Chronic silencing of synaptic activity enhances PSD‐95 palmitoylation (Noritake et al, 2009). Acute Ca2+ influx through NMDA‐type glutamate receptors (NMDARs) releases PSD‐95 temporarily from postsynaptic membranes (Sturgill et al, 2009; Nelson et al, 2013). This release is an important part of the molecular mechanism of LTD (Nelson et al, 2013).
Ca2+/calmodulin (Ca2+/CaM) interacts with PSD‐95 and its homologues SAP97 and SAP102 via their HOOK segments located between their SH3 and GK domains (Masuko et al, 1999; Paarmann et al, 2002; Fukunaga et al, 2005; Bartos et al, 2010). We recently found that Ca2+/CaM also binds to the N‐terminal 16 residues of PSD‐95 (Zhang et al, 2014). We showed by NMR structural analysis that both CaM lobes collapse around a helix formed by PSD‐95 residues 1–14 (Zhang et al, 2014). This interaction shields two palmitoylation sites (C3 and C5) that are crucial for postsynaptic targeting of PSD‐95. Y12 in PSD‐95 makes the most contacts with Ca2+/CaM (Zhang et al, 2014). The Y12E mutation abrogates binding of Ca2+/CaM. It does not affect basal PSD‐95 palmitoylation but antagonizes the Ca2+‐induced reduction in PSD‐95 palmitoylation and impairs the release of PSD‐95 from postsynaptic membranes upon Ca2+ influx (Zhang et al, 2014).
PSD‐95 can be phosphorylated at T19 by GSK3β (Nelson et al, 2013) in neurons and in vitro also by CDK5 (Morabito et al, 2004). Phosphorylation of PSD‐95 at T19 promotes Ca2+‐induced mobilization of PSD‐95 during LTD (Nelson et al, 2013). Because our previous structural analysis did not resolve potential interactions between Ca2+/CaM and the N‐terminal sequence of PSD‐95 beyond residue 13, we tested whether phosphorylation of T19 increases the affinity for Ca2+/CaM, which is in fact the case. This finding allowed us to solve the NMR structure of Ca2+/CaM bound to the N‐terminal 21 residues of PSD‐95 with T19 being phosphorylated (PSD‐95_pT19). This structure revealed that E17 of PSD‐95 forms a salt bridge with R126 of CaM, creating a unique opportunity for a charge inversion experiment. This charge inversion approach permitted us to unequivocally show that Ca2+/CaM binding to the N‐terminus of PSD‐95 drives the loss of postsynaptic PSD‐95 and with it AMPARs during synaptic scaling down in response to chronically elevated neuronal activity. Thus, we identify a central molecular mechanism that underlies homeostatic synaptic scaling down, and begin to understand how this downscaling works.
Results
Structural analysis of Ca2+/CaM binding to the N‐terminus of PSD‐95
Previously, we solved the NMR structure of Ca2+/CaM bound to an unphosphorylated N‐terminal polypeptide of PSD‐95 expressed in E. coli (residues 1–71), which revealed the first 13‐residues of PSD‐95 to be sequestered inside a hydrophobic cavity formed by both lobes of Ca2+/CaM (Zhang et al, 2014). T19 phosphorylation augments Ca2+‐induced mobilization of PSD‐95 during LTD (Nelson et al, 2013). Thus, we considered that phosphorylation could affect Ca2+/CaM binding to the PSD‐95 N‐terminus. We first compared the binding of Ca2+/CaM to both phosphorylated and unphosphorylated synthetic PSD‐95 peptides (residues 1–21). For this purpose, we titrated synthetic fluorescein‐labeled N‐terminal PSD‐95 peptides (residues 1–21) with Ca2+/CaM and monitored fluorescence polarization (FP) to measure their dissociation constants (K d; Fig EV1; Zhang et al, 2014). As hypothesized, the PSD‐95 phosphorylation at T19 enhanced its binding to Ca2+/CaM by more than twofold (Table 1). Similar to earlier findings for the non‐phosphorylated N‐terminus of PSD‐95 (Zhang et al, 2014), PSD‐95_pT19 binding to apoCaM was undetectable (Fig EV1). To understand the structural basis of this phosphorylation‐induced enhancement of Ca2+/CaM binding and to inform functional experiments, we determined the atomic resolution NMR structure of Ca2+/CaM bound to a PSD‐95 N‐terminal peptide (residues 1–21) phosphorylated at T19 (PSD‐95_pT19).
Figure EV1. Titration of PSD‐95 peptide with Ca2+/CaM.
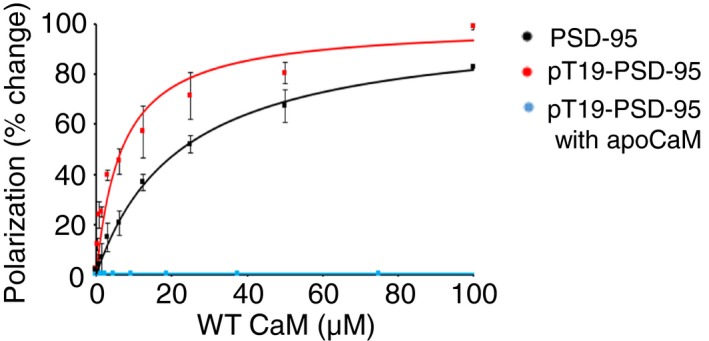
Fluorescently labeled PSD‐95 peptides (residues 1–21), which were either phosphorylated (red, blue) or unphosphorylated on T19 (black), were titrated with increasing amounts of Ca2+/CaM (black, red) or apoCaM (blue) and fluorescence polarization (FP) monitored. Basal levels of FP obtained in the absence of Ca2+/CaM were determined for each titration and subtracted. Mean values from three independent titrations (± SD) are indicated and fitted to a one‐site binding model (see Materials and Methods). Solid lines represent theoretical FP values calculated using a one‐site binding model as described in Materials and Methods. Calculated dissociation constants are given in Table 1.
Table 1.
Dissociation constants (in μM) for Ca2+/CaM binding to PSD‐95 by FP
| CaM | ||||
|---|---|---|---|---|
| WT | R126E | K115E | ||
| PSD‐95 peptide | WT | 22.5 ± 1.7 | N.D. | / |
| pT19 | 8.6 ± 0.6 | / | / | |
| Q15A | 64.1 ± 4.8 | / | / | |
| E17R | 77.8 ± 5.9 | 22.8 ± 3.5 | / | |
| T19K | 32.3 ± 2.4 | / | 11.5 ± 0.8 | |
| T19E | 18.5 ± 1.4 | / | 115.8 ± 8.7 | |
N.D., not detectable.
The two‐dimensional HSQC NMR spectrum of 15N‐labeled Ca2+/CaM in the presence of saturating unlabeled PSD‐95_pT19 demonstrated that Ca2+/CaM binds to PSD‐95_pT19 with a 1:1 stoichiometry and forms a stably folded complex. Comparison of NMR spectra of Ca2+/CaM bound to PSD‐95_pT19 (green peaks in Fig 1A) versus free Ca2+/CaM (red peaks in Fig 1A) revealed many Ca2+/CaM residues that exhibited large spectral shifts caused by the binding of PSD‐95_pT19 (e.g., K115, T117, and R126 in Fig 1A). The full list of chemical shift perturbation values as a function of Ca2+/CaM residue number is shown in Fig 1B. To more rigorously probe the structure of the complex, we performed a detailed analysis of NMR residual dipolar couplings (RDCs) of 15N‐labeled Ca2+/CaM bound to unlabeled PSD‐95_pT19 as described previously (Zhang et al, 2014) (Fig 1C). The RDC data provided important restraints for the orientation of each main chain amide group in the protein and therefore helped define the relative orientation of each α‐helix in the structure. The RDC and chemical shift perturbation data were both used as structural restraints within HADDOCK to experimentally guide the molecular docking of Ca2+/CaM bound PSD‐95_pT19 (see Materials and Methods). The final docked structures had an RMSD of 0.5 angstroms and correlation coefficient of R = 0.99 when comparing the 74 observed RDCs with RDCs calculated by the final structure (Fig 1D).
Figure 1. NMR analysis of Ca2+/CaM binding to PSD‐95_pT19.
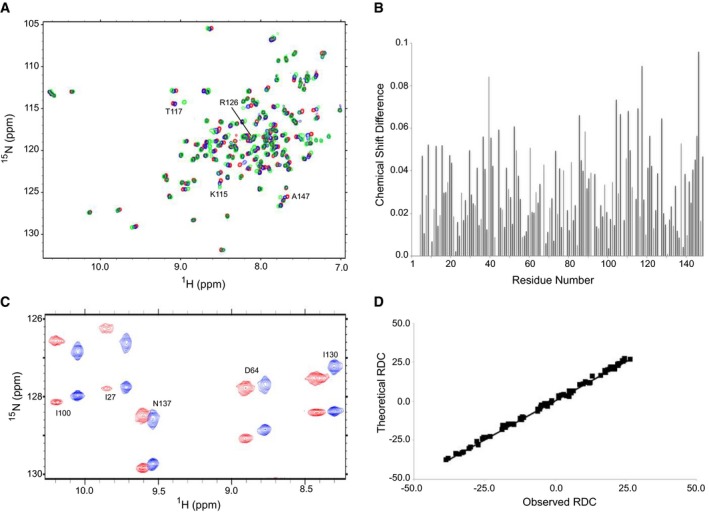
- Overlay of 15N‐1H HSQC spectra of 15N‐labeled Ca2+/CaM by itself (red peaks) and after addition of saturating, unlabeled PSD‐95 (1–21) (blue peaks) or saturating, unlabeled PSD‐95_pT19 (green peaks). All NMR experiments were recorded at 600 MHz 1H frequency.
- Chemical shift perturbation of CaM amide resonances in the absence versus presence of PSD‐95_pT19. Chemical shift difference (CSD) plotted on the vertical axis was defined as CSD = {(HNA – HNB)2 + (15NA – 15NB)2}1/2, where “A” and “B” designate free and bound states of CaM. HN and 15N represent amide 1H and 15N chemical shifts, respectively. Perturbations greater than the average were used as active ambiguous restraints in the Haddock docking calculation (see Materials and Methods).
- Representative data from IPAP [15N‐1H]‐HSQC spectra of 15N‐labeled Ca2+/CaM bound to PSD‐95_pT19 in the absence (blue) and presence of 17 mg/ml filamentous bacteriophage Pf1 (red). Residual dipolar couplings (RDCs) for backbone HN resonances are calculated (in Hertz) as the difference in splitting for the 15N‐{1H} doublet components (red peaks) relative to the isotropic 1 J NH coupling (blue peaks). RDC values are calculated to be +40, +30, +20, +20, and −20 Hz for I100, I27, N137, D64, and I130, respectively.
- Correlation between observed RDCs (panel C) versus RDCs calculated from the final NMR derived structure of Ca2+/CaM bound to PSD‐95_pT19. The correlation coefficient (R) equals 0.99, and Q is 0.11.
The NMR structure of Ca2+/CaM bound to PSD‐95_pT19 is shown in Fig 2 (see Table 2 for structural statistics). The NMR data defined the structure of the entire polypeptide chain of CaM except for the first three residues at the N‐terminus (A1–Q3) and C‐terminal residue (K148). The overall main chain structure of Ca2+/CaM bound to the unphosphorylated PSD‐95 N‐terminal peptide (Zhang et al, 2014; Fig 2A) looks similar to that bound to PSD‐95_pT19 (Fig 2B). The overall root‐mean‐squared deviation between backbone atoms was < 1.4 Å when comparing the two structures. The two lobes of CaM come together to form a hydrophobic cavity that caps the PSD‐95 N‐terminal helix (residues 1–13, colored cyan in Fig 2A and B). The dominant interaction involves PSD‐95 residue Y12, which forms multiple contacts with hydrophobic residues in the CaM C‐lobe as described earlier (Zhang et al, 2014; Fig 2C). PSD‐95 residues L4 and T8 are on the same helical surface as Y12 and make hydrophobic contacts with CaM residues in the N‐lobe (Fig 2C). PSD‐95 residues C3, I6, and K10 are on the helical surface opposite to that of Y12 (Fig 2C). Residue C3 is well sequestered in the hydrophobic core of the CaM N‐lobe (residues L32, I63, and F68), whereas I6 and K10 are more solvent exposed. PSD‐95 residues 14‐19 were previously unstructured in the complex of Ca2+/CaM with the unphosphorylated N‐terminus of PSD‐95 (Zhang et al, 2014). These residues in PSD‐95_pT19 form a hook‐like structure with a β‐turn main chain conformation that makes electrostatic contacts with Ca2+/CaM (colored red in Fig 2B). The most striking intermolecular interactions are (i) salt bridge between pT19 of PSD‐95 and K115 from CaM, (ii) salt bridge between E17 from PSD‐95 and R126 from CaM, and (iii) hydrogen bonding interaction involving the side‐chain amide group of Q15 from PSD‐95 and the main chain carbonyl of A147. Peptide binding studies below demonstrate that each of these intermolecular contacts is important for binding.
Figure 2. Ca2+/CaM makes electrostatic contacts with PSD‐95 phosphorylated at T19.
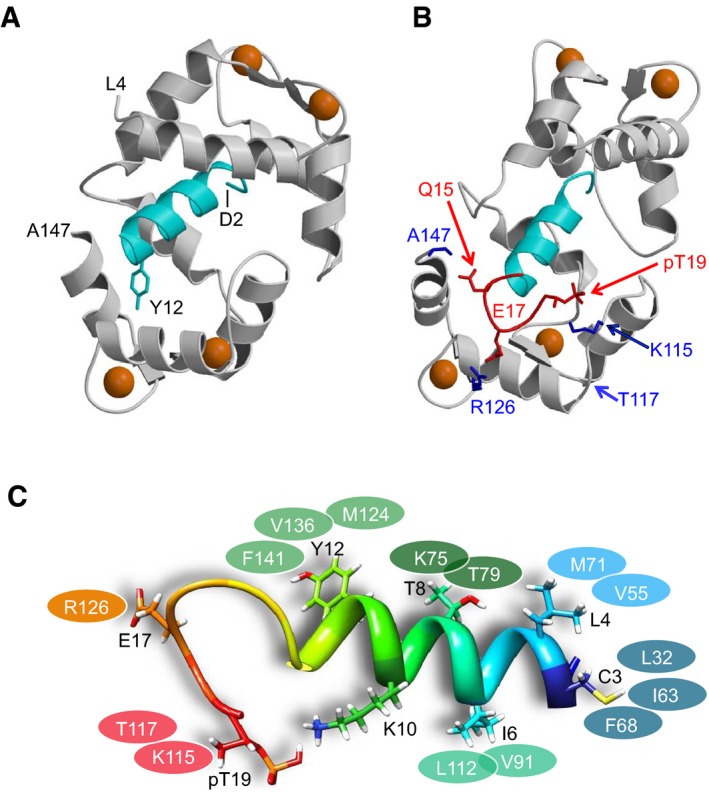
- NMR structure of Ca2+/CaM (gray) bound to unphosphorylated PSD‐95. PSD‐95 residues D2 (depicted as starting point) to R13 are resolved and form an α‐helix (cyan) (Zhang et al, 2014). Residues 14–19 of unphosphorylated PSD‐95 are unstructured and not shown. Ca2+ ions bound to CaM are depicted by orange spheres.
- NMR structure of Ca2+/CaM bound to PSD‐95 phosphorylated at T19 (PDB accession no. 5J7J). Residues 14–19 of phosphorylated PSD‐95 adopt a hook‐like structure (highlighted in red) not seen in unphosphorylated PSD‐95. This hook‐like structure is stabilized by PSD‐95 residues E17 and pT19 forming salt bridges with R126 and K115, respectively. Side‐chain atoms are depicted by a stick representation for PSD‐95 residues Q15, E17, and T19 (red) and CaM residues K115, T117, and R126 (blue).
- Intermolecular contacts observed for residues in the helical segment of PSD‐95_pT19 (side‐chain atoms shown as stick representation) and residues in CaM (represented by the colored ovals).
Table 2.
NMR structural statistics for Ca2+/CaM–PSD‐95_pT19
| NMR distance restraints | |
| Intermolecular | 19 |
| Hydrogen bonds | 10 |
| RDC Q‐factor | 0.037 |
| 1DHNRDC | 74 |
| RDC correlation coefficient (R) | 0.99 |
| Root‐mean‐squared deviation from average structure | |
| CaM backbone atoms | 1.0 Å ± 0.6 for 200 structures |
| CaM backbone atoms (refined) | 0.5 Å ± 0.5 for 50 structures |
| Haddock scoring | |
| Cluster size | 200 |
| van der Waals energy | −57.7 ± 4.8 |
| Electrostatic energy | −439.4 ± 16.4 |
| Restraints violation energy | 791.0 ± 44.32 |
| Ramachandran plot | |
| Most favored regions | 89.7% |
| Allowed regions | 9.3% |
| Unfavored regions | 0.9% |
Validation of the Ca2+/CaM–PSD‐95 NMR structure
Substitutions in both CaM and PSD‐95 peptide were designed to validate the predicted intermolecular contacts between Ca2+/CaM and PSD‐95 (highlighted red in Fig 2B). We titrated synthetic fluorescein‐labeled N‐terminal PSD‐95 peptides (residues 1–21) with Ca2+/CaM and measured FP to determine their Kd values (Fig 3). Each of the single residue alterations Q15A, E17R, and T19K in the PSD‐95 peptide showed a decrease in binding affinity compared to wild type (WT) (Fig 3A and Table 1). CaM with R126, which electrostatically interacts with E17 of the PSD‐95 peptide, mutated to Glu showed no clearly detectable binding to the PSD‐95 WT peptide in our FP assay (Fig 3B). However, titrations of CaMR126E against the charge‐inverted PSD‐95 E17R peptide yielded binding with an affinity that is virtually identical to that of binding of WT CaM to WT PSD‐95 peptide (Fig 3B and Table 1). Accordingly, CaMR126E can fully rescue the decrease in binding caused by the E17R mutation in PSD‐95. Similarly, mutating the CaM residue K115 to E, which electrostatically interacts with phospho‐T19, restored and actually augmented binding affinity to the PSD‐95 T19K peptide to result in an affinity that is stronger than the interaction between WT CaM and WT PSD‐95 peptide (Fig 3C and Table 1). These results confirm two important intermolecular salt‐bridge contacts, PSD‐95E17–CaMR126 and PSD‐95pT19–CaMK115, which were seen in the NMR structure (Fig 2B). On the other hand, the T19E alteration increased binding affinity only moderately presumably because the glutamate side chain is not as bulky and has less negative net charge than a phosphoryl group.
Figure 3. PSD‐95 peptide titration with Ca2+/CaM.
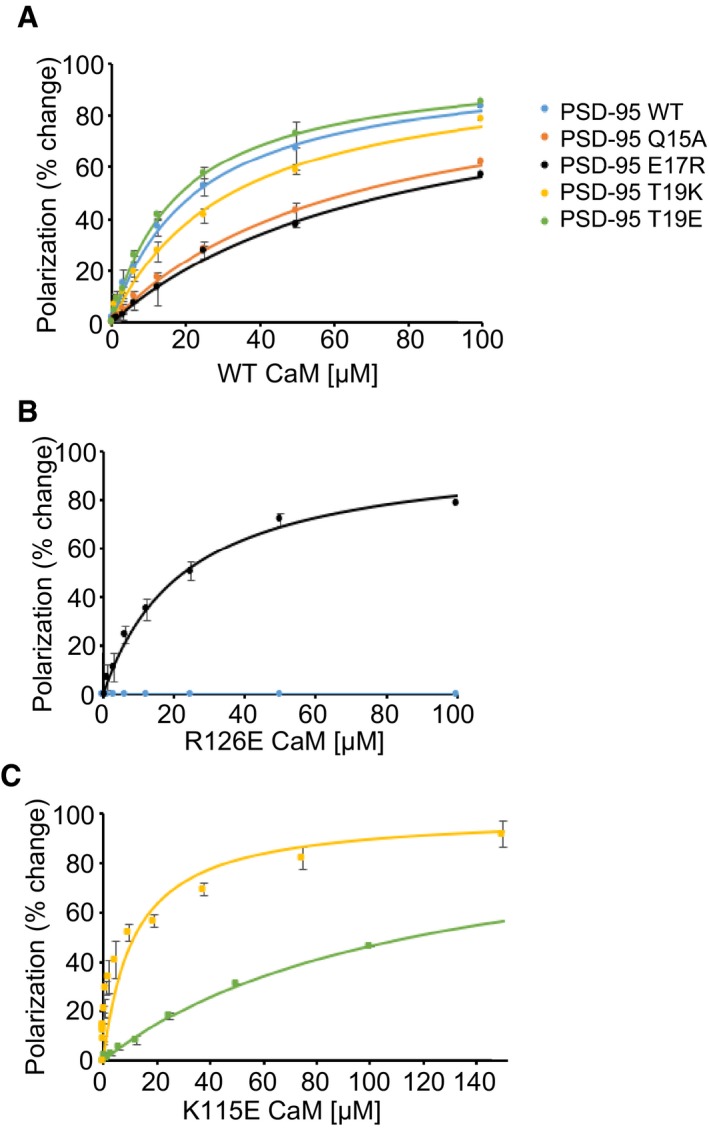
- FP titrations showing the binding of wild‐type (WT) CaM to PSD‐95 (1–21) peptides, either WT (blue), Q15A (salmon), E17R (black), T19E (green), or T19K (yellow). The solid lines represent optimal theoretical curves calculated using a one‐site binding model described in Materials and Methods. The calculated dissociation constants in each case are given in Table 1.
- FP titrations showing the binding of R126E CaM to PSD‐95 peptides, either WT (blue) or E17R (black).
- FP titrations showing the binding of K115E CaM to PSD‐95 peptides T19K (yellow) or T19E (green).
Homeostatic synaptic downscaling is accompanied by a reduction in PSD‐95 palmitoylation
Acute Ca2+ influx through NMDARs triggers loss of a portion of PSD‐95 from spines (Sturgill et al, 2009; Nelson et al, 2013; Zhang et al, 2014). This effect is mediated by Ca2+/CaM binding to the N‐terminus of PSD‐95 (Zhang et al, 2014), which undergoes activity‐dependent changes in its palmitoylation status that influences its synaptic accumulation (El‐Husseini Ael et al, 2002; Noritake et al, 2009). Ca2+/CaM acts by sequestering Cys3 and Cys5 on PSD‐95, thereby preventing their (re)palmitoylation (Zhang et al, 2014). Thus, we analyzed whether homeostatic scaling down is accompanied by a net reduction in PSD‐95 palmitoylation levels (Zhang et al, 2014). Synaptic downscaling was induced in cultured neurons by blocking GABA A receptors with bicuculline (BIC) for 48 h (O'Brien et al, 1998; Turrigiano et al, 1998). BIC treatment resulted in a progressive decrease in PSD‐95 palmitoylation levels reaching ~50% of untreated cultures in 48 h (Fig 4). No change in palmitoylation levels of trimeric G protein subunit Gα‐i3 was observed, showing the specificity of the effect of BIC.
Figure 4. Prolonged BIC treatment results in reduction in PSD‐95 palmitoylation.
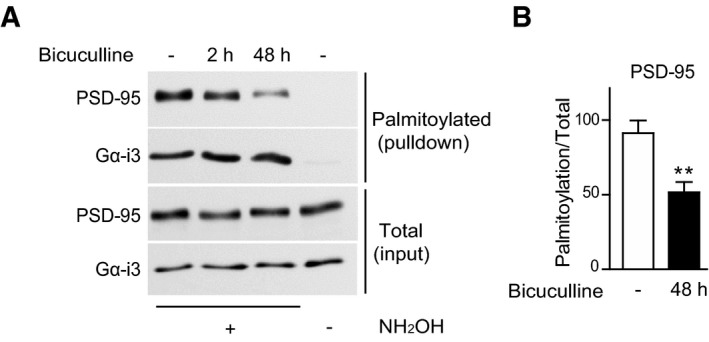
- Representative immunoblots of pull‐down samples (top two panels) and total lysate (bottom two panels) for PSD‐95 and, as control, the trimeric G protein subunit Gα‐i3. Omission of NH2OH before biotinylation resulted in no NeutrAvidin pull down as negative control for non‐specific pull down.
- Quantification of PSD‐95 palmitoylation. Mean ± SEM, seven samples from three independent sets of cultures were analyzed per condition (**P < 0.01; t‐test).
Down‐regulation of AMPARs at the surface requires Ca2+/CaM binding to PSD‐95
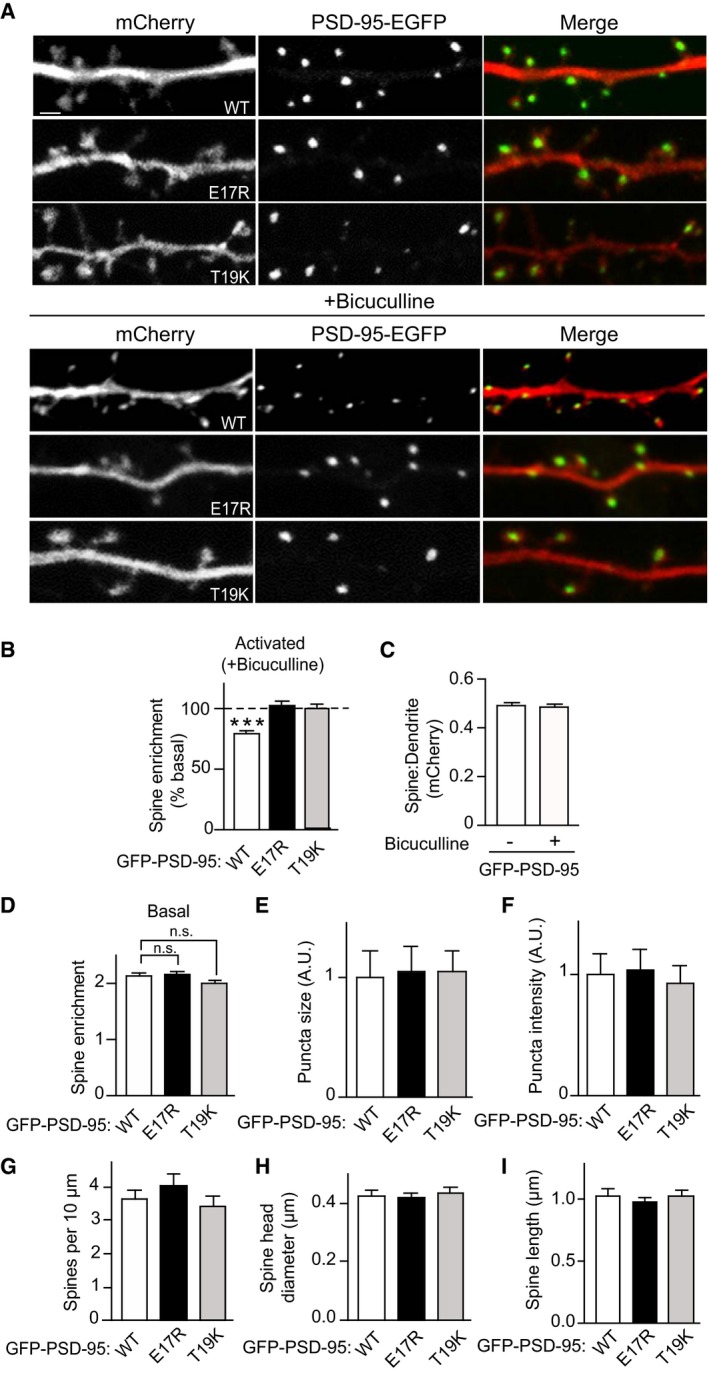
Because PSD‐95 anchors AMPARs at postsynaptic sites, we hypothesized that Ca2+/CaM binding to PSD‐95 is a negative regulator not only of postsynaptic PSD‐95 localization but also AMPARs. To this end, we generated CaM‐binding‐defective mutants (E17R and T19K) of PSD‐95 and tested whether disrupting the CaM–PSD‐95 interaction attenuates AMPAR downscaling following BIC treatment. We used a lentivirus‐mediated molecular replacement strategy for PSD‐95 by simultaneous knockdown of endogenous PSD‐95 with a validated shRNA and ectopic expression of sh‐resistant PSD‐95 (Schluter et al, 2006; Xu et al, 2008). This strategy resulted in our cultures in a nearly complete loss of endogenous PSD‐95 and ectopic expression of GFP‐tagged PSD‐95 at a level comparable to that of endogenous PSD‐95 in uninfected cultures (Fig EV2). As an initial proxy for homeostatic synaptic downscaling, surface levels of endogenous AMPARs were monitored by labeling with an antibody against the extracellular N‐terminus of the GluA1 subunit without permeabilization in primary hippocampal neurons infected with virus carrying either WT or mutant forms of PSD‐95‐EGFP. As expected, BIC treatment for 24–48 h resulted in an ~30% loss of surface GluA1 when endogenous PSD‐95 was replaced with PSD‐95WT (P < 0.01; Fig 5). In contrast, no down‐regulation was observed with either PSD‐95E17R or PSD‐95T19K. In parallel, PSD‐95WT but not PSD‐95E17R or PSD‐95T19K showed a significant reduction in spine enrichment during BIC‐induced downscaling (P < 0.001 relative to basal conditions; Fig 6A and B). This effect was specific as BIC did not affect the subcellular localization of mCherry, which showed no enrichment in spines (Fig 6C). Neither mutation altered synaptic targeting of PSD‐95 as evident from the comparable levels of spine enrichment, puncta size, and puncta intensity of all the GFP‐PSD‐95 variants under basal conditions (Fig 6D–F). The basal spine enrichment of PSD‐95 (~2‐fold; Fig 6D) is similar to previous work (Ehrlich & Malinow, 2004). As palmitoylation is absolutely required for postsynaptic localization of PSD‐95 (El‐Husseini et al, 2000), the finding that neither mutation is affecting postsynaptic targeting of PSD‐95 indicates that neither mutation disturbs palmitoylation in neurons. Furthermore, the mutations did not affect basal palmitoylation of PSD‐95 in HEK293 cells (Fig EV3A), co‐immunoprecipitation of GluN2B and GluA1 with GFP‐PSD‐95 (Fig EV3B), or colocalization of GluA1 with GFP‐PSD‐95 (Fig EV3C). There was also no difference in density, head diameter, and length of spines on neurons expressing PSD‐95 WT versus the two mutations (Fig 6G–I), arguing against structural alterations of spines, which could influence the effect of BIC.
Figure EV2. Molecular replacement of PSD‐95.
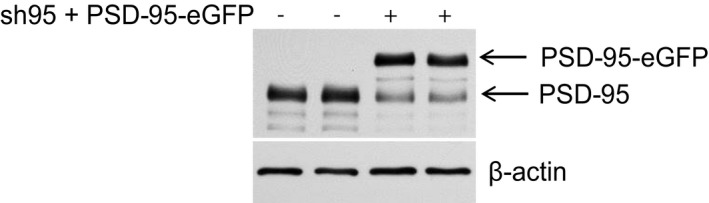
Cultured cortical neurons were infected at 12 DIV with lentivirus for expression of both shRNA against PSD‐95 (sh95) and sh‐resistant PSD‐95‐EGFP. Cultures were extracted at 17 DIV for immunoblotting with an antibody against PSD‐95. Endogenous PSD‐95 was detected at ~90 kDa and ectopically expressed GFP‐tagged PSD‐95 ~130 kDa. Probing for β‐actin at around 43 kDa showed equal loading.
Figure 5. Point mutations of PSD‐95 that disrupt Ca2+/CaM binding prevent BIC‐induced loss of surface AMPARs during scaling down.
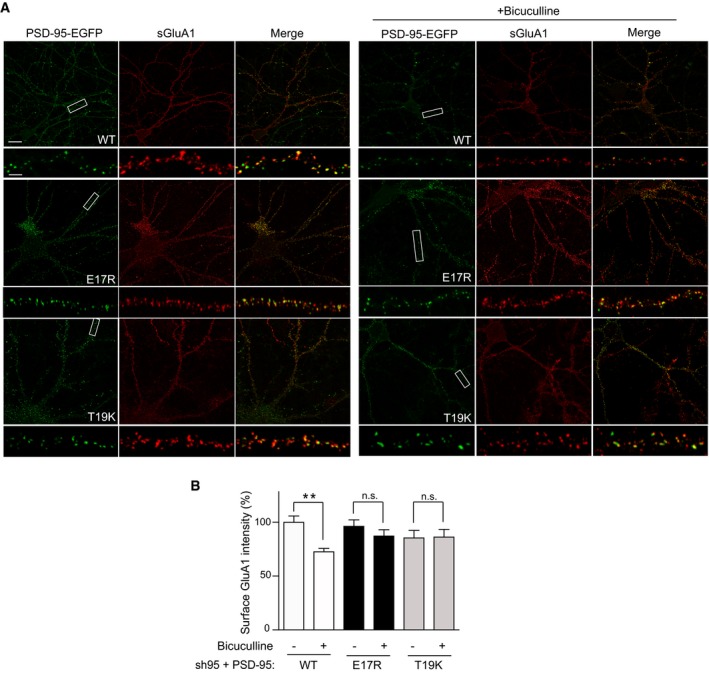
- Representative confocal microscopic images of PSD‐95‐EGFP fluorescence (green) and surface GluA1 immunostaining (red) at low (top panels; scale bar: 20 μm) and high enlargement (bottom panels; scale bar: 5 μm).
- Quantification of surface GluA1 intensity from (A) showed reduction in AMPAR surface levels during scaling down in neurons expressing WT PSD‐95 but not in those expressing either E17R or T19K mutants. Mean ± SEM, three dendritic segments from each of 31–42 neurons from three independent sets of cultures were analyzed per condition (**P < 0.01; n.s., not significant; one‐way ANOVA followed by Bonferroni's post hoc test).
Figure 6. Point mutations of PSD‐95 that disrupt calmodulin binding prevent BIC‐induced loss of PSD‐95 from spines.
-
ARepresentative confocal microscopic images of PSD‐95‐EGFP (green) and mCherry (red) used as “fill” to visualize the dendrite with spine heads (scale bar: 2 μm) after control (top) and BIC treatment (bottom). Individual channels are shown in grayscale.
-
BBIC treatment reduced spine enrichment of WT but not E17R or T19K PSD‐95 as quantified as the ratio of EGFP intensity in spine heads relative to that in the adjacent dendritic shaft. Values were normalized to control treatments, which were set to equal 100% for each PSD‐95 construct.
-
CmCherry showed no enrichment in spines and BIC had no effect on its localization.
-
D–FSpine enrichment and puncta size and intensity of PSD‐95 were comparable under basal conditions for WT, E17R, and T19K PSD‐95 (A.U., arbitrary unit).
-
G–ISpine density, head diameter, and length were comparable under basal conditions for neurons expressing WT, E17R, and T19K PSD‐95.
Figure EV3. Palmitoylation and association of PSD‐95 with AMPARs and NMDARs are not affected by the E17R and T19K mutations.
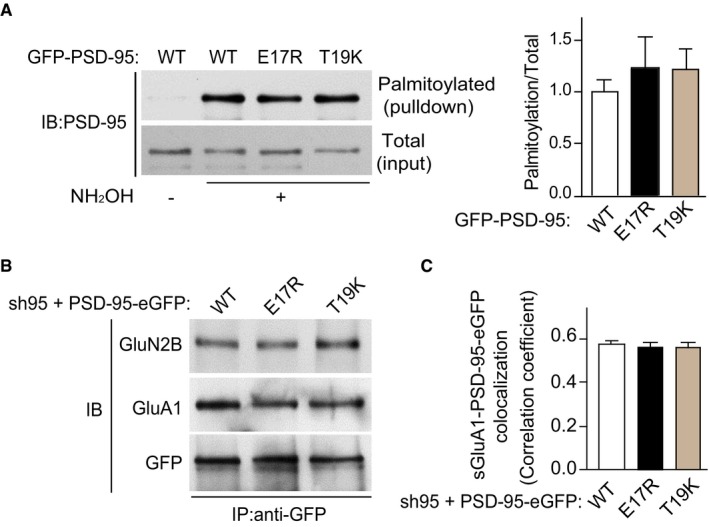
- HEK293 cells were transfected with PSD‐95‐EGFP cDNA plasmids. Cultures were extracted after 24 h for analysis of palmitoylation by the biotin switch method and pull down with NeutrAvidin‐agarose beads. Left panels show representative immunoblots (IB) of pull‐down samples (top panel) and total lysate (bottom panel) for PSD‐95. Omission of NH2OH before biotinylation resulted in minimal NeutrAvidin pull down as negative control for non‐specific pull down. Right panel shows quantification of PSD‐95 palmitoylation (mean ± SEM, n = 3–4 per condition from three independent experiments).
- Cultured cortical neurons were infected at 12 DIV with lentivirus for expression of both shRNA against PSD‐95 (sh95) and sh‐resistant PSD‐95‐EGFP WT, E17R, or T19K. Cultures were extracted at 17 DIV for immunoprecipitation (IP) and subsequent immunoblotting (IB) with antibodies against GluA1 (˜100 kDa) and GluN2B (˜180 kDa), showing comparable co‐immunoprecipitations of GluA1 and GluN2B. Probing for GFP showed comparable loading for PSD‐95‐EGFP WT, E17R, and T19K. Shown are representative IBs. Similar results were obtained in three other cultures.
- Quantification of colocalization of endogenous surface GluA1 and the indicated PSD‐95‐EGFP variant in hippocampal neurons. Bar graph shows correlation coefficients for the colocalization indicating comparable colocalization of GluA1 with each of the PSD‐95‐EGFP variants. Mean ± SEM, three dendritic segments from each of 32–34 neurons from three independent cultures were analyzed per condition.
E17 in the N‐terminus of PSD‐95 had been implicated earlier in LTD (Xu et al, 2008). In fact, mutating E17 identified here as critical for Ca2+/CaM binding, to Arg impaired LTD in the earlier work (Xu et al, 2008). To fully disambiguate the role of Ca2+/CaM binding in down‐regulation of surface AMPARs as suggested in the above experiments, we applied a charge inversion strategy. As before, we replaced endogenous PSD‐95 with shRNA‐resistant PSD‐95WT or PSD‐95E17R and tested whether ectopic expression of charge‐inverted CaMR126E could rescue the impairment in down‐regulation of surface AMPARs seen with PSD‐95E17R. Similar to the above experiment, neurons that expressed PSD‐95E17R paired with CaMWT did not show down‐regulation when PSD‐95WT‐expressing neurons did (P < 0.01 relative to basal levels; Fig 7). Critically, CaMR126E rescued the loss of down‐regulation seen with PSD‐95E17R (P < 0.05 relative to basal levels; Fig 7). Taken together, these results demonstrate that interaction of PSD‐95 with CaM following chronic elevation of synaptic activity underlies removal of AMPARs from the neuronal surface and of PSD‐95 from synapses.
Figure 7. R126E mutation on CaM restores the BIC‐induced decrease in surface GluA1 that is impaired by PSD‐95 E17R mutation.
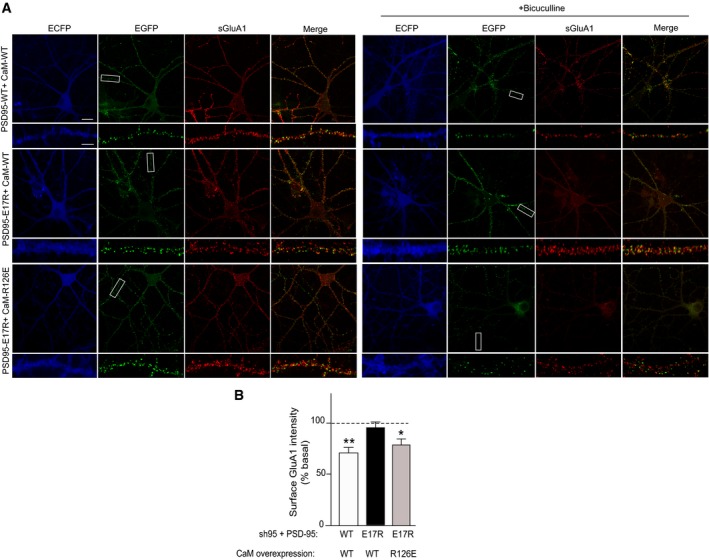
- Representative confocal microscopic images of intrinsic ECFP and EGFP fluorescence, and surface GluA1 immunostaining at low (top panels; scale bar: 20 μm) and high enlargement (bottom panels; scale bar: 5 μm).
- Quantification of surface GluA1 intensity from (A) showed impaired AMPAR downscaling in neurons expressing PSD‐95‐E17R in the presence of wild‐type CaM (CaM‐WT) that was rescued by co‐expression of CaM‐R126E. Mean ± SEM, three dendritic segments from each of 18–26 neurons from three independent sets of cultures were analyzed per condition (**P < 0.01, *P < 0.05 versus untreated basal levels; one‐way ANOVA followed by Bonferroni's post hoc test).
Homeostatic synaptic downscaling requires Ca2+/CaM binding to PSD‐95
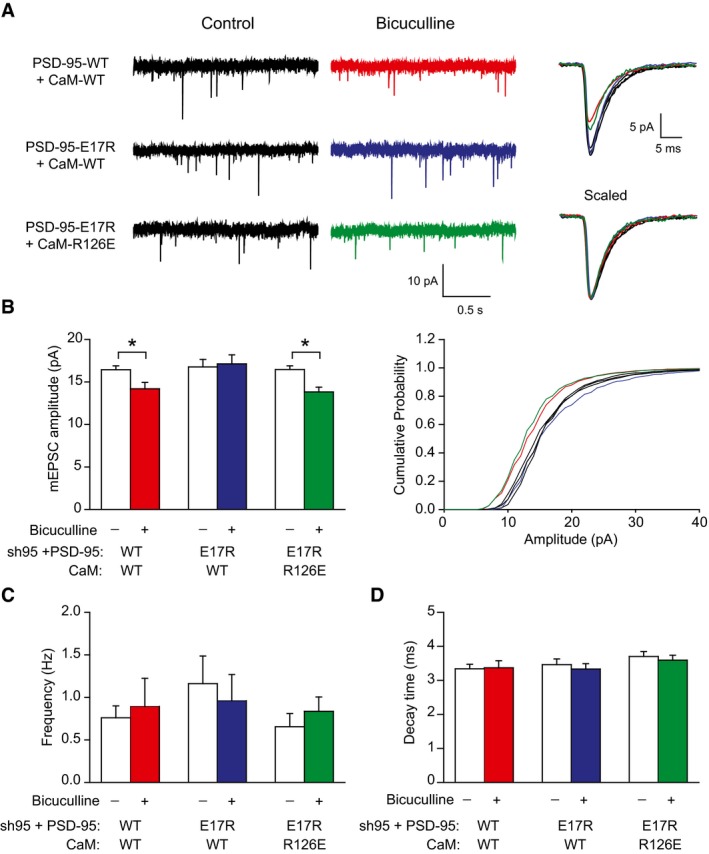
Synaptic downscaling is defined as a decrease in synaptic strength that affects all synapses to a comparable degree. Analysis of AMPARs surface expression by immunostaining does not strictly represent such downscaling, whether applied to the whole dendritic surface as in Fig 7 or restricted to synaptic AMPARs, not all of which are activated during spontaneous events such as mEPSCs (Sinnen et al, 2017). Thus, we performed mEPSC analysis from neurons in which endogenous PSD‐95 had been replaced as above with either PSD‐95WT or PSD‐95E17R and either CaMWT or CaMR126E had been co‐expressed. BIC treatment decreased mEPSC amplitude by about 15% when CaMWT was co‐expressed with PSD‐95WT but not with PSD‐95E17R (Fig 8A and B) Importantly, co‐expression of CaMR126E with PSD‐95E17R restored the decrease in mEPSC amplitude. At the same time, neither mEPSC frequency nor decay time was affected (Fig 8C and D). The BIC‐induced decrease in mEPSC amplitude was obvious over the whole range of synaptic strengths indicating that this decrease reflected true cell‐wide homeostatic downscaling (Fig 8B, right). Accordingly, binding of Ca2+/CaM to the N‐terminus of PSD‐95 is required for scaling down synaptic strength during chronically elevated activity.
Figure 8. R126E mutation on CaM restores scaling down of AMPAR mEPSC amplitude that is impaired by PSD‐95 E17R mutation.
-
ARepresentative traces of AMPAR mEPSC recordings (left) and averages of all mEPSC events from single representative neurons (right) drawn to scale (top) and normalized to peak (bottom).
-
BQuantification of mEPSC amplitude revealed downscaling by BIC in neurons expressing PSD‐95WT/CaMWT or PSD‐95E17R/CaMR126E but not PSD‐95E17R/CaMWT (left) over the full range of amplitude distributions (right).
-
C, DMini‐EPSC frequency (C) and decay time (D) were comparable among all conditions.
Homeostatic synaptic downscaling is accompanied by an increase in spine neck length
Although earlier work did not provide evidence for a change in spine size during scaling up (Soares et al, 2013), a recent publication reported that 48 h BIC treatment led to a 15–20% reduction in the average spine size (Rajman et al, 2017). We compared spine dimensions under control conditions (as given in Fig 6H and I) with those following BIC treatment. We observed in neurons ectopically expressing WT PSD‐95‐EGFP a decrease of ~5% upon bicuculline treatment as compared to control treatment, which did not reach statistical significance (Fig EV4A). Notably, BIC increased spine head diameter in neurons expressing the E17R and T19K mutants by ~9% and ~3%, respectively, augmenting the actual difference in spine size changes between WT and mutants although none of these effects reached statistical significance. This observation is analogous to findings by Rajman et al (2017), that is, treatments that prevented down scaling BIC increased rather than decreased spine size (see Discussion). Remarkably, we found that BIC robustly increased spine length by 20–30% for WT as well as the PSD‐95 mutants. Given that spine head diameter did not change this increase reflects a lengthening of the spine neck. This spine neck lengthening during homeostatic synaptic down scaling is to our knowledge a novel finding. It can be expected to decrease the conduction of electric signals from spine to shaft and thereby decrease the overall excitation of the receiving neuron (Araya et al, 2006, 2014).
Figure EV4. Chronic bicuculline treatment increases length of dendritic spines.
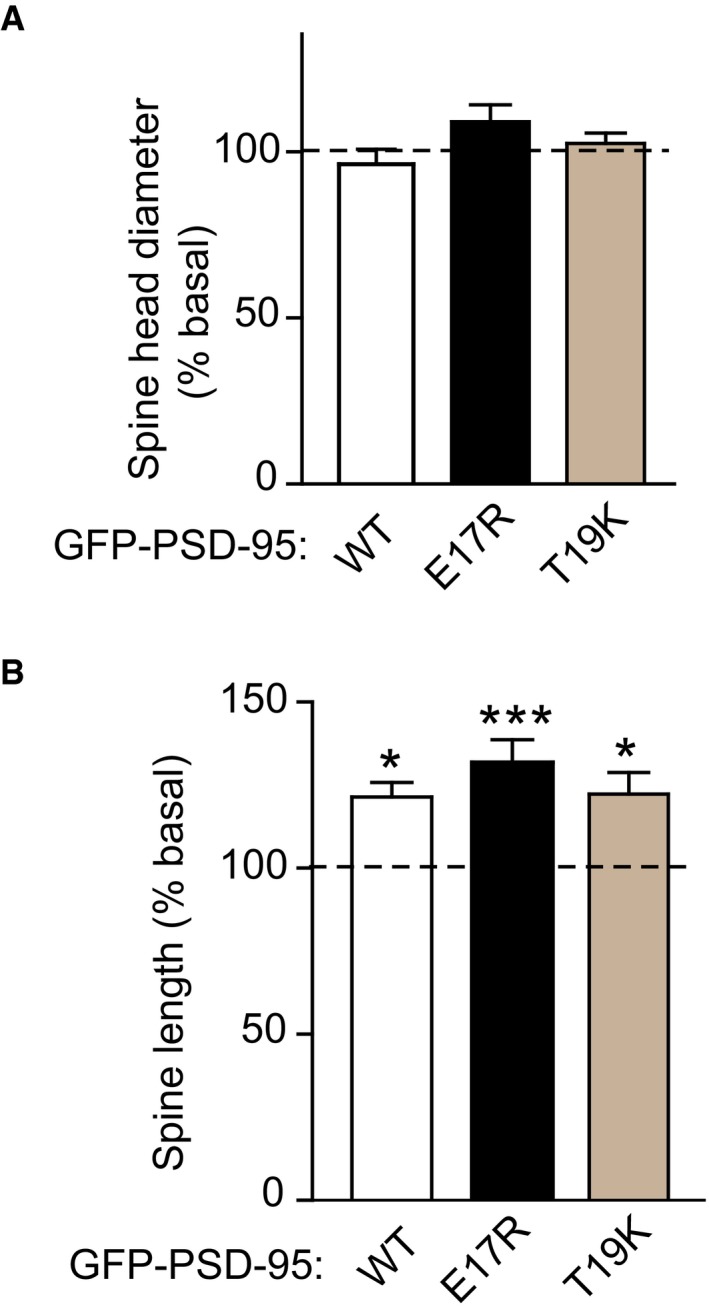
-
A, BCultured hippocampal neurons were co‐transfected with mCherry and EGFP‐tagged PSD‐95 wild type (WT), E17R, or T19K at 10‐11 DIV and treated with BIC (50 μM) or left untreated at 17 DIV for 24–48 h before fixation. Spine head diameter (A) and length (B) were comparable for neurons expressing WT, E17R, or T19K PSD‐95 under basal conditions (see Fig 6H and I). BIC treatment did not affect spine head diameter but increased spine length for all PSD‐95‐EGFP variants. Mean ± SEM are shown. Statistical analysis was performed on n = 166–202 spines from 10 to 16 neurons per condition from three independent sets of cultures (*P < 0.05, ***P < 0.001; one‐way ANOVA followed by Bonferroni's post hoc test; values for spine head diameter and length for basal conditions were those graphed in Fig 6H and I, respectively).
Discussion
The PSD‐95 N‐terminus as a CaM‐binding site
The N‐terminus of PSD‐95 diverges from other CaM target sites (Hoeflich & Ikura, 2002). It does not conform to the typical consensus sequence of most other CaM‐binding motifs (IQ, 1–10, 1–14 and 1–16) (Rhoads & Friedberg, 1997). However, PSD‐95 residues 2–19 have some similarity with the CaM‐binding site of the Ca2+/CaM‐dependent protein kinase kinase, CaMKK (50% homology and 25% identical to CaMKK residues 338–354 (Kurokawa et al, 2001). Conserved hydrophobic residues (residues 4–7 in PSD‐95 and residues 342–345 in CaMKK) make critical contacts with the N‐lobe in CaM. In addition, a conserved basic residue (R351 in CaMKK, R13 in PSD‐95) preceding an aromatic one (F352 in CaMKK, Y14 in PSD‐95) forms contacts with residues in the C‐lobe of CaM, as detailed earlier (Zhang et al, 2014). The PSD‐95 N‐terminus forms an α‐helix (residues 1–13) that resembles the α‐helix formed by CaMKK (residues 338–349). However, the unphosphorylated PSD‐95 N‐terminus appears unstructured after residue 13 (residues 14–71) in contrast to a stable hairpin‐loop structure (residues 352–357) formed immediately adjacent to the α‐helix in CaMKK (residues 338–349). This additional hairpin‐loop structure in CaMKK may explain why CaM binds to CaMKK with ~10‐fold higher affinity compared to PSD‐95. In our current structure of Ca2+/CaM bound to PSD‐95_pT19, a hairpin loop is now seen in phosphorylated PSD‐95 (residues 14–19, highlighted red in Fig 2B), which is similar to the hairpin‐loop structure of CaMKK. The phosphorylation at T19 stabilizes the hairpin loop in PSD‐95 due to its electrostatic contacts with Ca2+/CaM. The phosphoryl group attached at T19 in PSD‐95 interacts with K115 in CaM, and PSD‐95 residue E17 interacts with R126 in CaM (Fig 3B). The hairpin loop in CaMKK makes a somewhat similar electrostatic interaction involving R351 in CaMKK and E123 in CaM. The hairpin loop in phosphorylated PSD‐95 enhances its binding affinity for Ca2+/CaM, which is consistent with the higher affinity CaM binding observed for CaMKK (Tokumitsu et al, 1997).
The finding that phosphorylation of a CaM target binding site strengthens its binding to Ca2+/CaM via a direct contact between the phosphoryl‐moiety and CaM is to our knowledge a new mechanism of positive regulation of Ca2+/CaM binding. There are other examples where phosphorylation of a target protein promotes its binding to Ca2+/CaM. For instance, phosphorylation of the Ca2+‐ and CaM‐dependent protein kinase CaMKII on T286 strongly enhances Ca2+/CaM binding to a site located ~10–20 residues upstream of the phosphorylation site (Meyer et al, 1992; Singla et al, 2001; Hell, 2014). However, this increase in Ca2+/CaM‐binding affinity is not due to a direct interaction between phospho‐T286 and CaM. Instead, phosphorylation at T286 causes increased exposure of the actual Ca2+/CaM‐binding site as this site is displaced by T286 phosphorylation from the binding pocket at the kinase domain of CaMKII (Meyer et al, 1992; Singla et al, 2001; Hell, 2014). The direct salt‐bridge interaction between phospho‐T19 (PSD‐95) and K115 in CaM exemplifies a new paradigm for regulation of Ca2+/CaM target binding. This electrostatic interaction is further enhanced by E17 in PSD‐95 interacting with R126 in CaM. Identification of the latter interaction created the opportunity for a charge inversion experiment in neurons to indisputably establish that Ca2+/CaM binding to the N‐terminus of PSD‐95 is critical for homeostatic synaptic downscaling.
Phosphorylation of PSD‐95 on T19 by glycogen synthase kinase‐3β (GSK3β) is important for PSD‐95 dispersal from spines during LTD (Peineau et al, 2007; Nelson et al, 2013). We monitored T19 phosphorylation over the course of BIC treatment but could not detect the increase we expected based on that earlier work on LTD (Fig EV5). This result opens up the possibility that LTD and homeostatic synaptic down scaling differentially depend on T19 phosphorylation. However, we do not want to draw firm conclusions from this negative result as we cannot rule out an increase in T19 phosphorylation that is too small for detection but “chronic” (i.e., it is occurring over an expanded period during bicuculline treatment). Such a lingering latent increase could modestly yet chronically augment Ca2+/CaM binding to the N‐terminus of PSD‐95 and thereby synaptic down scaling. We also cannot rule out loss of phospho‐T19 during sample preparation despite the use of potent phosphatase inhibitors, which could result in equalization of phospho‐T19 levels. Pharmacological inhibition as well as knock down of GSK3β has negative effects on synaptic strength (Wei et al, 2010). Accordingly, GSK3β activity is required under basal conditions for maintenance of normal postsynaptic AMPAR activity presumably by acting via mechanisms that differ from those responsible for LTD as reported by Nelson et al (2013). This requirement of intact GSK3β signaling for preservation of synaptic transmission currently prevents further exploration of a potential role of GSK3β in homeostatic synaptic downscaling.
Figure EV5. Bicuculline treatment does not alter PSD‐95 phosphorylation at T19.
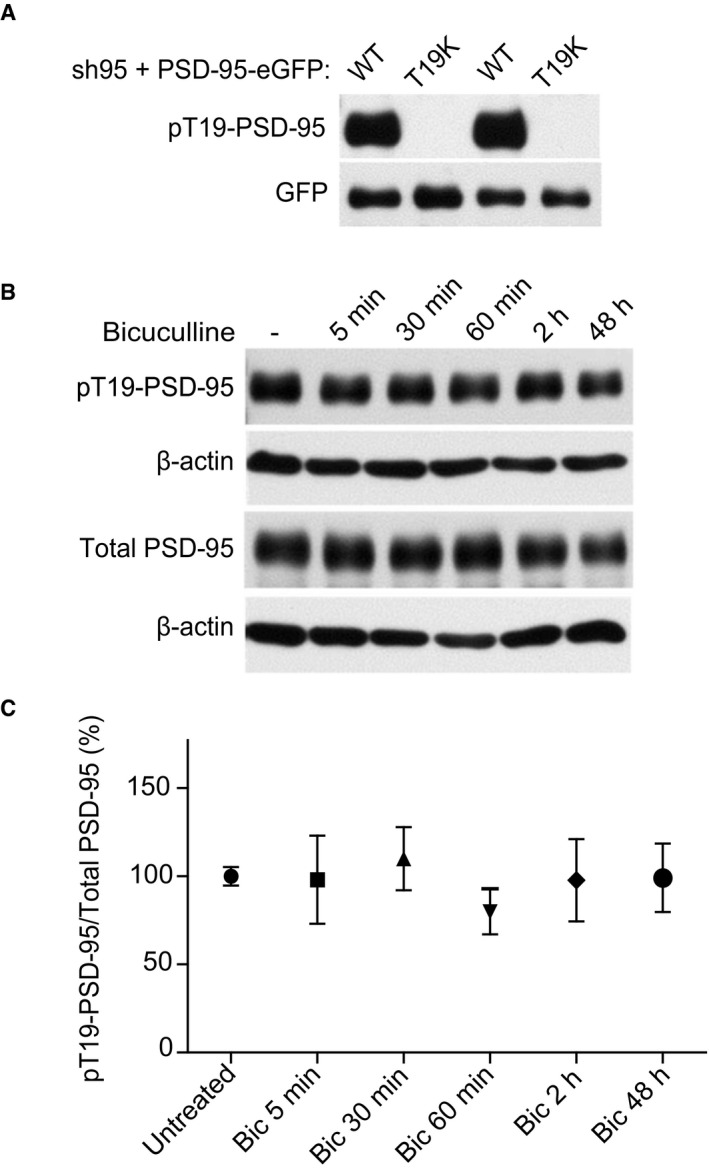
- Cultured cortical neurons were infected at 12 DIV with lentivirus for expression of both shRNA against PSD‐95 (sh95) and sh‐resistant PSD‐95‐EGFP WT or T19K. Whole‐cell lysates were prepared at 17 DIV and analyzed for pT19‐PSD‐95 levels by immunoblotting. Probing for GFP showed comparable loading for PSD‐95‐EGFP WT and T19K. No detection of pT19‐PSD‐95 signal corresponding to PSD‐95‐EGFP in T19K samples showed specificity of the antibody.
- Cultured cortical neurons (17 DIV) were either untreated or treated with BIC for the indicated time periods, and whole‐cell lysates were analyzed for endogenous pT19‐PSD95 and total PSD‐95 levels by immunoblotting. Probing for β‐actin showed comparable loading. Representative immunoblots are shown.
- Quantification of relative pT19‐PSD‐95 levels normalized to total PSD‐95 (mean ± SEM, n = 4–5 per condition from three independent sets of cultures).
Ca2+/CaM binding to PSD‐95 is important for homeostatic synaptic downscaling
Postsynaptic Ca2+ influx increases diffusion of PSD‐95 out of spines from ~15% to ~40% over a 30 min time period (Steiner et al, 2008; Nelson et al, 2013; Zhang et al, 2014). We showed previously that this effect is mediated by Ca2+/CaM binding to the very N‐terminus of PSD‐95. We now demonstrate via charge inversion experiments that this very interaction plays an important role in homeostatic synaptic scaling down.
Synaptic PSD‐95 is dynamically palmitoylated and depalmitoylated (El‐Husseini Ael et al, 2002; Fukata et al, 2004, 2013; Zhang et al, 2014; Yokoi et al, 2016), which enhances and reduces its synaptic accumulation, respectively. In fact, PSD‐95 undergoes depalmitoylation/repalmitoylation cycles with a half‐life of ~2.4 h under basal conditions, which is much faster than palmitoylation turnover of several other postsynaptic proteins including AMPARs and NMDARs (Yokoi et al, 2016). Ca2+ influx via NMDARs further reduces palmitoylation levels of PSD‐95 (El‐Husseini Ael et al, 2002; Zhang et al, 2014). Acute Ca2+ influx and the ensuing Ca2+/CaM binding to the N‐terminus of PSD‐95 prevent repalmitoylation of PSD‐95 at its palmitoylation sites Cys3 and Cys5, thereby destabilizing PSD‐95 in spines (Zhang et al, 2014). Therefore, we hypothesized that this mechanism could be important for homeostatic synaptic downscaling when synaptic activity and thereby Ca2+ influx via NMDARs and Ca2+ channels is chronically increased. Prolonged (48 h) treatment with BIC results in an about 50% reduction in PSD‐95 palmitoylation (Fig 4), consistent with our model that Ca2+/CaM binding to the N‐terminus of PSD‐95 shifts PSD‐95 toward depalmitoylation. Moreover, our charge inversion experiments with PSD‐95E17R and CaMR126E unequivocally demonstrate that homeostatic downscaling depends on Ca2+/CaM binding to PSD‐95. It would be difficult to explain in any other way how CaMR126E but not CaMWT could rescue the loss of homeostatic downscaling seen upon molecular replacement of endogenous PSD‐95 with CaM‐binding‐defective PSD‐95E17R.
Changes in spine geometry upon synaptic downscaling
Recent work showed that BIC treatment results in a 15–20% decrease in spine size (Rajman et al, 2017). In our cultures, the BIC‐induced decrease in spine size was minimal in neurons expressing WT PSD‐95 (~5%) and did not reach statistical significance. We do not know the reason for this difference. One possibility is that differences in the culturing conditions are responsible for this difference. However, similar to the increase in spine size we observed in neurons expressing the Ca2+/CaM‐binding‐deficient PSD‐95 mutants (Fig EV4A), the work by Rajman et al (2017) also found such an increase when blocking scaling down. In detail, chronic picrotoxin treatment, which, like BIC, increases network activity by inhibiting GABA A receptors, resulted in a modest spine enlargement when miR129, which is required for down scaling, was down regulated with anti‐miR129 plasmid. The same was true when the miR129 targets Atp2b4 and doublecortin (DCX) were ectopically expressed to prevent their down‐regulation by miR129 during homeostatic synaptic down scaling, which required the down‐regulation of Atp2b4 and DCX by miR129 (Rajman et al, 2017). Collectively, these results suggest that when mechanisms of down scaling are blocked, the increase in network activity can actually drive a modest increase in spine size. These observations are also consistent with our original finding that preventing Ca2+/CaM from binding to the N‐terminus of PSD‐95 not only impaired the diffusion of PSD‐95 out of spines during short periods of strong Ca2+ influx but actually allowed an increase in spine content of PSD‐95 (Zhang et al, 2014). Notably, the modest increase in spine size induced by the BIC treatment does not seem to be translating into an increase in mEPSC amplitude as observed by Rajman et al (2017) and by us (Fig 8). Such dissociation between spine head size and AMPAR content has been previously reported for LTD and homeostatic scaling (Sdrulla & Linden, 2007; Wang et al, 2007; Beique et al, 2011; Soares et al, 2013). Of note, our work is completely consistent with that by Rajman et al (2017) reporting that down‐regulation of the plasma membrane Ca2+‐ATPase Atp2b4 is important for down scaling. Because these Ca2+‐ATPase and related Ca2+‐ATPases are stimulated by Ca2+/CaM and extrude Ca2+ from cells, their reduction would lead to increased Ca2+ accumulation and thereby increased Ca2+/CaM binding to PSD‐95 and its displacement from postsynaptic sites.
Finally, we find a clear, strong increase in spine neck length of 20–30% for WT and the two PSD‐95 mutants. Spine neck lengthening decreases conduction of electric signals from spine to shaft and thereby to the soma of the postsynaptic neuron (Araya et al, 2006, 2014). Given that bicuculline‐induced spine neck elongation is seen upon transfection with WT as well as both PSD‐95 mutants, it is obviously independent of binding of Ca2+/CaM to the N‐terminus of PSD‐95 and its displacement and thus might constitute a parallel mechanism for homeostatic down scaling of postsynaptic signals reaching the soma. In fact, spine neck formation requires βIII spectrin, which is present in the spine neck but largely absent in the head (Efimova et al, 2017) when the opposite is the case for PSD‐95 (Fukata et al, 2013; Nair et al, 2013). Accordingly, the cytoskeleton in the neck differs from that in the head, which might be governed independent of PSD‐95.
We conclude that downscaling during a chronic elevation in neuronal activity is at least to a substantial degree mediated by Ca2+/CaM binding to the N‐terminus of PSD‐95. This finding precisely defines a specific molecular step in homeostatic synaptic scaling down that connects the increase in Ca2+ influx that results from heightened neuronal activity to the reduction in postsynaptic strength. These results also identify a functional role for the dynamic regulation of postsynaptic PSD‐95 content by Ca2+ influx and CaM.
Materials and Methods
Ethical approval
All animal procedures had been approved by the University of California at Davis and followed NIH guidelines.
Fluorescence polarization (FP) assays
Fluorescein‐labeled peptides (100 nM; ChinaPeptides, Shanghai, China) were titrated with increasing concentrations of purified CaM in FP buffer (50 mM HEPES, pH 7.4, 100 mM KCl, 1 mM MgCl2, 10 mM CaCl2, 0.05 mM EGTA, 5 mM nitrilotriacetic acid) and FP determined with a Synergy 2 plate reader (BioTek, Winooski, VT) as described (Lim et al, 2002).
The dissociation constant (K D) for each titration was calculated according to a one‐site binding model: where B max is a normalization scaling factor (normalized for the polarization change at saturation).
NMR spectroscopy
Xenopus calmodulin was expressed in E. coli strain BL21(DE3) grown in LB medium (unlabeled proteins) or in M9 medium supplemented with 15NH4Cl. 15N‐labeled CaM used in NMR experiments was prepared as described previously (Zhang et al, 2012).
All NMR experiments were performed on samples containing 15N‐labeled Ca2+/CaM bound to a saturating amount of unlabeled N‐terminal PSD‐95 peptide (residues 1–21), which was phosphorylated at residue T19 (called PSD‐95_pT19; ChinaPeptides, Shanghai, China). The peptide was dissolved in d6‐DMSO to give a peptide concentration of 7.8 mM. An aliquot of peptide (1.5 equivalents) was added to a dilute solution of 15N‐labeled Ca2+/CaM (50 μM protein dissolved in 20 mM 2‐amino‐2‐hydroxymethyl‐propane‐1,3‐diol‐d11 (Tris‐d 11) with 5 mM CaCl2, 50 mM NaCl, 5 mM dithiothreitol‐d10 (DTT‐d 10) and 95% H2O/5% D2O) and incubated at 15°C for 1 h to ensure complete binding of the peptide. The complex (called CaM/PSD‐95_pT19) was then concentrated to a final concentration of 500 μM in a final volume of 500 μl for NMR experiments.
All NMR measurements were carried out at 298 K with a Bruker Avance III 600 MHz spectrometer equipped with a four‐channel interface and triple‐resonance cryoprobe (TCI). Two‐dimensional NMR experiments (HSQC and HSQC‐IPAP) were recorded on a sample of 15N‐labeled Ca2+/CaM bound to unlabeled PSD‐95_pT19. Three‐dimensional NMR experiments for assigning backbone and side‐chain resonances were recorded on a double labeled sample (15N, 13C‐labeled Ca2+/CaM bound to unlabeled PSD‐95_pT19) as described previously (Zhang et al, 2014). NMR data were processed using NMRPipe (Delaglio et al, 1995) and analyzed with SPARKY (Goddard T.D. and Kneller D.G., University of California at San Francisco).
To measure residual dipolar couplings (RDCs) of CaM bound to PSD‐95_pT19, the filamentous bacteriophage Pf1 (Asla Biotech Ltd., Latvia) was used as an orienting medium. Pf1 (17 mg/ml) was added to 15N‐labeled CaM bound to unlabeled PSD‐95_pT19 at pH 7.0, to produce weak alignment of the complex. 1H‐15N residual dipolar coupling constants (DNH) were measured using a 2D IPAP (inphase/antiphase) 1H‐15N HSQC experiment (Ottinger et al, 1998).
Haddock structure determination of CaM/pT19 PSD‐95 (1–21)
The molecular docking of Ca2+/CaM and pT19 PSD‐95 (1–21) was performed using the Haddock d‐level 2.2 web server as described (van Zundert & Bonvin, 2014). Residual dipolar couplings, chemical shift perturbation, and mutagenesis data were used as structural restraints. For active restraints or ambiguous interaction restraints (AIR), chemical shift perturbation was used, selecting residues whose chemical shift perturbation falls above the average perturbation. Charge reversal mutagenesis data (Table 1) that defined the intermolecular salt bridge between E17(PSD‐95)/R126 (CaM) and pT19(PSD‐95)/K115 (CaM) were used as unambiguous restraints.
The initial docking calculation used the structure of CaM (2MES) and helical structure of PSD‐95 N‐terminal peptide (residues 1–14; Zhang et al, 2014) as input structures for Haddock. PSD‐95 residues 14–21 were defined to be fully flexible for docking. UCSF Chimera (Pettersen et al, 2004) was used to introduce a phosphate group at the T19 position. Fifty‐nine AIR restraints were used for CaM based on chemical shift perturbation data and 14 active restraints were used for PSD‐95 from chemical shift perturbation of PSD‐95 previously defined by (Zhang et al, 2014). Unambiguous restraints were introduced to define key intermolecular interactions (Q15 (PSD‐95)/A147 (CaM); E17 (PSD‐95)/R126 (CaM); and pT19 (PSD‐95)/K115 (CaM)); the E17 (PSD‐95)/R126 (CaM) interaction was verified by mutagenesis (Table 1). In addition, an unambiguous restraint between C3 (PSD‐95) and I63 (CaM) was added based on visual inspection of the structure refined by RDC restraints. This interaction is supported by earlier data indicating that C3E substitution in the N‐terminal PSD‐95 peptide 1–13 decreased binding to Ca2+/CaM (Zhang et al, 2014).
Initial docking calculations used AIRs based on chemical shift perturbation, grouping the top 200 structures for simulated annealing and water refinement. The lowest energy structures were then run again, adding unambiguous restraints based on mutagenesis data. Rigid‐body docking, simulated annealing, and water refinement were run using the top 200 structures. RDC restraints assigned to CaM were then added using the Sani statement, with tensor values Dr and Da calculated using the program PALES (Zweckstetter, 2008). A total of 74 RDC values were used from residues found in regions of regular secondary structure and as deemed reliable by the PALES calculation.
cDNA constructs
Molecular replacement construct for PSD‐95 in lentiviral vector (Schluter et al, 2006) was kindly provided by Dr. Robert C. Malenka (Stanford University, CA) and CaM‐IRES‐EGFP in L309 (Pang et al, 2010) by Dr. Zhiping P. Pang (Rutgers, NJ). The EGFP tag in CaM‐IRES‐EGFP was replaced by ECFP by subcloning into pECFP‐N1, provided by Dr. Kevin Xiang (UC Davis). Point mutations in PSD‐95 and CaM were introduced by PCR mutagenesis. Accuracy of the various constructs was analyzed by automated DNA sequencing. mCherry plasmid was kindly provided by Dr. Nikolai Otmakhov (Brandeis University, MA).
Neuronal culture
Primary hippocampal and cortical neurons were cultured from E18 rat pups as described previously (Perez‐Otano et al, 2006). For immunofluorescence and electrophysiology, hippocampal neurons were plated at a density of 10,000–15,000 and 30,000 per well, respectively, onto 12‐mm coverslips coated with a mixture of poly‐DL‐ornithine (Sigma) and laminin (Corning), and maintained in Neurobasal medium supplemented with B27 (Life Technologies) and 5% fetal bovine serum (FBS) (Atlanta Biologicals). For biochemistry, cortical neurons were plated onto 6‐well plates or 60 mm dishes coated with poly‐L‐lysine (Peptide Institute Inc.) at a density of 0.3 or 1 × 10⁶ cells per well or dish, respectively.
Lentivirus production and infection of neuronal cultures
The lentiviral expression vector and three helper plasmids (pRSV‐Rev, pMDLg/pRRE, and VSVG‐expressing plasmid) were co‐transfected into human embryonic kidney 293T (HEK293T) cells using Ca2+ phosphate and maintained in DMEM supplemented with 10% FBS. Cell culture media were collected 40 h after transfection, filtered through 0.45‐μm filters, and centrifuged at 50,000 × g for 2 h at 4°C to concentrate the viral particles. To infect neuronal cultures, concentrated viral solutions were added to conditioned media and incubated for 4–6 h before replacing with fresh media.
Co‐immunoprecipitation
Cultured cortical neurons were infected with lentivirus delivering PSD‐95‐EGFP molecular replacement constructs at DIV 12 and processed for immunoprecipitation at DIV 17. Cells were washed with PBS and extracted in lysis buffer (50 mM Tris, pH 9, 1% deoxycholate, 10 mM NaF, 1.5 μM pepstatin A, 2.1 μM leupeptin, 0.3 μM aprotinin, 0.2 mM PMSF) at 36°C for 30 min. Insoluble material was cleared by centrifuging at 100,000 × g for 30 min, and the resulting supernatants dialyzed overnight against binding buffer (50 mM Tris, pH 7.4, 0.1% Triton X‐100). 50–75 μg of lysate was pre‐cleared with 20 μl protein G‐Sepharose beads (GE Healthcare) for 1 h at 4°C. Pre‐cleared extracts were incubated with 3 μl of rabbit anti‐GFP (Synaptic Systems) for 3 h at 4°C followed by 2 h incubation with 30 μl protein G‐Sepharose beads. Beads were washed four times with binding buffer, and immunoprecipitated proteins eluted with SDS sample buffer for subsequent electrophoresis and immunoblotting.
Primary antibodies
Mouse anti‐PSD‐95 (K28/43), anti‐GFP (N86/38), anti‐GluN2B (N59/36) (NeuroMab, UC Davis), anti‐β‐actin (Abcam), rabbit anti‐Galpha‐i3 (C10, Santa Cruz Biotechnology), anti‐PSD‐95 (phospho‐T19) [EPR2619(2)] (Abcam), and anti‐GluA1 (JWH laboratory; Patriarchi et al, 2016) were used for immunoblotting, and rabbit anti‐GluA1 (PC246, Calbiochem) for immunofluorescence. Rabbit anti‐GFP (Synaptic Systems) was used for immunoprecipitation.
Immunofluorescence
For surface AMPAR labeling, cultured neurons at 14‐day in vitro (DIV) were infected with lentivirus, delivering PSD‐95 molecular replacement constructs. This infection was preceded, if indicated, by transfection with CaM‐IRES‐ECFP constructs using Ca2+ phosphate on 10–12 DIV. Neurons were fixed for 5 min at room temperature in phosphate‐buffered saline (PBS) containing 4% paraformaldehyde/4% sucrose, washed with PBS, blocked with 5% bovine serum albumin (BSA)/4% normal goat serum (Jackson ImmunoResearch) in PBS for 30 min, and incubated with rabbit anti‐GluA1 N‐terminal antibody in PBS containing 2% BSA for 2 h at room temperature without permeabilization. Following washes with PBS and blocking for 1 h, samples were incubated with AlexaFluor 555‐conjugated anti‐rabbit secondary antibody (Molecular Probes) in PBS containing 5% BSA for 1 h. After final washes with PBS, coverslips were mounted onto glass slides using ProLong Gold AntiFade reagent (Molecular Probes). Fluorescence images were acquired on an LSM700 confocal microscope (Zeiss) using a 63× oil‐immersion objective (NA 1.4) and optical zoom of 0.5, as a Z‐series of 8–10 slices with 0.3–0.4 μm intervals and pixel size 0.1 μm. All conditions within the same experiment were imaged using the same microscope settings. Maximum intensity projection images were analyzed with MetaMorph Imaging (Molecular Devices). Briefly, 3–4 dendritic segments between branch points (total length 100–120 μm) among secondary and tertiary dendrites along similar distances out from the soma were manually traced per neuron and average intensities per square area of surface fluorescence staining measured. For background correction, fluorescence intensities of equivalent areas drawn outside the labeled neurons were subtracted. For colocalization analysis, “correlation plot” plug‐in within MetaMorph was used to obtain the correlation coefficient (r) of the pixel intensity data that measures the correlation between the intensities of corresponding pixels in two channels for each image. Data were averaged per neuron, and means from several neurons were then averaged to obtain a final mean. Subsequently, data from at least 3 independent experiments performed in different cultures were pooled to obtain a mean for each condition.
For spine enrichment experiments, cultured neurons were co‐transfected with mCherry (used as neuronal “fill” to visualize dendritic spines) and any of the indicated PSD‐95 constructs carrying a C‐terminal EGFP tag as described above. Neurons were fixed as above for 10 min, washed with PBS, and mounted onto glass slides. Confocal images of the intrinsic fluorescence were obtained as described above except that an optical zoom of 1.5 and 10–14 slices was used. Maximum intensity projection images were obtained, and dendritic spine heads were visually detected and their outlines manually traced using MetaMorph. Average fluorescence intensities per square area for the traced areas along with those of the adjacent dendritic shaft were determined. Spine enrichment is measured as the ratio of EGFP intensity in spine heads to that in the adjacent dendrite. Spine morphological analysis was performed semi‐automatically with NeuronStudio (Rodriguez et al, 2008). For all experiments, cultures were treated with or without bicuculline methiodide (Sigma) (50 μM) for 24–48 h before fixation on DIV 19–21.
Palmitoylation assay
Palmitoylation in neurons was assessed in cell extracts from sister cultures of DIV 17–18 cortical neurons (1 × 10⁶ cells/60‐mm dish) using acyl‐biotinyl exchange (ABE) method as described previously (Wan et al, 2007) with certain modifications. After brief rinse with PBS, cells were lysed in 0.1 ml of lysis buffer (LB; PBS, pH 7.2, 150 mM NaCl, 5 mM EDTA, 1.5 μM pepstatin A, 2.1 μM leupeptin, 0.3 μM aprotinin, 0.2 mM PMSF, 10 mM NaF) containing 2% SDS and, to block free thiols, 25 mM N‐ethyl‐maleimide (NEM; Sigma). After 15 min of extraction at 37°C, samples were diluted 10‐fold with LB containing 2% Triton X‐100 and 25 mM NEM and incubated at 4°C for 1 h. Lysates were cleared by centrifugation at 16,000 × g for 10 min, and resulting supernatants were used for the ABE assay after estimating protein concentrations using BCA assay (ThermoScientific). Supernatants (140–150 μg) were precipitated by chloroform–methanol (CM) and protein pellets solubilized in 0.5 ml of PBS, pH 7.2, 4% SDS, 5 mM EDTA (4SB) supplemented with 25 mM NEM at 37°C for 10 min. The protein was diluted fivefold with LB containing 0.2% Triton X‐100 and 1 mM NEM and incubated at 4°C overnight with end‐to‐end rotation. Excess NEM was removed by three sequential CM precipitations followed by solubilization in 0.24 ml of buffer 4SB. To cleave thioester bonds and allow incorporation of a biotin moiety at exposed sulfur atoms, each sample was diluted fivefold in 0.7 M hydroxylamine (NH2OH), pH 7.4, 0.2% Triton X‐100, 1.5 μM pepstatin A, 2.1 μM leupeptin, 0.3 μM aprotinin, 0.2 mM PMSF (HB) containing 1 mM EZ‐link HPDP‐biotin (ThermoScientific). As a control, a duplicate of one of the samples was diluted fivefold in the same buffer in which hydroxylamine was replaced with Tris (50 mM, pH 7.4). In the absence of hydroxylamine, palmitate groups are not removed thereby preventing biotinylation‐mediated purification. The mixture was incubated at room temperature for 1 h with end‐to‐end rotation and subjected to CM precipitation. The precipitated protein was solubilized in buffer 4SB, diluted fivefold with buffer LB containing 0.2% Triton X‐100 and 0.2 mM HPDP‐biotin, and incubated for 1 h at room temperature with end‐to‐end rotation. Unreacted HPDP‐biotin was removed by two sequential CM precipitations, and the protein pellets solubilized in 0.1 ml of PBS, pH 7.2, 2% SDS, 5 mM EDTA (2SB). Following twofold dilution in LB containing 0.2% Triton X‐100, 10% (v/v) of each sample was saved as input to assess total expression levels. Sample was further diluted fivefold in LB containing 0.2% Triton X‐100 and incubated at room temperature for 30 min with end‐to‐end rotation. After brief centrifugation, the supernatant was incubated with 40 μl UltraLink NeutrAvidin Plus agarose beads (ThermoScientific) for 90 min at room temperature with end‐to‐end rotation to isolate biotinylated proteins. After washing the beads with LB containing 0.2% Triton X‐100 and 0.2% SDS, bound proteins were eluted with 50 μl of SDS–PAGE sample buffer at 95°C for 5 min. Eluates and inputs were subjected to SDS–PAGE and analyzed by Western blotting using indicated primary antibodies and horseradish peroxidase‐conjugated secondary antibodies (Bio‐Rad) before ECL detection (SuperSignal West Femto, ThermoScientific). Films were scanned, and non‐saturated, immunoreactive bands were quantitated using Adobe Photoshop. The level of palmitoylation was quantified as the ratio obtained by normalizing the band in the pull‐down blot to the corresponding input band for each sample. Before calculating the ratio, both the pull‐down and input bands for PSD‐95 were normalized to bands for the control protein within respective lanes to correct for potential variations in sample handling and loading.
For palmitoylation in HEK293 cells, cells were transfected with indicated PSD‐95‐EGFP constructs using jetPrime reagent (Polyplus Transfection). 24 h post‐transfection, cells were washed in PBS and lysed with 100–250 μl of lysis buffer (LB) containing 1% Triton X‐100 for 1 h at 4°C. Lysates were cleared by centrifugation at 16,000 × g for 30 min, and resulting supernatants were used for the ABE assay as described above.
Detection of phospho‐T19‐PSD‐95
Phosphorylation of PSD‐95 in neurons was assessed in cell extracts from sister cultures of DIV 17‐18 cortical neurons (1 × 10⁶ cells/60‐mm dish). Whole‐cell lysates were prepared as described for palmitoylation assays. Lysates were subjected to SDS–PAGE and analyzed by Western blotting using indicated primary antibodies. The level of phosphorylation was quantified as the ratio obtained by normalizing the band in the pT19 blot to the corresponding band in total PSD‐95 blot for each sample. Before calculating the ratio, both the pT19 and total PSD‐95 bands were normalized to bands for β‐actin within respective lanes to correct for potential variations in loading.
Miniature excitatory postsynaptic currents (mEPSC) analysis
Primary hippocampal neurons were co‐transfected with RFP and either WT or R126E mutant CaM‐IRES‐ECFP plasmids at DIV 10–11. RFP was used as a transfection marker. Same cultures were subsequently infected with lentivirus delivering molecular replacement constructs of PSD‐95‐EGFP (WT or E17R) at DIV 12–13. Recording of mEPSCs was performed at DIV 17–19 following 48 h of BIC treatment, using slightly modified protocols published earlier (Matt et al, 2011; Chen et al, 2014). Coverslips with cultured neurons were transferred into a submerged‐type recording chamber, and neurons, both transfected and infected, were visually selected for recording by RFP and GFP epifluorescence. External solution contained (in mM) the following: 135 NaCl, 5 KCl, 1 CaCl2, 1 MgSO4, 10 HEPES, 0.001 tetrodotoxin (Tocris), 0.02 bicuculline (Sigma), 0.05 DL‐AP5 (Tocris Bioscience), pH 7.4, 280–300 mOsm/l. Patch micropipettes (2–4 MΩ) were filled with intracellular solution (in mM; 145 CsCl, 0.1 CaCl2, 2 MgSO4, 1 EGTA, 5 HEPES, pH 7.4, 280–300 mOsm/l). The seal resistance was greater than 1 GΩ, and the series resistance was no greater than 20 MΩ. Recordings were made with an Axopatch 200B patch‐amplifier (Molecular Devices). All neurons were voltage‐clamped at −70 mV, and whole‐cell currents were filtered at 2 kHz and digitized at 10 kHz. The mEPSC events were detected with MiniAnalysis software (Synaptosoft Inc.), and the accuracy of detection was confirmed by visual inspection. In each individual experiment, neurons from all six groups were recorded on the same day.
Statistical analysis
All data were expressed as mean ± SEM, unless otherwise indicated. Student's unpaired two‐tailed t‐test was used for comparing two groups. Multiple comparisons were performed using one‐way or two‐way ANOVA followed by Bonferroni's post hoc test for pairwise comparisons. Statistical significance was determined with GraphPad Prism or SigmaPlot software and was considered as P < 0.05.
Data availability
The NMR assignments have been deposited in the BMRB (accession number 30062). The atomic coordinates have been deposited into the Protein Databank (5J7J).
Author contributions
MT, DA, and YZ carried out NMR analysis, TP and ACH the FP assays, DC the neuronal experiments, including all culturing, generation of cDNA constructs and lentiviruses, imaging and biochemical analysis, and DC, JS and C‐YC the mEPSC recording and analysis. C‐YC, JBA, and JWH supervised the project. MT, DC, C‐YC, JBA, and JWH wrote the article.
Conflict of interest
The authors declare that they have no conflict of interest.
Supporting information
Expanded View Figures PDF
Review Process File
Source Data for Figure 4
Acknowledgements
This work was supported by NIH grants R01 EY012347 (JBA), R01MH097887 (JWH), R01 AG055357 (JWH), and R01 NS078792 (JWH), and the American Heart Association Postdoctoral Fellowship 16POST26560000 (DC).
The EMBO Journal (2018) 37: 122–138
Contributor Information
James B Ames, Email: jbames@ucdavis.edu.
Johannes W Hell, Email: jwhell@ucdavis.edu.
References
- Araya R, Eisenthal KB, Yuste R (2006) Dendritic spines linearize the summation of excitatory potentials. Proc Natl Acad Sci USA 103: 18799–18804 [DOI] [PMC free article] [PubMed] [Google Scholar]
- Araya R, Vogels TP, Yuste R (2014) Activity‐dependent dendritic spine neck changes are correlated with synaptic strength. Proc Natl Acad Sci USA 111: E2895–E2904 [DOI] [PMC free article] [PubMed] [Google Scholar]
- Bartos JA, Ulrich JD, Li H, Beazely MA, Chen Y, Macdonald JF, Hell JW (2010) Postsynaptic clustering and activation of Pyk2 by PSD‐95. J Neurosci 30: 449–463 [DOI] [PMC free article] [PubMed] [Google Scholar]
- Beique JC, Na Y, Kuhl D, Worley PF, Huganir RL (2011) Arc‐dependent synapse‐specific homeostatic plasticity. Proc Natl Acad Sci USA 108: 816–821 [DOI] [PMC free article] [PubMed] [Google Scholar]
- Chen L, Chetkovich DM, Petralia RS, Sweeney NT, Kawasaki Y, Wenthold RJ, Bredt DS, Nicoll RA (2000) Stargazing regulates synaptic targeting of AMPA receptors by two distinct mechanisms. Nature 408: 936–943 [DOI] [PubMed] [Google Scholar]
- Chen CY, Matt L, Hell JW, Rogawski MA (2014) Perampanel inhibition of AMPA receptor currents in cultured hippocampal neurons. PLoS ONE 9: e108021 [DOI] [PMC free article] [PubMed] [Google Scholar]
- Collingridge GL, Isaac JT, Wang YT (2004) Receptor trafficking and synaptic plasticity. Nat Rev 5: 952–962 [DOI] [PubMed] [Google Scholar]
- Delaglio F, Grzesiek S, Vuister GW, Zhu G, Pfeifer J, Bax A (1995) NMRPipe: a multidimensional spectral processing system based on UNIX pipes. J Biomol NMR 6: 277–293 [DOI] [PubMed] [Google Scholar]
- Desai NS, Cudmore RH, Nelson SB, Turrigiano GG (2002) Critical periods for experience‐dependent synaptic scaling in visual cortex. Nat Neurosci 5: 783–789 [DOI] [PubMed] [Google Scholar]
- Diering GH, Gustina AS, Huganir RL (2014) PKA‐GluA1 coupling via AKAP5 controls AMPA receptor phosphorylation and cell surface targeting during bidirectional homeostatic plasticity. Neuron 84: 790–805 [DOI] [PMC free article] [PubMed] [Google Scholar]
- Efimova N, Korobova F, Stankewich MC, Moberly AH, Stolz DB, Wang J, Kashina A, Ma M, Svitkina T (2017) betaIII spectrin is necessary for formation of the constricted neck of dendritic spines and regulation of synaptic activity in neurons. J Neurosci 37: 6442–6459 [DOI] [PMC free article] [PubMed] [Google Scholar]
- Ehrlich I, Malinow R (2004) Postsynaptic density 95 controls AMPA receptor incorporation during long‐term potentiation and experience‐driven synaptic plasticity. J Neurosci 24: 916–927 [DOI] [PMC free article] [PubMed] [Google Scholar]
- El‐Husseini AE, Craven SE, Chetkovich DM, Firestein BL, Schnell E, Aoki C, Bredt DS (2000) Dual palmitoylation of PSD‐95 mediates its vesiculotubular sorting, postsynaptic targeting, and ion channel clustering. J Cell Biol 148: 159–172 [DOI] [PMC free article] [PubMed] [Google Scholar]
- El‐Husseini Ael D, Bredt DS (2002) Protein palmitoylation: a regulator of neuronal development and function. Nat Rev Neurosci 3: 791–802 [DOI] [PubMed] [Google Scholar]
- El‐Husseini Ael D, Schnell E, Dakoji S, Sweeney N, Zhou Q, Prange O, Gauthier‐Campbell C, Aguilera‐Moreno A, Nicoll RA, Bredt DS (2002) Synaptic strength regulated by palmitate cycling on PSD‐95. Cell 108: 849–863 [DOI] [PubMed] [Google Scholar]
- Elias GM, Funke L, Stein V, Grant SG, Bredt DS, Nicoll RA (2006) Synapse‐specific and developmentally regulated targeting of AMPA receptors by a family of MAGUK scaffolding proteins. Neuron 52: 307–320 [DOI] [PubMed] [Google Scholar]
- Esteban JA, Shi SH, Wilson C, Nuriya M, Huganir RL, Malinow R (2003) PKA phosphorylation of AMPA receptor subunits controls synaptic trafficking underlying plasticity. Nat Neurosci 6: 136–143 [DOI] [PubMed] [Google Scholar]
- Fernandes D, Carvalho AL (2016) Mechanisms of homeostatic plasticity in the excitatory synapse. J Neurochem 139: 973–996 [DOI] [PubMed] [Google Scholar]
- Fukata M, Fukata Y, Adesnik H, Nicoll RA, Bredt DS (2004) Identification of PSD‐95 palmitoylating enzymes. Neuron 44: 987–996 [DOI] [PubMed] [Google Scholar]
- Fukata Y, Dimitrov A, Boncompain G, Vielemeyer O, Perez F, Fukata M (2013) Local palmitoylation cycles define activity‐regulated postsynaptic subdomains. J Cell Biol 202: 145–161 [DOI] [PMC free article] [PubMed] [Google Scholar]
- Fukunaga Y, Matsubara M, Nagai R, Miyazawa A (2005) The interaction between PSD‐95 and Ca2+/calmodulin is enhanced by PDZ‐binding proteins. J Biochem 138: 177–182 [DOI] [PubMed] [Google Scholar]
- Gainey MA, Tatavarty V, Nahmani M, Lin H, Turrigiano GG (2015) Activity‐dependent synaptic GRIP1 accumulation drives synaptic scaling up in response to action potential blockade. Proc Natl Acad Sci USA 112: E3590–E3599 [DOI] [PMC free article] [PubMed] [Google Scholar]
- Hayashi Y, Shi SH, Esteban JA, Piccini A, Poncer JC, Malinow R (2000) Driving AMPA receptors into synapses by LTP and CaMKII: requirement for GluR1 and PDZ domain interaction. Science 287: 2262–2267 [DOI] [PubMed] [Google Scholar]
- He K, Song L, Cummings LW, Goldman J, Huganir RL, Lee HK (2009) Stabilization of Ca2+‐permeable AMPA receptors at perisynaptic sites by GluR1‐S845 phosphorylation. Proc Natl Acad Sci USA 106: 20033–20038 [DOI] [PMC free article] [PubMed] [Google Scholar]
- Hell JW (2014) CaMKII: claiming center stage in postsynaptic function and organization. Neuron 81: 249–265 [DOI] [PMC free article] [PubMed] [Google Scholar]
- Hoeflich KP, Ikura M (2002) Calmodulin in action: diversity in target recognition and activation mechanisms. Cell 108: 739–742 [DOI] [PubMed] [Google Scholar]
- Hou Q, Gilbert J, Man HY (2011) Homeostatic regulation of AMPA receptor trafficking and degradation by light‐controlled single‐synaptic activation. Neuron 72: 806–818 [DOI] [PMC free article] [PubMed] [Google Scholar]
- Huganir RL, Nicoll RA (2013) AMPARs and synaptic plasticity: the last 25 years. Neuron 80: 704–717 [DOI] [PMC free article] [PubMed] [Google Scholar]
- Joiner ML, Lise MF, Yuen EY, Kam AY, Zhang M, Hall DD, Malik ZA, Qian H, Chen Y, Ulrich JD, Burette AC, Weinberg RJ, Law PY, El‐Husseini A, Yan Z, Hell JW (2010) Assembly of a beta(2)‐adrenergic receptor‐GluR1 signalling complex for localized cAMP signalling. EMBO J 29: 482–495 [DOI] [PMC free article] [PubMed] [Google Scholar]
- Kim S, Ziff EB (2014) Calcineurin mediates synaptic scaling via synaptic trafficking of Ca2+‐permeable AMPA receptors. PLoS Biol 12: e1001900 [DOI] [PMC free article] [PubMed] [Google Scholar]
- Kurokawa H, Osawa M, Kurihara H, Katayama N, Tokumitsu H, Swindells MB, Kainosho M, Ikura M (2001) Target‐induced conformational adaptation of calmodulin revealed by the crystal structure of a complex with nematode Ca(2+)/calmodulin‐dependent kinase kinase peptide. J Mol Biol 312: 59–68 [DOI] [PubMed] [Google Scholar]
- Lim IA, Hall DD, Hell JW (2002) Selectivity and promiscuity of the first and second PDZ domains of PSD‐ 95 and synapse‐associated protein 102. J Biol Chem 277: 21697–21711 [DOI] [PubMed] [Google Scholar]
- Malenka RC, Bear MF (2004) LTP and LTD: an embarrassment of riches. Neuron 44: 5–21 [DOI] [PubMed] [Google Scholar]
- Masuko N, Makino K, Kuwahara H, Fukunaga K, Sudo T, Araki N, Yamamoto H, Yamada Y, Miyamoto E, Saya H (1999) Interaction of NE‐dlg/SAP102, a neuronal and endocrine tissue‐specific membrane‐associated guanylate kinase protein, with calmodulin and PSD‐ 95/SAP90. A possible regulatory role in molecular clustering at synaptic sites. J Biol Chem 274: 5782–5790 [DOI] [PubMed] [Google Scholar]
- Matt L, Michalakis S, Hofmann F, Hammelmann V, Ludwig A, Biel M, Kleppisch T (2011) HCN2 channels in local inhibitory interneurons constrain LTP in the hippocampal direct perforant path. Cell Mol Life Sci 68: 125–137 [DOI] [PMC free article] [PubMed] [Google Scholar]
- Meyer T, Hanson PI, Stryer L, Schulman H (1992) Calmodulin trapping by calcium‐calmodulin‐dependent protein kinase. Science 256: 1199–1202 [DOI] [PubMed] [Google Scholar]
- Micheva KD, Busse B, Weiler NC, O'Rourke N, Smith SJ (2010) Single‐synapse analysis of a diverse synapse population: proteomic imaging methods and markers. Neuron 68: 639–653 [DOI] [PMC free article] [PubMed] [Google Scholar]
- Morabito MA, Sheng M, Tsai LH (2004) Cyclin‐dependent kinase 5 phosphorylates the N‐terminal domain of the postsynaptic density protein PSD‐95 in neurons. J Neurosci 24: 865–876 [DOI] [PMC free article] [PubMed] [Google Scholar]
- Nair D, Hosy E, Petersen JD, Constals A, Giannone G, Choquet D, Sibarita JB (2013) Super‐resolution imaging reveals that AMPA receptors inside synapses are dynamically organized in nanodomains regulated by PSD95. J Neurosci 33: 13204–13224 [DOI] [PMC free article] [PubMed] [Google Scholar]
- Nelson CD, Kim MJ, Hsin H, Chen Y, Sheng M (2013) Phosphorylation of threonine‐19 of PSD‐95 by GSK‐3beta is required for PSD‐95 mobilization and long‐term depression. J Neurosci 33: 12122–12135 [DOI] [PMC free article] [PubMed] [Google Scholar]
- Noritake J, Fukata Y, Iwanaga T, Hosomi N, Tsutsumi R, Matsuda N, Tani H, Iwanari H, Mochizuki Y, Kodama T, Matsuura Y, Bredt DS, Hamakubo T, Fukata M (2009) Mobile DHHC palmitoylating enzyme mediates activity‐sensitive synaptic targeting of PSD‐95. J Cell Biol 186: 147–160 [DOI] [PMC free article] [PubMed] [Google Scholar]
- O'Brien RJ, Kamboj S, Ehlers MD, Rosen KR, Fischbach GD, Huganir RL (1998) Activity‐dependent modulation of synaptic AMPA receptor accumulation. Neuron 21: 1067–1078 [DOI] [PubMed] [Google Scholar]
- Opazo P, Labrecque S, Tigaret CM, Frouin A, Wiseman PW, De Koninck P, Choquet D (2010) CaMKII triggers the diffusional trapping of surface AMPARs through phosphorylation of stargazin. Neuron 67: 239–252 [DOI] [PubMed] [Google Scholar]
- Ottinger M, Delaglio F, Bax A (1998) Measurement of J and dipolar couplings from simplified two‐dimensional NMR spectra. J Magn Reson 131: 373–378 [DOI] [PubMed] [Google Scholar]
- Paarmann I, Spangenberg O, Lavie A, Konrad M (2002) Formation of complexes between Ca2+ calmodulin and the synapse‐ associated protein SAP97 requires the SH3 domain‐guanylate kinase domain‐connecting HOOK region. J Biol Chem 277: 40832–40838 [DOI] [PubMed] [Google Scholar]
- Pang ZP, Cao P, Xu W, Sudhof TC (2010) Calmodulin controls synaptic strength via presynaptic activation of calmodulin kinase II. J Neurosci 30: 4132–4142 [DOI] [PMC free article] [PubMed] [Google Scholar]
- Patriarchi T, Qian H, Di Biase V, Malik ZA, Chowdhury D, Price JL, Hammes EA, Buonarati OR, Westenbroek RE, Catterall WA, Hofmann F, Xiang YK, Murphy GG, Chen C‐Y, Navedo MF, Hell JW (2016) Phosphorylation of Cav1.2 on S1928 uncouples the L‐type Ca2+ channel from the β2 adrenergic receptor. EMBO J 35: 1330–1345 [DOI] [PMC free article] [PubMed] [Google Scholar]
- Peineau S, Taghibiglou C, Bradley C, Wong TP, Liu L, Lu J, Lo E, Wu D, Saule E, Bouschet T, Matthews P, Isaac JT, Bortolotto ZA, Wang YT, Collingridge GL (2007) LTP inhibits LTD in the hippocampus via regulation of GSK3beta. Neuron 53: 703–717 [DOI] [PubMed] [Google Scholar]
- Perez‐Otano I, Lujan R, Tavalin SJ, Plomann M, Modregger J, Liu XB, Jones EG, Heinemann SF, Lo DC, Ehlers MD (2006) Endocytosis and synaptic removal of NR3A‐containing NMDA receptors by PACSIN1/syndapin1. Nat Neurosci 9: 611–621 [DOI] [PMC free article] [PubMed] [Google Scholar]
- Pettersen EF, Goddard TD, Huang CC, Couch GS, Greenblatt DM, Meng EC, Ferrin TE (2004) UCSF Chimera–a visualization system for exploratory research and analysis. J Comput Chem 25: 1605–1612 [DOI] [PubMed] [Google Scholar]
- Pratt KG, Zimmerman EC, Cook DG, Sullivan JM (2011) Presenilin 1 regulates homeostatic synaptic scaling through Akt signaling. Nat Neurosci 14: 1112–1114 [DOI] [PMC free article] [PubMed] [Google Scholar]
- Rajman M, Metge F, Fiore R, Khudayberdiev S, Aksoy‐Aksel A, Bicker S, Ruedell Reschke C, Raoof R, Brennan GP, Delanty N, Farrell MA, O'Brien DF, Bauer S, Norwood B, Veno MT, Kruger M, Braun T, Kjems J, Rosenow F, Henshall DC et al (2017) A microRNA‐129‐5p/Rbfox crosstalk coordinates homeostatic downscaling of excitatory synapses. EMBO J 36: 1770–1787 [DOI] [PMC free article] [PubMed] [Google Scholar]
- Rhoads AR, Friedberg F (1997) Sequence motifs for calmodulin recognition. FASEB J 11: 331–340 [DOI] [PubMed] [Google Scholar]
- Rodriguez A, Ehlenberger DB, Dickstein DL, Hof PR, Wearne SL (2008) Automated three‐dimensional detection and shape classification of dendritic spines from fluorescence microscopy images. PLoS ONE 3: e1997 [DOI] [PMC free article] [PubMed] [Google Scholar]
- Sanderson JL, Gorski JA, Dell'Acqua ML (2016) NMDA receptor‐dependent LTD requires transient synaptic incorporation of Ca(2+)‐Permeable AMPARs mediated by AKAP150‐Anchored PKA and calcineurin. Neuron 89: 1000–1015 [DOI] [PMC free article] [PubMed] [Google Scholar]
- Schluter OM, Xu W, Malenka RC (2006) Alternative N‐terminal domains of PSD‐95 and SAP97 govern activity‐dependent regulation of synaptic AMPA receptor function. Neuron 51: 99–111 [DOI] [PubMed] [Google Scholar]
- Schnell E, Sizemore M, Karimzadegan S, Chen L, Bredt DS, Nicoll RA (2002) Direct interactions between PSD‐95 and stargazin control synaptic AMPA receptor number. Proc Natl Acad Sci USA 99: 13902–13907 [DOI] [PMC free article] [PubMed] [Google Scholar]
- Sdrulla AD, Linden DJ (2007) Double dissociation between long‐term depression and dendritic spine morphology in cerebellar Purkinje cells. Nat Neurosci 10: 546–548 [DOI] [PubMed] [Google Scholar]
- Siddoway BA, Altimimi HF, Hou H, Petralia RS, Xu B, Stellwagen D, Xia H (2013) An essential role for inhibitor‐2 regulation of protein phosphatase‐1 in synaptic scaling. J Neurosci 33: 11206–11211 [DOI] [PMC free article] [PubMed] [Google Scholar]
- Singla SI, Hudmon A, Goldberg JM, Smith JL, Schulman H (2001) Molecular characterization of calmodulin trapping by calcium/calmodulin‐ dependent protein kinase II. J Biol Chem 276: 29353–29360 [DOI] [PubMed] [Google Scholar]
- Sinnen BL, Bowen AB, Forte JS, Hiester BG, Crosby KC, Gibson ES, Dell'Acqua ML, Kennedy MJ (2017) Optogenetic control of synaptic composition and function. Neuron 93: 646–660.e5 [DOI] [PMC free article] [PubMed] [Google Scholar]
- Soares C, Lee KF, Nassrallah W, Beique JC (2013) Differential subcellular targeting of glutamate receptor subtypes during homeostatic synaptic plasticity. J Neurosci 33: 13547–13559 [DOI] [PMC free article] [PubMed] [Google Scholar]
- Steiner P, Higley MJ, Xu W, Czervionke BL, Malenka RC, Sabatini BL (2008) Destabilization of the postsynaptic density by PSD‐95 serine 73 phosphorylation inhibits spine growth and synaptic plasticity. Neuron 60: 788–802 [DOI] [PMC free article] [PubMed] [Google Scholar]
- Steinmetz CC, Tatavarty V, Sugino K, Shima Y, Joseph A, Lin H, Rutlin M, Lambo M, Hempel CM, Okaty BW, Paradis S, Nelson SB, Turrigiano GG (2016) Upregulation of mu3A drives homeostatic plasticity by rerouting AMPAR into the recycling endosomal pathway. Cell Rep 16: 2711–2722 [DOI] [PMC free article] [PubMed] [Google Scholar]
- Sturgill JF, Steiner P, Czervionke BL, Sabatini BL (2009) Distinct domains within PSD‐95 mediate synaptic incorporation, stabilization, and activity‐dependent trafficking. J Neurosci 29: 12845–12854 [DOI] [PMC free article] [PubMed] [Google Scholar]
- Sun Q, Turrigiano GG (2011) PSD‐95 and PSD‐93 play critical but distinct roles in synaptic scaling up and down. J Neurosci 31: 6800–6808 [DOI] [PMC free article] [PubMed] [Google Scholar]
- Tan HL, Queenan BN, Huganir RL (2015) GRIP1 is required for homeostatic regulation of AMPAR trafficking. Proc Natl Acad Sci USA 112: 10026–10031 [DOI] [PMC free article] [PubMed] [Google Scholar]
- Tang AH, Chen H, Li TP, Metzbower SR, MacGillavry HD, Blanpied TA (2016) A trans‐synaptic nanocolumn aligns neurotransmitter release to receptors. Nature 536: 210–214 [DOI] [PMC free article] [PubMed] [Google Scholar]
- Thiagarajan TC, Lindskog M, Tsien RW (2005) Adaptation to synaptic inactivity in hippocampal neurons. Neuron 47: 725–737 [DOI] [PubMed] [Google Scholar]
- Tokumitsu H, Wayman GA, Muramatsu M, Soderling TR (1997) Calcium/calmodulin‐dependent protein kinase kinase: identification of regulatory domains. Biochemistry 36: 12823–12827 [DOI] [PubMed] [Google Scholar]
- Turrigiano GG, Leslie KR, Desai NS, Rutherford LC, Nelson SB (1998) Activity‐dependent scaling of quantal amplitude in neocortical neurons. Nature 391: 892–896 [DOI] [PubMed] [Google Scholar]
- Wan J, Roth AF, Bailey AO, Davis NG (2007) Palmitoylated proteins: purification and identification. Nat Protoc 2: 1573–1584 [DOI] [PubMed] [Google Scholar]
- Wang XB, Yang Y, Zhou Q (2007) Independent expression of synaptic and morphological plasticity associated with long‐term depression. J Neurosci 27: 12419–12429 [DOI] [PMC free article] [PubMed] [Google Scholar]
- Wang G, Gilbert J, Man HY (2012) AMPA receptor trafficking in homeostatic synaptic plasticity: functional molecules and signaling cascades. Neural Plast 2012: 825364 [DOI] [PMC free article] [PubMed] [Google Scholar]
- Wei J, Liu W, Yan Z (2010) Regulation of AMPA receptor trafficking and function by glycogen synthase kinase 3. J Biol Chem 285: 26369–26376 [DOI] [PMC free article] [PubMed] [Google Scholar]
- Xu W, Schluter OM, Steiner P, Czervionke BL, Sabatini B, Malenka RC (2008) Molecular dissociation of the role of PSD‐95 in regulating synaptic strength and LTD. Neuron 57: 248–262 [DOI] [PMC free article] [PubMed] [Google Scholar]
- Yang Y, Wang XB, Frerking M, Zhou Q (2008) Delivery of AMPA receptors to perisynaptic sites precedes the full expression of long‐term potentiation. Proc Natl Acad Sci USA 105: 11388–11393 [DOI] [PMC free article] [PubMed] [Google Scholar]
- Yokoi N, Fukata Y, Sekiya A, Murakami T, Kobayashi K, Fukata M (2016) Identification of PSD‐95 depalmitoylating enzymes. J Neurosci 36: 6431–6444 [DOI] [PMC free article] [PubMed] [Google Scholar]
- Zhang Y, Li Z, Sacks DB, Ames JB (2012) Structural basis for Ca2+‐induced activation and dimerization of estrogen receptor alpha by calmodulin. J Biol Chem 287: 9336–9344 [DOI] [PMC free article] [PubMed] [Google Scholar]
- Zhang Y, Matt L, Patriarchi T, Malik ZA, Chowdhury D, Park DK, Renieri A, Ames JB, Hell JW (2014) Capping of the N‐terminus of PSD‐95 by calmodulin triggers its postsynaptic release. EMBO J 33: 1341–1353 [DOI] [PMC free article] [PubMed] [Google Scholar]
- van Zundert GC, Bonvin AM (2014) Modeling protein‐protein complexes using the HADDOCK webserver “modeling protein complexes with HADDOCK”. Methods Mol Biol 1137: 163–179 [DOI] [PubMed] [Google Scholar]
- Zweckstetter M (2008) NMR: prediction of molecular alignment from structure using the PALES software. Nat Protoc 3: 679–690 [DOI] [PubMed] [Google Scholar]
Associated Data
This section collects any data citations, data availability statements, or supplementary materials included in this article.
Supplementary Materials
Expanded View Figures PDF
Review Process File
Source Data for Figure 4
Data Availability Statement
The NMR assignments have been deposited in the BMRB (accession number 30062). The atomic coordinates have been deposited into the Protein Databank (5J7J).