Abstract
The LinkedOmics database contains multi-omics data and clinical data for 32 cancer types and a total of 11 158 patients from The Cancer Genome Atlas (TCGA) project. It is also the first multi-omics database that integrates mass spectrometry (MS)-based global proteomics data generated by the Clinical Proteomic Tumor Analysis Consortium (CPTAC) on selected TCGA tumor samples. In total, LinkedOmics has more than a billion data points. To allow comprehensive analysis of these data, we developed three analysis modules in the LinkedOmics web application. The LinkFinder module allows flexible exploration of associations between a molecular or clinical attribute of interest and all other attributes, providing the opportunity to analyze and visualize associations between billions of attribute pairs for each cancer cohort. The LinkCompare module enables easy comparison of the associations identified by LinkFinder, which is particularly useful in multi-omics and pan-cancer analyses. The LinkInterpreter module transforms identified associations into biological understanding through pathway and network analysis. Using five case studies, we demonstrate that LinkedOmics provides a unique platform for biologists and clinicians to access, analyze and compare cancer multi-omics data within and across tumor types. LinkedOmics is freely available at http://www.linkedomics.org.
INTRODUCTION
Multi-omics analysis is becoming increasingly popular in biomedical research. As a prime example, The Cancer Genome Atlas (TCGA) project has performed molecular profiling of human tumors using genomic, epigenomic, transcriptomic, and proteomic platforms, and each tumor is comprehensively characterized by around 100 000 molecular attributes in addition to typical clinical attributes. To make these data directly available to the entire cancer research community, several data portals have been developed, such as the OASIS (1), the cBioPortal (2), the UCSC Cancer Genomics Browser (3) and The Cancer Proteome Atlas (4). However, none of the existing data portals allow systematic exploration and interpretation of the complex relationships between the vast amount of clinical and molecular attributes.
Here, we report the LinkedOmics database that contains multi-omics data and clinical data for 32 cancer types and a total of 11 158 patients from the TCGA project. It is also the first multi-omics database that integrates mass spectrometry (MS)-based global proteomics data generated by the Clinical Proteomic Tumor Analysis Consortium (CPTAC) on selected TCGA tumor samples. In total, LinkedOmics has more than a billion data points. To allow comprehensive analysis of these data, we developed three analysis modules in the LinkedOmics web application (http://www.linkedomics.org). The LinkFinder module allows flexible exploration of associations between a molecular or clinical attribute of interest and all other attributes, providing the opportunity to analyze and visualize associations between billions of attribute pairs for each cancer cohort. The LinkCompare module enables easy comparison of the associations identified by LinkFinder, which is particularly useful in multi-omics and pan-cancer analyses. The LinkInterpreter module transforms identified associations into biological understanding through pathway and network analysis. We use five case studies to demonstrate the utility of this unique resource in human cancer studies.
DATABASE
Data source and database construction
Genomic, epigenomic, and transcriptomic data for 32 TCGA cancer types were downloaded from the Firehose of the Broad Institute (http://gdac.broadinstitute.org/, January 2016 version). For solid tumors, only data from primary tumors were included in our database except for the skin cutaneous melanoma (SKCM) cohort that includes primarily metastatic cases. Clinical data downloaded from the TCGA data portal includes overall survival time, tumor site, age, histological type, lymphatic invasion status, lymph node pathologic status, primary tumor pathologic spread, tumor stage, and vascular invasion status. Sub-stage level data were merged under respective stage (I, II, III, IV). The molecular subtype annotation, platinum sensitivity and tumor purity data were obtained from literature (5–8). CPTAC proteomic data were downloaded from the CPTAC data portal (9) (https://cptac-data-portal.georgetown.edu/cptacPublic/) in June 2016. All the datasets were further curated by removing rows containing NA’s >60% or Zero's >95%. All metadata in LinkedOmics were stored in a MySQL database (version 5.6). All molecular data were properly normalized and stored as attribute by sample matrix files.
Data content
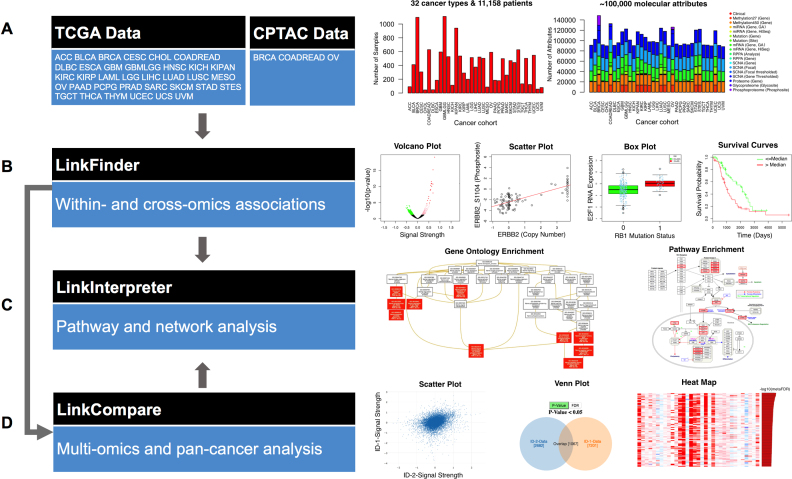
LinkedOmics contains multi-omics data for primary tumors from 32 TCGA cancer types and a total of 11 158 patients (Supplementary Table S1, Figure 1A), including mutation, copy number alteration (CNA), methylation, mRNA expression, miRNA expression and reverse phase protein array (RPPA) data at the gene level, mutation data at the site level, CNA data at the region-level, RPPA data at the analyte-level and clinical data. LinkedOmics also contains MS-based global proteomics data generated by CPTAC on selected TCGA tumor samples, including global proteomics data for breast, colorectal and ovarian cancer at the gene level, phosphoproteomics data for breast and ovarian cancer at the phosphosite level, and glycoproteomics data for ovarian cancer at the glycosite level. In total, LinkedOmics has more than a billion data points (Supplementary Table S2).
Figure 1.
LinkedOmics for discovering, comparing, and understanding the associations between billions of clinical and molecular attribute pairs within and across 32 human cancer types. (A) Data source, cancer cohorts, and the numbers of samples and attributes for each cancer cohort. Explanations of the abbreviations can be found in Supplementary Table S1. (B) The LinkFinder module performs association analysis within and across omics data types. Example outputs include volcano plots, scatter plots, box plots, and survival curve plots. (C) The LinkInterpreter module performs pathway and network analyses for associations identified by LinkFinder or LinkCompare. Example outputs include enriched Gene Ontology (GO) directed acyclic graphs and pathway diagrams. (D) The LinkCompare module compares associations identified by LinkFinder using correlation analysis and scatter plots, Venn diagrams, meta-analysis, heat maps and bar plots.
DATA ANALYSIS MODULES
LinkedOmics has three data analysis modules: LinkFinder, LinkCompare, and LinkInterpreter (Figure 1B–D).
LinkFinder module
The LinkFinder module allows flexible exploration of associations between a molecular or clinical attribute of interest and all other attributes for a selected cancer cohort. The analysis can be performed using all samples within the selected cohort, or a subset of samples such as basal breast cancers. Associations between a query attribute and all target attributes in a user-defined search space, such as RB1 mutation versus mRNA expression in bladder cancer or ERBB2 amplification versus protein phosphorylation in breast cancer, are calculated using appropriate statistical tests depending on the data types of the two attributes. Statistical tests in LinkFinder include Pearson's correlation coefficient, Spearman's rank correlation, Student's t-test, Wilcoxon test, Analysis of Variance, Kruskal–Wallis analysis, Fisher's exact test, Chi-Squared test, Jonckheere's trend test and Cox's regression analysis (Supplementary Table S3). Multiple-test correction is performed using the Benjamini and Hochberg method to generate the False Discovery Rate (FDR).
Each LinkFinder query returns statistical test results for all target attributes in both a tabular format and a volcano plot. Data for top-ranking attributes are visualized in heat maps, and the result for each target attribute can be visualized by a scatter plot, a box plot, or a survival curve plot, depending on the data types of query and target attributes (Figure 1B). Thus, the platform provides the opportunity to analyze and visualize associations between billions of attribute pairs for each cancer cohort.
LinkCompare module
The LinkCompare module enables easy comparison of the associations identified by LinkFinder with different query attributes on the same target dataset (e.g. proteins associated with KRAS mutation vs. BRAF mutation in colorectal cancer), or with the same query attribute on target datasets from different omics platforms (e.g. genes associated with overall survival in the ovarian cancer copy number vs. proteomics datasets), tumor types (e.g., genes associated with overall survival in multiple cancer types) or tumor subtypes (e.g. mRNAs associated with TWIST1 phosphorylation in ER-positive and ER-negative breast tumors). When two sets of association data are compared, a scatter plot is used to visualize the overall correlation between the two and Venn diagram and heat map are used to compare and contrast the significant associations (Figure 1D). In the case of three or more association datasets, a meta-analysis using the sumz method in the metaP R-package (https://cran.r-project.org/web/packages/metap/index.html) is performed to prioritize target attributes showing strong and consistent associations. The results for the top-ranking attributes are visualized using heat map and bar plot (Figure 1D). The LinkCompare module is particularly useful in multi-omics and pan-cancer analyses.
LinkInterpreter module
The LinkInterpreter module transforms associations identified by LinkFinder and LinkCompare into biological understanding (Figure 1C). This module performs gene set and pathway analysis using both over-representation analysis and gene set enrichment analysis (10). Through accessing the comprehensive functional category database in WebGestalt (10), LinkInterpreter evaluates functional enrichment against 26, 449 functional categories defined by Gene Ontology, pathways from the KEGG, Panther, Reactome and WikiPathways databases, as well as protein-protein interaction, transcription factor-target, miRNA-target and kinase-target networks (Supplementary Table S4).
WEB INTERFACE
The LinkedOmics web interface was developed using HTML (Hyper Text Markup Language) and PHP (Hypertext Preprocessor) in combination with JavaScript for front-end dynamic functionality. The interface can be accessed using guest login or personal login with free registration. Personal login has the privilege to store and retrieve previously analysed results. The main page is divided into two panels: navigation and query or output panel (Supplementary Figure S1). From the query panel on the right, the LinkFinder module can be accessed. After selecting the cancer cohort, the query attribute, and the target attribute dataset, computation is performed on-the-fly on the server side and results are made available in the output view, where the LinkInterpreter module can be used to identify enriched biological processes, pathways or network modules based on the LinkFinder results. When multiple sets of LinkFinder results are available in the output view, the LinkCompare module can be used to perform comparative analyses for selected results. A detailed manual on the use of LinkedOmics is available at http://linkedomics.org/Manual/LinkedOmicsManual_1.1.pdf.
CASE STUDIES
We use five case studies to demonstrate the utility of LinkedOmics. These studies not only rediscovered known biology but also generated novel hypotheses.
Functional impact of RB1 mutation on mRNA expression in bladder cancer
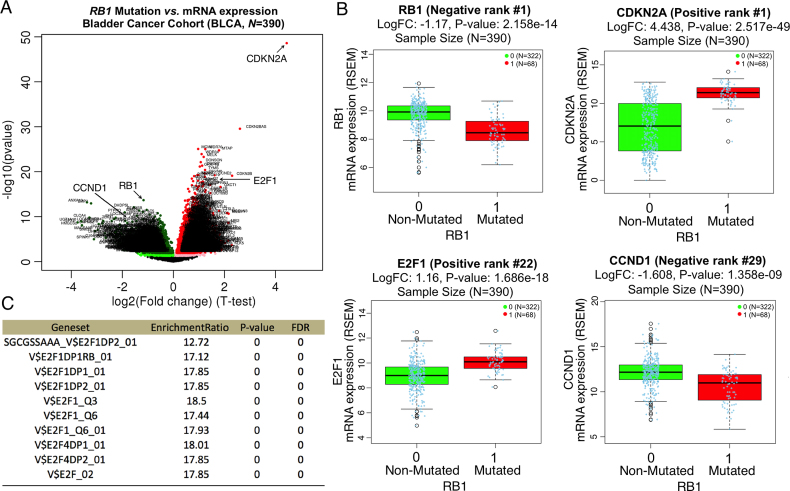
Mutation in RB1 gene is a major cause of bladder cancer with mutation frequency of 16.5% observed in the TCGA BLCA (Bladder urothelial carcinoma) cohort (11). LinkFinder was used to study the association between RB1 mutation and mRNA expression in the TCGA BLCA cohort (n = 390). As shown in the volcano plot (Figure 2A), 1518 genes (dark red dots) had significant positive correlation with RB1 mutation, whereas 1294 genes (dark green dots) had significant negative correlation (FDR<0.01, t-test followed by multiple testing correction). This result suggests a widespread impact of RB1 mutation on the transcriptome. LinkFinder also created statistical plots for individual genes. RB1 mutation showed a strong negative association with RB1 gene expression (negative rank #1, logFC[Fold Change] = –1.2, P = 2.2e–14). RB1 mutation also showed strong positive associations with CDKN2A (positive rank #1, logFC = 4.4, P = 2.5e–49) and E2F1 (positive rank #22, logFC = 1.2, P = 1.7e–18), and a strong negative association with CCND1 (negative rank #29, logFC = -1.6, P = 1.4e–9) (Figure 2B). Both CDKN2A and CCND1 mRNA expression are known to correlate with deregulation of RB1 in cancer cells and tumor samples (12). RB1 protein is also known to regulate cell cycle proteins, especially the E2F1 transcription factor (13). Using LinkInterpreter, we performed transcriptional factor target enrichment analysis for the 1518 genes with significant positive correlation with RB1 mutation (FDR < 0.01). As shown in the result table (Figure 2C), transcriptional targets of E2F1 were significantly enriched among these genes, confirming the role of RB1 mutation in regulating E2F1-mediated transcriptional program.
Figure 2.
Functional impact of RB1 mutation on mRNA expression in Bladder Cancer. (A) In the TCGA BLCA (Bladder urothelial carcinoma) cohort, 1518 genes showed significant up-regulation (dark red dots, FDR < 0.01) in RB1 mutated samples whereas 1294 genes showed significant down-regulation (dark green dots, FDR < 0.01). (B) Among the most significant genes, up-regulation was found for CDKN2A and E2F1 (positive rank #1 and #22) whereas down-regulation was found for RB1 and CCND1 (negative rank #1 and #29). (C) The 1518 up-regulated genes were significantly enriched with transcriptional targets of E2F1 (Fisher's exact test, top 10 most enriched target sets).
Impact of ERBB2 (Her2) amplification on protein phosphorylation in breast cancer
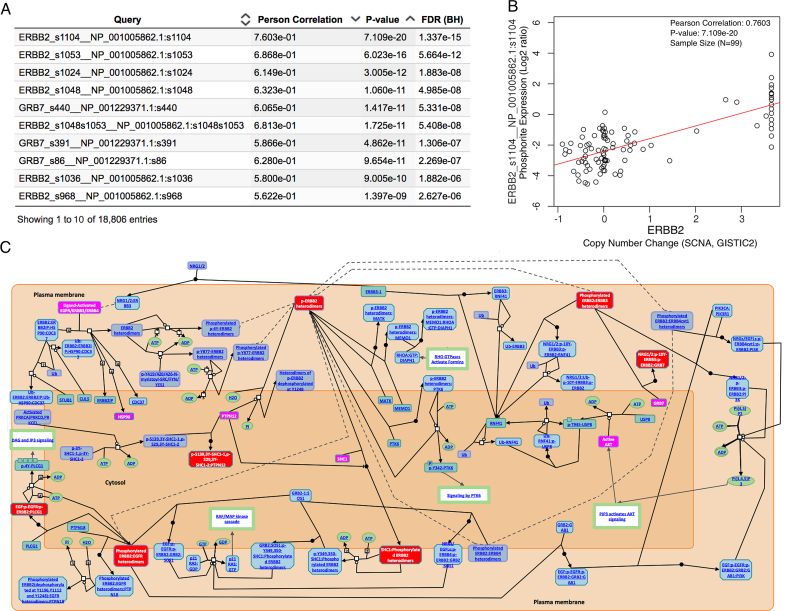
LinkFinder was used to study the association between ERBB2 amplification and protein phosphorylation in the TCGA BRCA cohort (n = 105). The table in Figure 3A shows the top 10 phosphosites having the strongest correlation with ERBB2 amplification, among which seven are from ERBB2 and 3 are from GRB7. GRB7 is one of the 105 protein coding genes located in the same amplicon as ERBB2 on chromosome 17q12. Over-phosphorylation of GRB7 in ERBB2 amplified tumors suggests its potential functional importance in Her2-positive breast cancer. In total, 15 phosphosites had significant positive correlation with ERBB2 amplification (FDR < 0.01, Pearson's correlation analysis followed by multiple testing correction). The strongest correlation was found between ERBB2 amplification and the phosphorylation level of ERBB2 protein at s1104 (Pearson's correlation = 0.76, P = 7.1e–20) (Figure 3B). Using LinkInterpreter, gene set enrichment analysis was performed for the LinkFinder results based on the Reactome pathway database. As expected, the top-ranking pathway was ‘signaling by ERBB2’, with an FDR of 0.6%. The leading edge genes included ERBB2, AKT1, GRB7, HSP90AA1, PTPN12 and SHC1. These genes and their phosphorylated protein forms are highlighted in magenta and red boxes, respectively, in the pathway diagram (Figure 3C).
Figure 3.
Impact of ERBB2 amplification on protein phosphorylation in breast cancer. (A) The top 10 phosphosites associated with ERBB2 amplification. (B) Scatter plot visualizing the association between ERBB2 amplification and the phosphosite abundance of ERBB2_s1104. (C) Increased phosphorylation was found for the ‘Signalling by ERBB2’ pathway (rank #1, FDR = 0.006, gene set enrichment analysis with Reactome pathway database). The leading edge genes and their phosphorylated protein forms are highlighted in magenta and red boxes, respectively.
Multi-omics based protein signature for poor prognosis in ovarian cancer
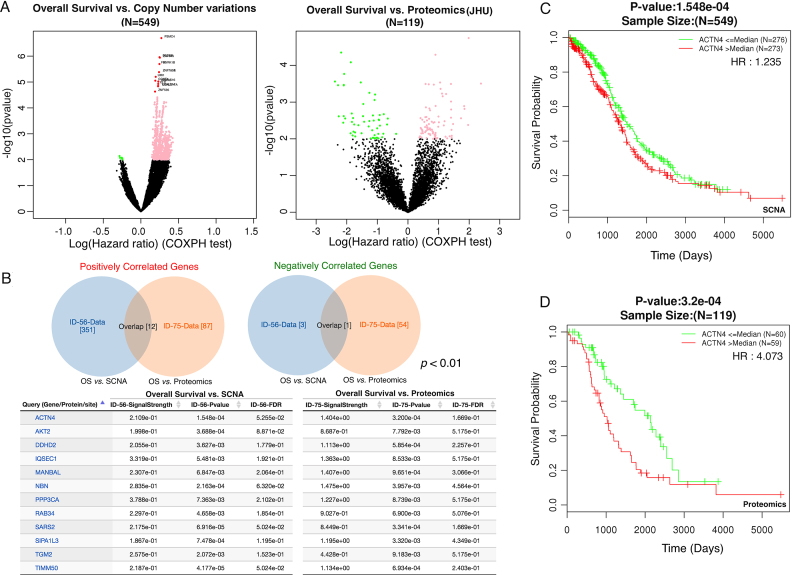
Ovarian cancer is characterized by prevalent copy number alteration and has poor prognosis (8). Because copy number alteration does not necessarily lead to concordant changes at the protein level (7,8), we integrated copy number and protein profiling data to identify candidate genes that drive poor prognosis in ovarian cancer. Based on the TCGA copy number alteration data (n = 549), LinkFinder identified 1122 genes (non-black dots) that were significantly associated with patient survival time (P < 0.01, Cox regression, Figure 4A). Similarly, 141 genes (non-black dots) were significantly associated with patient survival based on the protein profiling data (n = 119, Figure 4B). Among genes with both copy number and proteomic measurements, the Venn diagram analysis in LinkCompare identified 12 genes that were significantly associated poor prognosis and 1 gene associated with good prognosis based on both omics data types (Figure 4B). Among these genes, ACTN4 (Actinin Alpha 4) and AKT2 (AKT Serine/Threonine Kinase 2) are known poor prognosis predictors for ovarian cancer (14,15). ACTN4 is associated with the invasive phenotype in various cancers (15). Moreover, PPP3CA (Protein Phosphatase 3 Catalytic Subunit Alpha) is known to be dysregulated in advanced multiple myeloma (16) and TGM2 (Transglutaminase 2) has been associated with drug resistance and a metastatic phenotype in breast cancer (17). Figure 4C shows Kaplan–Meier survival curves for patients with above- (red) and below- (green) median ACTN4 copy number estimates (Hazard ratio [HR] = 1.235, P = 1.548e–04). Similarly, Figure 4D shows Kaplan–Meier survival curves for patients with above- (red) and below- (green) median ACTN4 protein abundance (HR = 4.073, P = 3.2e–04).
Figure 4.
Multi-omics based protein signature for poor prognosis in ovarian cancer. (A) 1122 and 141 genes were significantly associated with patient survival time based on the copy number and proteomics data, respectively (P <0.01, Cox regression). (B) The Venn diagram analysis with directional constraint identified 13 overlapping genes between the two platforms, and the 12 genes associated with poor-prognosis are shown in the table. (C) Kaplan–Meier survival curves for patients with above- (red) and below- (green) median ACTN4 copy number estimates (Hazard ratio [HR] = 1.235, P = 1.548e–04). (D) Kaplan–Meier survival curves for patients with above- (red) and below- (green) median ACTN4 protein abundance (HR = 4.073, P = 3.2e–04).
Pan-cancer analysis for survival-associated gene expression signature
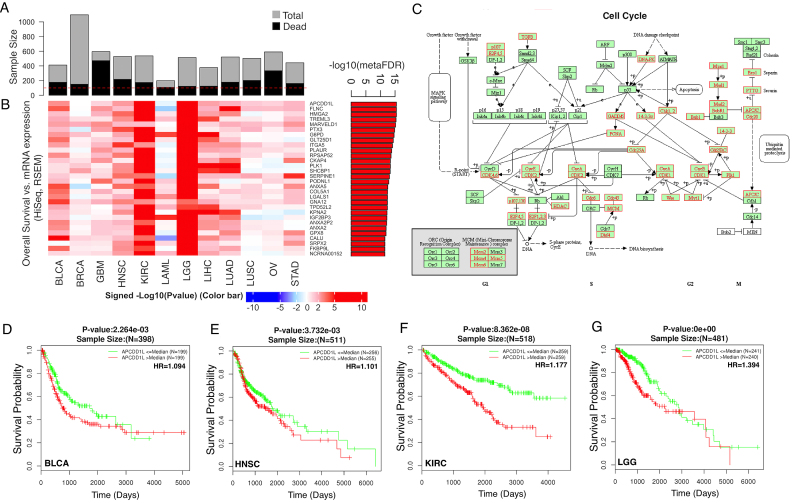
Twelve cancer types with more than 100 death events in the TCGA project were selected for the pan-cancer analysis (Figure 5A, Supplementary Table S5), including bladder urothelial carcinoma (BLCA), breast invasive carcinoma (BRCA), glioblastoma multiforme (GBM), head and neck squamous cell carcinoma (HNSC), kidney renal clear cell carcinoma (KIRC), acute myeloid leukemia (LAML), brain lower grade glioma (LGG), liver hepatocellular carcinoma (LIHC), lung adenocarcinoma (LUAD), lung squamous cell carcinoma (LUSC), ovarian serous cystadenocarcinoma (OV), and stomach adenocarcinoma (STAD). LinkFinder was applied to individual cancer types to calculate the associations between overall patient survival and gene expression using Cox regression analysis. LinkCompare was then used to integrate the P values calculated for individual cancer types using the sumz method (18) to generate a meta-P value, which was further adjusted by multiple testing correction. The top 30 and 100 most significant genes associated with increased risk are shown in the heat maps in Figure 5B and Supplementary Figure S2, respectively. These genes showed consistent trend for almost all cancer types except for the liquid cancer LAML. KEGG pathway enrichment analysis using LinkInterpreter showed that increased death risk or decreased overall survival is associated with increased expression of genes in the cell cycle (Figure 5C), DNA replication, mismatch repair, focal adhesion, ECM-receptor interaction, and N-Glycan biosynthesis pathways, and decreased expression of genes in the fatty acid degradation, oxidative phosphorylation, drug metabolism pathways (FDR<0.01). APCDD1L (APC down-regulated 1 like) is the top-ranking gene in the meta-analysis (Figure 5B), but has not been associated with cancer prognosis in previous studies. Kaplan-Meier survival curves show that patients with above- (red) and below- (green) median APCDD1L mRNA abundance had significantly different survival rates in multiple cancer types, such as BLCA (Figure 5D), HNSC (Figure 5E), KIRC (Figure 5F) and LCG (Figure 5G).
Figure 5.
Pan-cancer analysis for survival-associated gene expression signatures. (A) Twelve cancer types in the TCGA project with >100 death events. (B) The heat map shows the top 30 poor survival-associated genes. Each cell represents the signed –log10 (P-value). The right panel bar plot depicts corresponding meta-analysis based FDR. A and B share the same order of cancer types, as indicated below the heat map. (C) Increased expression of genes in the cell cycle pathway is associated with increased death risk (FDR<0.001, gene set enrichment analysis). Leading-edge genes are highlighted in red boxes in C. (D–G) Patients with above- (red) and below- (green) median APCDD1L mRNA abundance had significantly different survival rates in multiple cancer types such as bladder urothelial carcinoma (BLCA, D), head and neck squamous cell carcinoma (HNSC, E), kidney renal clear cell carcinoma (KIRC, F), and brain lower grade glioma (LGG, G).
LinkedOmics connected the novel pan-cancer poor prognosis marker APCDD1L tumor invasiveness and aggressiveness
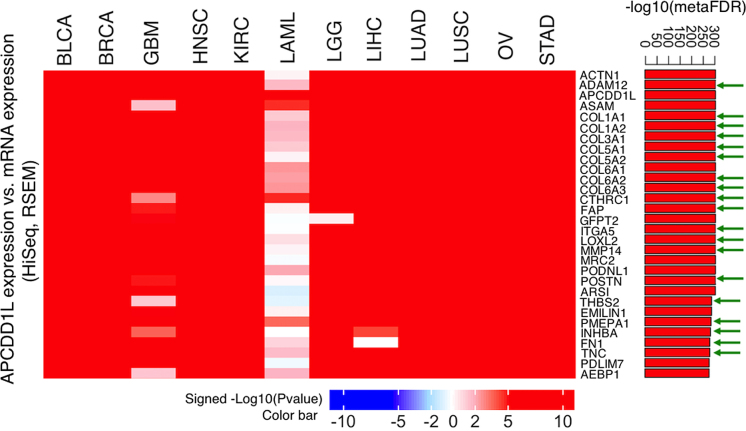
APCDD1L is the top-ranking gene in the pan-cancer survival analysis on 12 cancer types (Figure 5), however, it is an understudied gene without any Gene Ontology molecular function and biological process annotations. We performed mRNA co-expression analysis for APCDD1L in each of the 12 cancer cohorts using LinkFinder (Pearson's correlation) and then applied LinkCompare to integrate the p values calculated for individual cancer types using the sumz method (18). The top 30 and 100 genes with the highest correlation are shown in the heat maps in Figure 6 and Supplementary Figure S3, respectively. The right panel bar plots depict corresponding meta-analysis based FDRs. Interestingly, 19 out of the top 30 and 50 out of the top 100 genes (shown with green arrows) are known epithelial–mesenchymal transition (EMT) genes from the Broad MSigDB v6.0 and literature (19). GO enrichment analysis using LinkInterpreter showed that APCDD1L-correlated genes are significantly enriched in regulation of cellular response to growth factor stimulus (FDR = 4.65e–4), positive regulation of cellular component movement (FDR = 7.44e–4), blood vessel morphogenesis (FDR = 7.95e–4), and mesenchyme development (FDR = 1.56e–3). These results suggest a role of APCDD1L in biological processes associated with tumor invasiveness and aggressiveness.
Figure 6.
LinkedOmics connected the novel pan-cancer poor prognosis marker APCDD1L to biological processes associated with tumor invasiveness and aggressiveness. We performed APCDD1L mRNA co-expression analysis in each of the 12 cancer cohorts using LinkFinder (Pearson's correlation) and then integrated the p values obtained from each cancer type using LinkCompare. The top 30 most significantly correlated genes are shown in the heat map, in which each cell represents signed –log10 (P-value). The right panel bar plot depicts corresponding meta-analysis based FDR. The epithelial–mesenchymal transition (EMT) genes are shown with green arrows.
DISCUSSION
LinkedOmics is a new and unique tool in the software ecosystem for disseminating data from large-scale cancer omics projects. It uses preprocessed and normalized data from the Broad TCGA Firehose and CPTAC data portal to reduce redundant efforts. It focuses on the discovery and interpretation of attribute associations and thus complements existing cancer data portals. It has very low barrier to use because association analysis and functional enrichment analysis are the most widely-used and well-understood approaches in biomedical research, and visualization effectively helps users understand the results. A major drawback when applying association analysis to high-dimensional data is the identification of superficial and non-functional relationships. This limitation is directly addressed by the multi-omics, pan-cancer, and pathway and network analyses in the system. Although the current version of LinkedOmics includes only TCGA and CPTAC data, it can be easily extended to support other cohort-based multi-omics studies. An obvious future improvement is to allow multivariate analysis so that confounding variables can be controlled. Other future improvements include allowing users to customize query features (e.g. only loss-of-function mutations instead of all mutations), merge query features (e.g. all mutations in a pathway or all aberration types in a gene), select multiple target datasets at the same time, explore hypothesis driven relationships and create correlation networks for top-ranking genes returned by LinkFinder and LinkCompare.
AVAILABILITY
LinkedOmics is an open source portal available online (http://www.linkedomics.org).
Supplementary Material
SUPPLEMENTARY DATA
Supplementary Data are available at NAR Online.
FUNDING
National Cancer Institute (NCI) CPTAC award [U24 CA210954]; 17x058 from Leidos Biomedical Research, Inc.; Cancer Prevention & Research Institutes of Texas [CPRIT RR160027]; McNair Medical Institute at The Robert and Janice McNair Foundation. Funding for open access charge: National Cancer Institute (NCI) CPTAC award [U24 CA210954]; Cancer Prevention & Research Institutes of Texas CPRIT award [RR160027].
Conflict of interest statement. None declared.
REFERENCES
- 1. Fernandez-Banet J., Esposito A., Coffin S., Horvath I.B., Estrella H., Schefzick S., Deng S., Wang K., Aching K., Ding Y. et al. OASIS: web-based platform for exploring cancer multi-omics data. Nat. Methods. 2016; 13:9–10. [DOI] [PubMed] [Google Scholar]
- 2. Gao J., Aksoy B.A., Dogrusoz U., Dresdner G., Gross B., Sumer S.O., Sun Y., Jacobsen A., Sinha R., Larsson E. et al. Integrative analysis of complex cancer genomics and clinical profiles using the cBioPortal. Sci. Signal. 2013; 6:pl1. [DOI] [PMC free article] [PubMed] [Google Scholar]
- 3. Goldman M., Craft B., Swatloski T., Cline M., Morozova O., Diekhans M., Haussler D., Zhu J.. The UCSC Cancer Genomics Browser: update 2015. Nucleic Acids Res. 2015; 43:D812–D817. [DOI] [PMC free article] [PubMed] [Google Scholar]
- 4. Li J., Lu Y., Akbani R., Ju Z., Roebuck P.L., Liu W., Yang J.Y., Broom B.M., Verhaak R.G., Kane D.W. et al. TCPA: a resource for cancer functional proteomics data. Nat. Methods. 2013; 10:1046–1047. [DOI] [PMC free article] [PubMed] [Google Scholar]
- 5. Aran D., Sirota M., Butte A.J.. Systematic pan-cancer analysis of tumour purity. Nat. Commun. 2015; 6:8971. [DOI] [PMC free article] [PubMed] [Google Scholar]
- 6. Heng Y.J., Lester S.C., Tse G.M., Factor R.E., Allison K.H., Collins L.C., Chen Y.Y., Jensen K.C., Johnson N.B., Jeong J.C. et al. The molecular basis of breast cancer pathological phenotypes. J. Pathol. 2017; 241:375–391. [DOI] [PMC free article] [PubMed] [Google Scholar]
- 7. Zhang B., Wang J., Wang X., Zhu J., Liu Q., Shi Z., Chambers M.C., Zimmerman L.J., Shaddox K.F., Kim S. et al. Proteogenomic characterization of human colon and rectal cancer. Nature. 2014; 513:382–387. [DOI] [PMC free article] [PubMed] [Google Scholar]
- 8. Zhang H., Liu T., Zhang Z., Payne S.H., Zhang B., McDermott J.E., Zhou J.Y., Petyuk V.A., Chen L., Ray D. et al. Integrated Proteogenomic Characterization of Human High-Grade Serous Ovarian Cancer. Cell. 2016; 166:755–765. [DOI] [PMC free article] [PubMed] [Google Scholar]
- 9. Edwards N.J., Oberti M., Thangudu R.R., Cai S., McGarvey P.B., Jacob S., Madhavan S., Ketchum K.A.. The CPTAC Data Portal: a resource for cancer proteomics research. J. Proteome Res. 2015; 14:2707–2713. [DOI] [PubMed] [Google Scholar]
- 10. Wang J., Vasaikar S., Shi Z., Greer M., Zhang B.. WebGestalt 2017: a more comprehensive, powerful, flexible and interactive gene set enrichment analysis toolkit. Nucleic Acids Res. 2017; doi:10.1093/nar/gkx356. [DOI] [PMC free article] [PubMed] [Google Scholar]
- 11. Cancer Genome Atlas Research Network Comprehensive molecular characterization of urothelial bladder carcinoma. Nature. 2014; 507:315–322. [DOI] [PMC free article] [PubMed] [Google Scholar]
- 12. Mizuarai S., Machida T., Kobayashi T., Komatani H., Itadani H., Kotani H.. Expression ratio of CCND1 to CDKN2A mRNA predicts RB1 status of cultured cancer cell lines and clinical tumor samples. Mol. Cancer. 2011; 10:31. [DOI] [PMC free article] [PubMed] [Google Scholar]
- 13. Goodrich D.W. The retinoblastoma tumor-suppressor gene, the exception that proves the rule. Oncogene. 2006; 25:5233–5243. [DOI] [PMC free article] [PubMed] [Google Scholar]
- 14. Cai J., Xu L., Tang H., Yang Q., Yi X., Fang Y., Zhu Y., Wang Z.. The role of the PTEN/PI3K/Akt pathway on prognosis in epithelial ovarian cancer: a meta-analysis. Oncologist. 2014; 19:528–535. [DOI] [PMC free article] [PubMed] [Google Scholar]
- 15. Yamamoto S., Tsuda H., Honda K., Onozato K., Takano M., Tamai S., Imoto I., Inazawa J., Yamada T., Matsubara O.. Actinin-4 gene amplification in ovarian cancer: a candidate oncogene associated with poor patient prognosis and tumor chemoresistance. Mod. Pathol. 2009; 22:499–507. [DOI] [PubMed] [Google Scholar]
- 16. Imai Y., Ohta E., Takeda S., Sunamura S., Ishibashi M., Tamura H., Wang Y.H., Deguchi A., Tanaka J., Maru Y. et al. Histone deacetylase inhibitor panobinostat induces calcineurin degradation in multiple myeloma. JCI Insight. 2016; 1:e85061. [DOI] [PMC free article] [PubMed] [Google Scholar]
- 17. Oh K., Ko E., Kim H.S., Park A.K., Moon H.G., Noh D.Y., Lee D.S.. Transglutaminase 2 facilitates the distant hematogenous metastasis of breast cancer by modulating interleukin-6 in cancer cells. Breast Cancer Res. 2011; 13:R96. [DOI] [PMC free article] [PubMed] [Google Scholar]
- 18. Becker B.J. Cooper H, Hedges LV. A Handbook of Research Synthesis. 1994; NY: Russell Sage; 215–230. [Google Scholar]
- 19. Zhao M., Kong L., Liu Y., Qu H.. dbEMT: an epithelial-mesenchymal transition associated gene resource. Sci. Rep. 2015; 5:11459. [DOI] [PMC free article] [PubMed] [Google Scholar]
Associated Data
This section collects any data citations, data availability statements, or supplementary materials included in this article.


