Abstract
Since 2010, the Genomicus web server is available online at http://genomicus.biologie.ens.fr/genomicus. This graphical browser provides access to comparative genomic analyses in four different phyla (Vertebrate, Plants, Fungi, and non vertebrate Metazoans). Users can analyse genomic information from extant species, as well as ancestral gene content and gene order for vertebrates and flowering plants, in an integrated evolutionary context. New analyses and visualization tools have recently been implemented in Genomicus Vertebrate. Karyotype structures from several genomes can now be compared along an evolutionary pathway (Multi-KaryotypeView), and synteny blocks can be computed and visualized between any two genomes (PhylDiagView).
INTRODUCTION
The rapid progress in sequencing technologies correlates with a dramatic increase in genome information availability in all domains of life. The volume of genome data produced allows new kinds of evolutionary genomics questions to be tackled, but require the data to be well integrated in a comprehensive and intuitive framework. Whole genome comparative genomics especially requires both high-resolution measures (precise breakpoint positions, gene-level evolutionary rates, etc.) as well as large-scale observations (genome karyotype comparisons, chromosome synteny maps, etc) New tools are needed to meet the computational challenge raised by the volume and complexity of this data. Towards this goal, we continue to develop new graphical tools in the Genomicus server, to offer easy access to evolutionary analyses with vertebrate genomes. The aim of Genomicus is to make available to the community a fast and dynamic visualisation interface for comparative genomics. It potentially enables comparison between unlimited numbers of genomes and provides comprehensive overview of gene and genome organisation between modern species and inferred ancestral genome reconstructions.
Users can easily navigate within and between genomes to study a specific locus of interest through three axes: linearly along the positions of genes on the chromosome, transversally between different species through gene orthology properties and chronologically along an evolutionary axis.
Since our previous reports (1,2), we improved Genomicus in two aspects described here. First, Genomicus now provides access to multiple karyotype comparison tools. Entire genome structures can be compared between extant species and against their common reconstructed ancestor. Macro evolutionary events such as chromosomal fusion and/or fission can be studied through a graphical and user-friendly interface. Second, we implemented an on-line version of PhylDiag (3), a new pairwise genome comparison tool that computes conserved synteny blocks between two species (extant or ancestral).
DATA SOURCES AND ANCESTRAL GENOME INFERENCE
The data available in Genomicus Vertebrates on extant species is downloaded from the Ensembl database (4) and information on the ∼1 200 000 genes of the 70 extant species (Protein sequence, gene location, gene family and gene tree, percentage of identity between pairs of proteins and dN/dS ratio) is stored in a local MariaDB database.
From this information, we infer and compute ancestral genes content and order with the AGORA (Algorithm for Gene Order Reconstruction in Ancestor) method (5) for each Ensembl release. The ancestral genomes are reconstructed as ordered and oriented sets of genes with a range of quality, from highly contiguous chromosome-length scaffolds holding the expected number of genes to highly fragmented assemblies with few reconstructed adjacent genes, depending on the age of the ancestor and the number and topology of the branches leading to their descendent genomes. The 60 reconstructed ancestral genomes can be downloaded on the Genomicus ftp server (ftp://ftp.biologie.ens.fr/pub/dyogen/genomicus), and browsed through different graphical tools on the web interface.
GENOMICUS INTERFACE
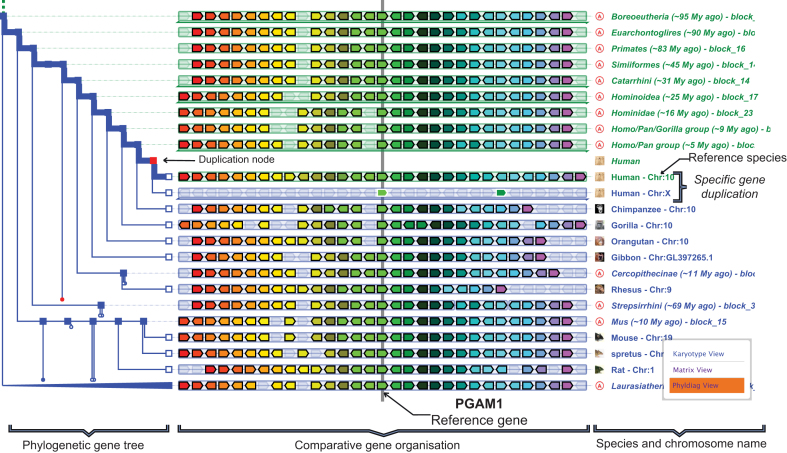
All the functionalities described in previous articles are still available (1,2).Users generally enter Genomicus with a gene name (Ensembl gene ID, HGNC gene name), a key word from a gene's functional description but also through a protein similarity search with the Blast algorithm. The server's response is by default a view of the query gene in a PhyloView display (Figure 1), which allows the user to explore the evolutionary history of the gene in the context of its genomic neighbourhood, including orthologs or paralogs defined in gene trees computed by Ensembl Compara (6,7). Switching to the AlignView interface allows users to explore the alignment of the reference genome (in the reference gene area) to other genomes. Local gene losses or gains can be detected immediately with this multi-genome representation type.
Figure 1.
PhyloView representation of the PGAM1 reference gene in the human genome. The left part is the phylogenetic tree of this reference gene. On the right, the reference gene and its homologous copies in other species are in the centre surrounded by their neighbouring genes in their respective genomes. Genes of the same colour are homologs. One can see the specific gene duplication in the human genome (duplication node in red), leading to the paralogous gene PGAM4 on the X chromosome. A right click on the name ‘Mouse - Chr:19’ produces a contextual menu that allows switching to pairwise species comparison tools (KaryotypeView, MatrixView, PhylDiagView) between the selected species (Mus musculus) and the reference one (here Homo sapiens).
By default, the colours of genes in PhyloView and AlignView are used to identify genes belonging to the same family (evolutionary tree), i.e. orthologs and paralogs. However, users can switch to a different mode, where colours now represent the degree of similarity (% protein ID) or the selective pressure (dN/dS) between genes on the display. Also, by default, genes are drawn as arrows of fixed size (schematic scale representation) but users can switch to a representation of the genes along the chromosomes in genomic coordinates, thus highlighting potential gene splits and annotation errors that become immediately visible.
To complete these two multiple genome comparison tools, Genomicus provides access to pairwise genome comparison interfaces. The KaryoView function is dedicated to karyotype painting of one genome according to the colour of the chromosome syntenic regions of a different genome. The reference or query genome can either be from extant species or from reconstructed ancestors. This tool is very useful to study karyotype evolution, while providing a global view of rearrangement positions in the form of breaks in the succession of genes along each chromosome. MatrixView is a second pairwise comparison tool, where a two-dimensional matrix of orthologous gene positions (dotplot) between two genomes, or of paralogs within the same genome, can be computed for complete genomes with the possibility to zoom on specific chromosome pairs while pinpointing genes of interest.
NEW GENOMICUS TOOLS
Multi-KaryoView comparison: how karyotypes evolve
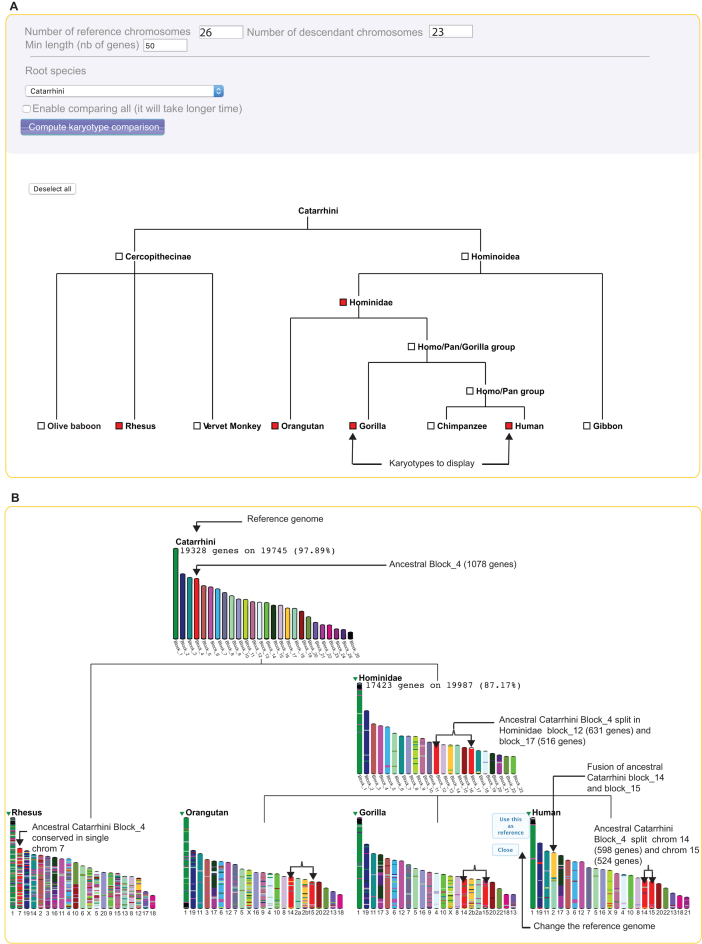
Genomicus Vertebrates stores ancestral genome reconstructions, making it feasible to follow the evolution of karyotypes through time and along branches of a species tree. We have now implemented such a tool called Multi-KaryoView that can be accessed from the classical KaryoView (In Figure 2A). Users first design the species tree of interest starting from a desired root ancestor, and selecting downstream ancestors and modern species. By default, extant genomes whose assembly are considered highly fragmented are not selectable but one can choose to display them if desired. Once extant and ancestral genomes are chosen, the ‘compute karyotype comparison’ button sends a request to the server that generates a graphical representation that interactively displays chromosome-scale synteny between the reference ancestral genome and its descendant ancestral and extant genomes. Technically, the graphics are rendered in the form of an image in PNG format inserted in an SVG container that allows javascript operability on the client side.
Figure 2.
Multi-KaryoView of the Catarrhini genome and its descendants. (A) Users can select the ‘root species’ of the species tree, and the parameters of represented karyotypes (the number of chromosomes in the reference genome, the number of chromosome in the descendant species, the minimum number of genes in chromosomes). By default, only extant species with complete chromosome-scale assemblies are selectable, but a check box is available to enable all comparisons. User can select the species and ancestors of interest to be displayed, and then compute karyotype comparisons. (B) By default the ‘reference species’ will be the root of the previous species tree (here Catarrhini). Users can toggle a switch to display statistics on reconstructed ancestral genomes. All the descendant karyotypes are coloured according to the ancestral reference Catarrhini genome. In this example, one can see that the fourth ancestral block of Catarrhini, is split in two chromosomes in the Hominidae branch of the tree, but remains in one chromosome in Rhesus. One can also see the fusion of two ancestral blocks leading to chromosome 2 in Homo sapiens. By clicking on the little green arrow near the species name, users can choose to change the ‘reference genome’.
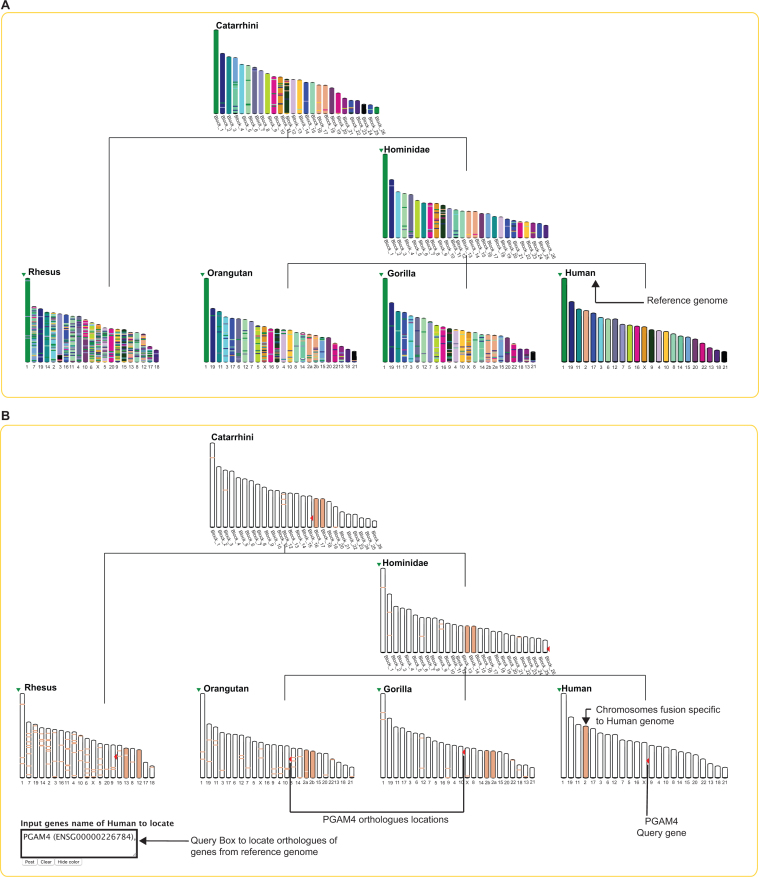
As an example, Figure 2B represents the Multi-KaryoView of the inferred Catarrhini reconstruction (here as reference genome), the selected 4 descendants species (Rhesus, Orangutan, Chimpanzee and Human), and the intermediate ancestor Hominidae (common ancestor to Human, Chimpanzee and Orangutan). The top menu of the Multi-KaryoView page gives access to representation parameters such as the number of chromosomes or ancestral blocks to be displayed, or the minimum length of chromosomes (in number of genes). Clicking on ‘Compute karyotype comparison’ generates the representation in Figure 2B, showing all the macro rearrangements that occurred in genomes through evolution, such as chromosome fission or chromosome fusion. In this example, one can see that the 4th ancestral reconstructed block of the Catarrhini genome, which is composed of 1078 protogenes, was split in two chromosomes in the Hominidae branch. This chromosome fission is specific to this branch, as the block remains complete in Rhesus. Conversely, one can identify the specific fusion between Catarrhini blocks number 15 and 16, leading to Human chromosome 2. This fusion is more easily interpretable by changing the reference genome in Multi-KaryoView (Figure 3). Choosing Human as reference genome (by selecting it on the green arrow near the genome's name) draws all the karyotypes, from ancestral and extant species, according to their homology with human chromosomes (Figure 3A). This chromosome fusion is specific to the human lineage since the two blocs remain separate in other primate species and in the intermediate ancestor Hominidae (Figure 3B).
Figure 3.
Multi-Karyoview of the Catarrhini genome and its descendants with human as reference genome. (A) The figure shows in each genome the regions homologous to human chromosomes. One can see that chromosome 2 of Homo sapiens is split in two chromosomes in other primates and in ancestral species. (B) A mouse-over on this specific chromosome will fade the other colours to highlight the chromosome of interest. When an extant species is chosen as a reference genome, a query box appears at the bottom of the page, allowing the user to locate one or more genes and orthologs on the displayed karyotypes. Here, the human PGAM4 gene is requested. One can see its location on the human X chromosome, but that its orthologs in Gorilla, Orangutan and Rhesus are on autosomes. The first interpretation of this situation could be the possible translocation of PGAM4 in Human. Figure 1 reflects that this gene has been specifically duplicated in human genome, and its paralog PGAM1 is indeed located on the X chromosome.
When an extant species is selected as reference, a query box allows users to locate genes and orthologs on the karyotypes. Figure 3B shows the location of the PGAM4 gene on the Homo sapiens karyotype and orthologs in other species (red arrows). One notices that in the human genome, the PGAM4 gene is on the X chromosome, while in other primates its ortholog PGAM1 is on an autosome. This situation reflects the retro-transposition of a copy of the PGAM1 gene to the X chromosome in the human lineage (8), leaving the parental copy on chromosome 10 and a new copy on the X chromosome (Figure 1). From the Multi-KaryoView display, users can go back to the classical pairwise KaryoView functionality by clicking on a chromosome of the species to be displayed against the reference one. This can also be done via the menu on the left, in order to switch to KaryoView, MatrixView or PhylDiag analysis.
PhylDiagView: computing and representing synteny blocks between pairs of genomes
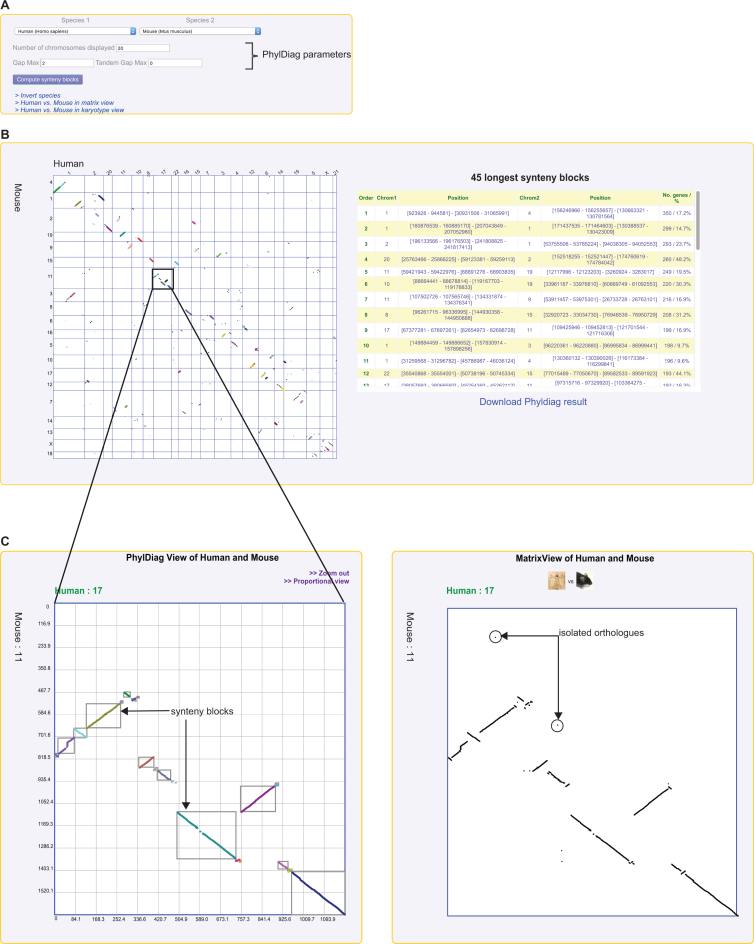
Genomicus already provides an access to whole genome pairwise comparisons with a dotplot matrix representation (MatrixView). Indeed, MatrixView relies on orthologous relationships between two species extracted from the gene trees to plot a black dot at the intersection of ortholog coordinates. This representation allows users to display a global map of conservation between two genomes, through diagonal lines representing conserved segments. However, beyond this representation, no quantification is reported on the degree of synteny conservation between genomes, nor on the positions of breakpoints between syntenic blocs. This issue is now solved by the implementation of an on-line version of the PhylDiag algorithm (7). PhylDiag is designed with the aim of providing a fast and accurate computation of syntenic blocks between any two genomes using the fewest possible arbitrary user-defined parameters. In brief, after reducing the two genomes to their set of shared orthologs (genes inherited from their last common ancestor), it first resolves cases of tandem duplications using a ‘TandemGapMax’ parameter, which controls the number of genes that a user tolerates between any two duplicated genes to still call them ‘tandem’ duplicates (TandemGapMax = 0 means strictly adjacent). Next, the orthology matrix is explored to identify sets of conserved gene order and orientation. A GapMax parameters allows users to control the number of genes to tolerate between any two conserved orthologs to still consider their inclusion in the same syntenic block. Hence, a GapMax = 0 means that strict conserved segments unbroken during evolution will be identified, and all the edges of these segments will be breakpoints. Increasing this parameter allows a more permissive identification of syntenic blocks. PhylDiagView is available from the main page of Genomicus, and from the different multi-genome comparison tools. For example, from the display in Figure 1 that shows the strong conservation of the PGAM1 human gene locus between species descending from Amniota, users may want to explore the genome-wide conservation between two specific genomes. To explore the synteny conservation between the human genome (here as reference) and another genome of interest, users can ‘right click’ on the latter to switch to a pairwise genome comparison tool (KaryoView, MatrixView or PhylDiagView). Figure 4 shows the difference between the traditional MatrixView and the new PhylDiagView representations. By default, PhyDiagView will compute synteny blocks using default parameters (GapMax = 2 and TandemGapMax = 0) although these can be modified in the top panel, as well as the number of chromosomes to display (Figure 4A). The synteny map is interactive: by clicking on specific region of the matrix map, a zoom-in will focus on that pairwise chromosome comparison (Figure 4B). The ordered list of the 45 longest synteny blocks (with information on genome location and on the number of gene in each block) is available in a table on the right part of the page. In this table, clicking on a block will highlight it in the matrix. The full list of blocks can also be downloaded as text file for further analyses.
Figure 4.
PhylDiagView of Homo sapiens versus Mus musculus. (A) the top panel of the PhylDiag View module allows the user to choose the two species (extant or ancestral) to be compared. Different PhylDiag parameters are also available such as the number of chromosomes to be displayed, the maximum gap and tandem gap allowed in a synteny block. (B) The result of the computation will plot the synteny blocks between the two selected species, each in a different colour. A table of the 45 longest blocks sorted by size is available with positions and length properties. A mouse-over on a block in the table will highlight it in the dotplot matrix. Users can download a text file of the results of the comparison. (C) A zoom-in is available when clicking in a specific part of the matrix. In this example, one can see the difference between the two representations of pairwise comparisons with PhylDiagView and MatrixView. In the PhylDiagView display, only genes belonging to individual synteny blocks adhering to user-defined parameters are shown. In contrast, in the MatrixView display, all the orthologs between the two selected species are shown, including isolated singletons.
GENOMICUS SOFTWARE IMPLEMENTATION
Genomicus is composed of Perl (version 5.22) scripts and modules, along side with Python (version 2.7) libraries from other projects of Dyogen (LibsDyogen, PhylDiag) for new functionalities, executed with mod_perl on an Apache2 (version 2.4) server and querying a MariaDB (version 10.0.31) database. The web server is running on an Ubuntu server 16.04. The pages embed inline-SVG drawings in XHTML while the JavaScript (version 1.9.1) usage is limited to an information panel retrieved with AJAX calls. The interface is optimized for Firefox and Chrome navigators but it also runs on Safari and Internet Explorer. The source codes of Genomicus and the MariaDB schema can be obtained upon request by email.
FUTURE PLANS
At the present time, the major display improvements are available on the main Genomicus server dedicated to vertebrates. Future releases of GenomicusPlants, GenomicusMetazoa and GenomicusProtist will benefit from this new version of the code.
ACKNOWLEDGEMENTS
We wish to thank the IT team of IBENS for assistance with computer systems administration, numerous users for feed-back and proposal of developments on the Genomicus interface, and the Ensembl and Ensembl Genome projects for providing integrated comparative genomic data to the community.
FUNDING
French Government and implemented by ANR [ANR-10-BINF-01-03, ANR-10-LABX-54 MEMOLIFE, ANR-10-IDEX-0001-02 PSL* Research University]; RENABI-IFB programme [ANR-11-INSB-0013]. Funding for open access charge: CNRS [UMR8197]
Conflict of interest statement. None declared.
REFERENCES
- 1. Louis A., Muffato M., Roest Crollius H.. Genomicus: five genome browsers for comparative genomics in eukaryota. Nucleic Acids Res. 2013; 41:D700–D705. [DOI] [PMC free article] [PubMed] [Google Scholar]
- 2. Louis A., Nguyen N.T.T., Muffato M., Roest Crollius H.. Genomicus update 2015: KaryoView and MatrixView provide a genome-wide perspective to multispecies comparative genomics. Nucleic Acids Res. 2014; 43:D682–D689. [DOI] [PMC free article] [PubMed] [Google Scholar]
- 3. Lucas J.M., Roest Crollius H.. High precision detection of conserved segments from synteny blocks. PLoS ONE. 2017; 12:e0180198. [DOI] [PMC free article] [PubMed] [Google Scholar]
- 4. Kersey P.J., Allen J.E., Armean I., Boddu S., Bolt B.J., Carvalho-Silva D., Christensen M., Davis P., Falin L.J., Grabmueller C. et al. Ensembl Genomes 2016: more genomes, more complexity. Nucleic Acids Res. 2016; 44:D574–D580. [DOI] [PMC free article] [PubMed] [Google Scholar]
- 5. Muffato M. Reconstruction de génomes ancestraux chez les vertébrés. 2010; https://tel.archives-ouvertes.fr/tel-00552138/.
- 6. Vilella A.J., Severin J., Ureta-Vidal A., Heng L., Durbin R., Birney E.. EnsemblCompara GeneTrees: complete, duplication-aware phylogenetic trees in vertebrates. Genome Res. 2009; 19:327–335. [DOI] [PMC free article] [PubMed] [Google Scholar]
- 7. Herrero J., Muffato M., Beal K., Fitzgerald S., Gordon L., Pignatelli M., Vilella A.J., Searle S.M.J., Amode R., Brent S. et al. Ensembl comparative genomics resources. Database (Oxford). 2016; 2016:bav096. [DOI] [PMC free article] [PubMed] [Google Scholar]
- 8. Okuda H., Tsujimura A., Irie S., Yamamoto K., Fukuhara S., Matsuoka Y., Takao T., Miyagawa Y., Nonomura N., Wada M. et al. A single nucleotide polymorphism within the novel sex-linked testis-specific retrotransposed PGAM4 gene influences human male fertility. PLoS ONE. 2012; 7:e35195. [DOI] [PMC free article] [PubMed] [Google Scholar]


