


Abstract
The abundance of high-quality genotype and phenotype data for the model organism Arabidopsis thaliana enables scientists to study the genetic architecture of many complex traits at an unprecedented level of detail using genome-wide association studies (GWAS). GWAS have been a great success in A. thaliana and many SNP-trait associations have been published. With the AraGWAS Catalog (https://aragwas.1001genomes.org) we provide a publicly available, manually curated and standardized GWAS catalog for all publicly available phenotypes from the central A. thaliana phenotype repository, AraPheno. All GWAS have been recomputed on the latest imputed genotype release of the 1001 Genomes Consortium using a standardized GWAS pipeline to ensure comparability between results. The catalog includes currently 167 phenotypes and more than 222 000 SNP-trait associations with P < 10−4, of which 3887 are significantly associated using permutation-based thresholds. The AraGWAS Catalog can be accessed via a modern web-interface and provides various features to easily access, download and visualize the results and summary statistics across GWAS.
INTRODUCTION
Genome-wide association studies (GWAS) have become an indispensable tool for elucidating genotype–phenotype relationships. GWAS correlates genomic markers with phenotypic differences in a population and reports the likelihood of the association (for a more detailed description see e.g. (1)). A plethora of significant associations have been reported for many traits in different organisms, including rice (2), tomatoes (3), fruit flies (4), mice (5), humans (6,7) and Arabidopsis (8). The latter, Arabidopsis thaliana, is the prime model system in plant biology (9) and an excellent species for conducting genome-wide association studies: many different phenotypes ranging from flowering time to ion concentrations or disease resistance have been collected (8,10–13). Arabidopsis thaliana is a natural inbred, which means that all lines have nearly complete homozygous genomes. This enables the collection of many different phenotypes of genetically identical plants, as well as a re-analysis of the phenotypes with updated genotypic data. To structure this wealth of phenotypic data, we recently published AraPheno, a database for phenotypes collected in A. thaliana (14). Here, we take the next important step by creating the AraGWAS catalog, a central resource for all genetic associations found through GWAS in A. thaliana. Its purpose is to report the respective GWAS results in a comprehensible way and make them accessible by the community, similar to the NHGRI-EBI GWAS Catalog in humans (15,16). GWAS in A. thaliana have been routinely performed using 214 000 markers generated with hybridization technology (17). Nowadays, full genome information for over 1000 different natural inbred lines is available (13). To enable a comparative analysis between GWAS results, we re-calculated all GWAS for the available phenotypes from AraPheno using a best-practice pipeline and the latest available version of the genotype data. To declare a threshold for significant association, we used a permutation-based threshold that takes the phenotypic distribution into account and differs for different phenotypes. The outcome is a catalog of standardized GWAS results for all A. thaliana phenotypes.
To summarize, A. thaliana provides one of the best and most extensive collections of population scale phenotype and genotype data, which facilitates the use of GWAS. To make the rapidly growing amount of GWAS results available for the community and to prevent the GWAS results from being fragmented across different websites, we created the AraGWAS Catalog. This resource will not only be an assortment of different GWAS results, but ensures that all results have been calculated with a standardized pipeline using the identical release of genomic data. This framework will easily promote comparative analyses across different phenotypes.
DATABASE CONTENT AND USAGE
The AraGWAS Catalog is a publicly available and manually curated database for standardized GWAS results for the model organism A. thaliana. The primary purpose of the AraGWAS Catalog is to provide a comprehensive collection and overview of all SNP-trait associations in A. thaliana. GWAS stored in the AraGWAS Catalog have been recomputed using a standardized GWAS pipeline (see section ‘Standardized GWAS Pipeline’) using fully imputed genotype data for 2029 A. thaliana lines from the 1001 Genomes Consortium (13) and all publicly available phenotypes from the central A. thaliana phenotype repository, AraPheno (14). The AraGWAS Catalog will be updated regularly, either when new phenotypes are submitted to the AraPheno database or when new improved genotypes are released (13). The catalog will only contain recomputed associations based on our standardized GWAS pipeline to ensure maximum comparability between different traits and experiments. Table 1 provides a detailed overview of the data stored in the catalog. To account for different phenotypic distributions, permutation-based significance thresholds are computed and reported for every phenotype in the catalog.
Table 1. AraGWAS Catalog data content and summary statistics as of 15 September 2017.
| Data content | Data statistics | |
|---|---|---|
| General statistics | ||
| Studies | 167 | |
| Sig. SNP-Trait Associations at P < 10−4 | 222 983 (1 197 588) | |
| Sig. SNP-Trait Associations at Bonferroni threshold | 9527 (133 017) | |
| Sig. SNP-Trait Associations at permutation-based threshold | 3887 (28 003) | |
| Top 10 genes with most sig. associations | ||
| Gene | Short description | N hits |
| AT4G02850 | Phenazine biosynthesis PhzC/PhzF family protein | 176 |
| AT4G02930 | GTP binding Elongation factor Tu family protein | 172 |
| AT4G02830 | hypothetical protein | 97 |
| AT4G02790 | GTP-binding family protein | 87 |
| AT1G12230 | Aldolase superfamily protein | 84 |
| AT4G02800 | GRIP/coiled-coil protein | 73 |
| AT4G02920 | hypothetical protein | 70 |
| AT1G12210 | RPS5-like 1 | 69 |
| AT5G63200 | tetratricopeptide repeat (TPR)-containing protein | 62 |
| AT4G02860 | Phenazine biosynthesis PhzC/PhzF protein | 57 |
Numbers of associated hits are filtered by minor allele count (MAC) > 5. Numbers in parenthesis include all markers without filtering for allele count. The number of associated loci per gene are extracted from the ‘Top Genes’ table and are based on permutation-based thresholds and MAC > 5 (https://aragwas.1001genomes.org/#/top-genes).
Various data-centric views are implemented so that users can obtain details about the data stored in the catalog.
The ‘GWAS Hitmap’ provides a high level overview of the highest associated hits of different regions along one of the five chromosomes (Figure 1). The columns of the interactive hitmap illustrate the five chromosome of A. thaliana, while each of the rows is an individual study/phenotype. Each single dot of the 25 dots per chromosome illustrates the top associated hit within the focal region of the chromosome. Regions are created using a sliding window with a 250 kbp size. The color of the dot highlights the strength of the association, where red is more strongly associated than yellow. The histogram at the top of each chromosome column shows the genome position based distribution of the top associated hits per region for the focal chromosome. This high level view should help users to quickly gain an overview about the associated hits and their distribution within and between chromosomes. We plan to enhance this view with more advanced interactions, so that users can order phenotypes by ontologies or correlations. This might help to detect interesting patterns across studies and chromosomes and thus help identify pleiotropic effects.
Figure 1.

The HitMap is a detailed GWAS heatmap illustrating the 25 top associated hits per chromosomal region and phenotype. Each column represents a chromosome and each row a phenotype/study. Regions in each chromosome are created using a sliding window with a 250 kbp size. Each dot illustrates the top associated hit within the focal region. The color (yellow to red) indicates of the strength of the association.
In the ‘Top Associations’ view users can obtain a list of all associated hits (P < 10−4) across all GWA studies and traits stored in the catalog. Associations in that table are linked to additional information, such as variant annotations generated using SnpEff (18). Different filters are provided to filter the list by different minor allele frequencies (MAF), minor allele counts (MAC), chromosomes or variant annotations (e.g. non-synonymous variants). Each entry in the ‘Top Association’ table contains links to detailed views about the study, phenotype or the gene the associated variant was found in.
The ‘Top Genes’ view summaries all associated hits detected in genes (or in close proximity to genes) and groups the results by gene name. Additional information about the genes can be obtained by clicking on the gene name, which redirects the user to a gene centric view. Dynamic visualizations, such as filtered Manhattan plots and gene location plots (Figure 2) help users to explore the region around the focal gene and provide detailed information about annotations from SnpEff (18) or gene descriptions (extracted from the TAIR10 GFF3 file from the TAIR resource http://www.arabidopsis.org/download). Further, the gene centric view provides a set of different filters to narrow down the information about variants found within or in close proximity to the focal gene.
Figure 2.

Screenshot of the gene centric view. The Manhattan plot shows all associated variants for the focal region and all available traits. Further, gene locations are displayed at the bottom with interactive elements. Detailed gene descriptions are available when hovering with the cursor over a certain gene (https://aragwas.1001genomes.org/#/gene/AT2G22540).
The ‘GWA Studies’ view provides a table of all available GWA studies, including phenotype descriptions and phenotype ontologies (https://bioportal.bioontology.org/ontologies/PTO?p=summary), sorted according to the number of significantly associated hits above the permutation-based threshold. Phenotype ontologies provide a controlled vocabulary to describe phenotypic traits in plants and enables functional grouping of different phenotypes. Phenotypic and trait ontology information is automatically fetched from the AraPheno database using the REST API of AraPheno (14). The GWA study table is sortable and provides a link to the detailed ‘Study’ view. More detailed information about a specific GWA study can be obtained by clicking on the study name. The detailed study view summaries general information about the performed GWAS (Figure 3A), such as the phenotype used for the study (including a link to the original publication and to AraPheno, where the phenotype data and metadata can be found), the genotype version, number of samples, as well as summary statistics (Figure 3B) and the associated hits (Figure 3C). Again, different filtering options are implement to filter the list of associated hits (Figure 3D). Interactive Manhattan plots are rendered in a separate tab of the GWAS view. Users who click on a specific point in the Manhattan plot will be redirected to the ‘Detailed Gene’ view described above.
Figure 3.

Screenshot of detailed study view. (A) Brief description about study related information with links to the phenotype and publication. (B) Various summary statistics about SNP type, impact, annotation and MAF. (C) Sorted list of associated markers and (D) various filters to narrow down the list of associated hits.
The AraGWAS Catalog provides access to a detailed FAQ, tutorials and guided tours that should help novice users to familiarize themselves. AraGWAS is hosted under the 1001 Genomes Organization (http://1001genomes.org), and its framework is available as open source (see ‘Implementation’ section).
STANDARDIZED GWAS PIPELINE
GWAS is being performed on all phenotypes in the AraPheno database separately. For the analysis, the untransformed mean values for each genotype have been used. For the genotype data, the latest version from the 1001 genomes project have been used. Combining these data with existing SNP chip data (17) we obtained a SNP-Matrix for 2029 accessions on 10 709 466 segregating markers. Missing data have been imputed using BEAGLE v.3.0 (19) with standard parameters. GWAS were performed using a mixed model correcting for population structure in a two-step procedure: first all markers were analyzed using a fast approximation of the mixed model (EMMAX, 20). Second, the top 100 markers where re-analyzed using the full model (EMMA, 21). The kinship matrix has been pre-calculated using all accessions, removing alleles with a minor allele frequency below 5%. The R scripts used to perform GWAS are available at https://github.com/arthurkorte/GWAS. The genotype data are available at www.1001genomes.org. To obtain the permutation-based threshold for individual phenotypes, the phenotypic data have been permuted to keep the data structure, but loose the genotype–phenotype connection. We reported the 5% permutation-based threshold per trait. This procedure provides a more realistic significance threshold which depends on the phenotypic distribution. It is noteworthy, that this procedure will lead to different significant thresholds for the different traits, where the permutation-based threshold is sometimes more and sometimes less stringent than the classical Bonferroni threshold. An example of the first, where the permutation-based threshold leads to fewer associations, is the phenotype ‘YEL’ (https://aragwas.1001genomes.org/#/study/28, published in (8)). Here, the yellowing of the leaves—as an indicator of chlorosis—has been measured. The phenotypic values are binary and zero-inflated (https://arapheno.1001genomes.org/phenotype/28/), which is a scenario that is prone to inflated P-values in the analysis. The very low value of the permutation-based threshold reflects this and, despite the inflated P-values, makes it possible to identify significant associations. An example for the latter case, where the permutation-based threshold reports more significant associations than the classical Bonferroni threshold is the analysis of the calcium concentration in the leaves (https://aragwas.1001genomes.org/#/study/51, published in (8)). Here, the phenotypic values are nicely distributed (https://arapheno.1001genomes.org/phenotype/51), and the Bonferroni threshold reports an overly stringent threshold. It is important to take the different thresholds into account if one is interested in a gene-centric analysis across studies (compare the score and significance of markers in Figure 2). In sum, over all studies, the number of significant association under a permutation-based threshold is markedly reduced compared to the number of significant association using Bonferroni threshold (see Table 1). However, the use of our standardized pipeline might lead to false negative associations as well, especially if the original analyses have been performed with different genotype data or different GWAS approaches (for example, transformation of the phenotype or multivariate models). Still, the use of our standardized pipeline enables comparative analyses of the results, which would be problematic otherwise.
IMPLEMENTATION
The frontend and backend of the AraGWAS Catalog are based on modern web-based technologies. The web-application frontend is based on HTML5 and Javascript and is a fully functional single-page application (SPA) relying on the open-source Vue.js framework (https://vuejs.org/) and enriched with data visualization libraries such as the open-source D3.js (https://d3js.org) and google charts (https://developers.google.com/chart/), developed by Google. To enable a more user-friendly interface and a smoother user experience, the Material Design system (https://material.io/), originally developed by Google, was used via a semantic component open-source framework (https://vuetifyjs.com/).
The backend consists of two databases linked by Django (https://www.djangoproject.com/), a popular open-source framework based on Python. The two databases in the backend of the AraGWAS Catalog can be accessed through a RESTful API, as described in the REST documentation of the web-application (https://aragwas.1001genomes.org/docs/).
The first database stores phenotypes and studies information in a Relational Database Management System (RDBMS). The second database indexes genes and associations and is based on the elasticsearch engine (https://www.elastic.co/), an extremely fast open-source search engine that allows for quick retrieval of a large number of associations.
The REST endpoints are accessible thanks to Django REST framework (http://www.django-rest-framework.org/), an open-source toolkit based on Django and to elasticsearch-dsl (https://elasticsearch-dsl.readthedocs.io/), an open-source library for high-level elasticsearch queries from Python.
The AraGWAS Catalog is automatically deployed using docker (https://www.docker.com), an open-source and popular software containerization platform coupled with Jenkins (https://jenkins.io/), an open-source automation server that deploys the latest version of the website directly from GitHub.
The code for AraGWAS Catalog is open-source and freely available on GitHub (https://github.com/1001genomes/AraGWAS).
ACCESSIBILITY AND CITABILITY OF DATA IN THE ARAGWAS CATALOG
The AraGWAS Catalog provides a Representational State Transfer (REST) web service that allows users to programmatically query and access data from the AraGWAS Catalog. The REST API endpoints are language-independent and can be accessed via URL extensions. In addition, we also support Core API, a robust and intuitive way to interact with the REST endpoints using machine readable schemas (http://www.django-rest-framework.org/tutorial/7-schemas-and-client-libraries/). Using the REST endpoints, users can directly obtain data for their custom offline analyses, such as associated hits for a specific gene or details of a GWA study in JSON format. A rich set of various filters allows users to directly access certain information without the need to download entire datasets. For any users who are interested in accessing the AraGWAS REST endpoints from their custom web-service, we can grant access to our REST API for their domains upon request. A thorough documentation on how to use these endpoints is provided in the online FAQ (https://aragwas.1001genomes.org/#/faq) and the REST documentation (https://aragwas.1001genomes.org/docs/). Some examples of how to use the REST interface are provided below.
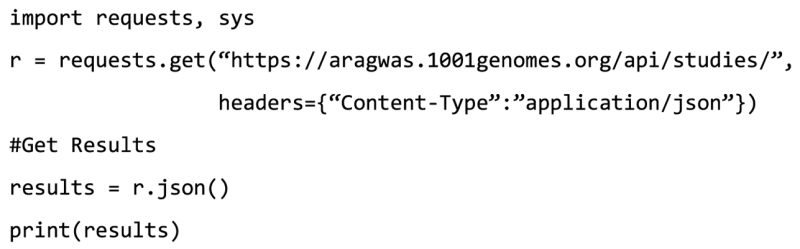
Example 1: Users can use the following URL to obtain a list of all available studies in JSON format using their custom browser:
https://aragwas.1001genomes.org/api/studies/
The same result can also be obtained using the following command line command:
$:> curl https://aragwas.1001genomes.org/api/studies/
In addition, the programming language Python can be used:
Example 2: To search the AraGWAS Catalog for flowering related studies or phenotypes, users can visit the following URL:
https://aragwas.1001genomes.org/api/search/search_results/flowering/
The final parameter can be replaced with any query term, such as the name of gene:
https://aragwas.1001genomes.org/api/search/search_results/AT4G02760/
or the PubMed ID of a publication:
https://aragwas.1001genomes.org/api/search/search_results/PMC3023908/
Example 3: Several filters are available that can be added to URLs to narrow down the search space. For example, if a user who would like to obtain a list of all significantly non-synonymous associated SNPs for chromosome 1 and 2 can use the following URL:
https://aragwas.1001genomes.org/api/associations/?chr=1&chr=2&significant=p&annotation=ns
To add filters, users must extend the URL with a ‘?’ followed by the individual filters, which are separated using the ‘&’ sign. In our example we added ‘chr = 1&chr = 2’ to restrict the search space to chromosome 1 and 2. The parameter ‘significant = p’ indicates that we are only interested in significantly associated hits after multiple hypothesis correction using permutation-based thresholds. The final parameter, ‘annotation = ns’, indicates that only non-synonymous SNPs should be returned. All filters and its options can be found in the online FAQ (https://aragwas.1001genomes.org/#/faq).
In addition to the REST endpoints, data from the AraGWAS Catalog are also downloadable through the web-interface. Entire study results (i.e. summary statistics) are available in HDF5 format. Filtered lists with associated positions per study or gene can be download in CSV format.
Phenotypes used for GWAS in the AraGWAS Catalog are linked to the AraPheno database (14), as well as to the original publication in which the phenotype was published for the first time. This way users can easily find detailed information about the linked phenotype, the original publication, as well as options to download the phenotypic data in various formats directly from AraPheno (see (14)).
To enable the citability of individual GWAS results from the AraGWAS Catalog, we provide DOIs for all recomputed GWA studies, similar to what is done in AraPheno (14).
CONCLUSIONS AND FUTURE DIRECTIONS
The AraGWAS Catalog is the first comprehensive, manually curated and standardized database to collect the results of GWAS. This database is not only an important and useful resource for the Arabidopsis community, but sets a standard for other species. The public availability of high-quality genotypes and phenotypes in A. thaliana offers—due to the inbred nature of the plant—a unique opportunity to systematically re-compute and analyze the GWAS results using a best-practice pipeline. It enables researchers to analyze and compare standardized results of GWAS on different or related traits. These so-called horizontal GWAS analyses affords unique opportunities to detect seemingly unrelated functions of a gene due to pleiotropic effects or discover traits with a shared genetic basis. For this purpose, the AraGWAS Catalog provides a selection of different methods to facilitate the exploration of these high dimensional data. The catalog offers a sophisticated and fast search API to query the database and to extract information for specific associations, genes or traits. Interactive visualizations empower the user to easily maneuver the data and uncover interesting patterns. Persistent DOIs support unique referencing of GWAS results from the AraGWAS Catalog.
However, one must note that SNP-trait associations in the AraGWAS Catalog might differ from the original publication in which the results have been reported. This has several reasons: SNP-trait associations in the AraGWAS Catalog are based (i) on a standardized ‘best practice’ GWAS pipeline and (ii) on a newly imputed genotype release, combining the latest version from the 1001 Genomes Project (13) and the SNP chip data from (17), leading to a SNP-Matrix for 2029 accessions on 10 709 466 segregating markers. It is important to stretch that this procedure enables more reliable results and comparable downstream analyses and should not be considered as disrespect of previously published works.
So far, more than 167 traits and 222 000 SNP-trait associations have been integrated into the AraGWAS Catalog, and it will be updated regularly, either when new phenotypes are submitted to AraPheno (14) or when new genotypes are released by the 1001 Genomes Consortium. To keep track of changes of SNP-trait associations between genotype versions, we plan to integrate a versioning system, by means of which scientists can clearly distinguish between different versions and releases of the AraGWAS Catalog. In the future we plan to extend the catalog with novel methods to facilitate the comparison of GWAS results stored in AraGWAS. Although, this is already possible to some extent in the multi-species cloud platform easyGWAS (20), in the AraGWAS Catalog it will be tailored toward A. thaliana to provide a maximum degree of comparability and to leverage specific A. thaliana resources and information, which might not be available for other species.
For AraGWAS, a permutation-based standardized GWAS pipeline has been used to compute univariate associations using a linear mixed model (21,22) on dichotomous and continuous traits. However, recent advances in machine learning make it possible for the first time to also use generalized linear mixed models for dichotomous traits (23), which we plan to include into future releases of AraGWAS. In addition to the results of univariate GWAS, we also plan to include SNP-trait associations from multi-locus GWAS (24–26) and multi-trait GWAS (27,28). Despite the recent advances in these fields, generating these results still is a computationally intensive task, especially if re-computations have to be done on a regular basis (e.g. when new genotypes are released).
Furthermore, we would like to extend the AraGWAS catalog in the future to also include GWAS results based on hybrid A. thaliana lines and phenotypes (29), as well as results using other types of structural variants or methylated sites (30).
ACKNOWLEDGEMENTS
We thank the members of the 1001 Genomes Consortium for their insights and discussion.
Footnotes
FUNDING
Funding from the ERC [MAXMAP to M.N.; IMMUNEMESIS to D.W.]; Austrian Science Fund and DFG [SPP ADAPTOMICS to M.N., D.W.]; Austrian Academy of Sciences ( to M.N.); Max Planck Society (to D.W.). Funding for open access charge: German Research Foundation (DFG); University of Wuerzburg.
Conflict of interest statement. K.M.B. and D.W. are shareholders of Computomics GmbH. J.F. is an employee of Tropic IT Limited. No other conflict of interest is declared.
REFERENCES
- 1. Korte A., Farlow A.. The advantages and limitations of trait analysis with GWAS: a review. Plant Methods. 2013; 9:29. [DOI] [PMC free article] [PubMed] [Google Scholar]
- 2. Zhao K., Tung C.W., Eizenga G.C., Wright M.H., Ali M.L., Price A.H., Norton G.J., Islam M.R., Reynolds A., Mezey J. et al. Genome-wide association mapping reveals a rich genetic architecture of complex traits in Oryza sativa. Nat. Commun. 2011; 2:467. [DOI] [PMC free article] [PubMed] [Google Scholar]
- 3. Lin T., Zhu G., Zhang J., Xu X., Yu Q., Zheng Z., Zhang Z., Lun Y., Li S., Wang X. et al. Genomic analyses provide insights into the history of tomato breeding. Nat. Genet. 2014; 46:1220–1226. [DOI] [PubMed] [Google Scholar]
- 4. Mackay T.F., Richards S., Stone E.A., Barbadilla A., Ayroles J.F., Zhu D., Casillas S., Han Y., Magwire M.M., Cridland J.M. et al. The Drosophila melanogaster genetic reference panel. Nature. 2012; 482:173–178. [DOI] [PMC free article] [PubMed] [Google Scholar]
- 5. Kirby A., Kang H.M., Wade C.M., Cotsapas C., Kostem E., Han B., Furlotte N., Kang E.Y., Rivas M., Bogue M.A. et al. Fine mapping in 94 inbred mouse strains using a high-density haplotype resource. Genetics. 2010; 185:1081–1095. [DOI] [PMC free article] [PubMed] [Google Scholar]
- 6. Scott L.J., Mohlke K.L., Bonnycastle L.L., Willer C.J., Li Y., Duren W.L., Erdos M.R., Stringham H.M., Chines P.S., Jackson A.U. et al. A genome-wide association study of type 2 diabetes in Finns detects multiple susceptibility variants. Science. 2007; 316:1341–1345. [DOI] [PMC free article] [PubMed] [Google Scholar]
- 7. Freilinger T., Anttila V., de Vries B., Malik R., Kallela M., Terwindt G.M., Pozo-Rosich P., Winsvold B., Nyholt D.R., van Oosterhout W.P. et al. Genome-wide association analysis identifies susceptibility loci for migraine without aura. Nat. Genet. 2012; 44:777–782. [DOI] [PMC free article] [PubMed] [Google Scholar]
- 8. Atwell S., Huang Y.S., Vilhjálmsson B.J., Willems G., Horton M., Li Y., Meng D., Platt A., Tarone A.M., Hu T.T. et al. Genome-wide association study of 107 phenotypes in a common set of Arabidopsis thaliana inbred lines. Nature. 2010; 465:627–631. [DOI] [PMC free article] [PubMed] [Google Scholar]
- 9. Provart N.J., Alonso J., Assmann S.M., Bergmann D., Brady S.M., Brkljacic J., Browse J., Chapple C., Colot V., Cutler S. et al. 50 years of Arabidopsis research: highlights and future directions. New Phytol. 2016; 209:921–944. [DOI] [PubMed] [Google Scholar]
- 10. Li Y., Huang Y., Bergelson J., Nordborg M., Borevitz J.O.. Association mapping of local climate-sensitive quantitative trait loci in Arabidopsis thaliana. Proc. Natl. Acad. Sci. U.S.A. 2010; 107:21199–21204. [DOI] [PMC free article] [PubMed] [Google Scholar]
- 11. Meijón M., Satbhai S.B., Tsuchimatsu T., Busch W.. Genome-wide association study using cellular traits identifies a new regulator of root development in Arabidopsis. Nat. Genet. 2014; 46:77–81. [DOI] [PubMed] [Google Scholar]
- 12. Forsberg S.K., Andreatta M.E., Huang X.Y., Danku J., Salt D.E., Carlborg Ö.. The multi-allelic genetic architecture of a variance-heterogeneity locus for molybdenum concentration in leaves acts as a source of unexplained additive genetic variance. PLos Genet. 2015; 11:e1005648. [DOI] [PMC free article] [PubMed] [Google Scholar]
- 13. 1001 Genomes Consortium 1,135 genomes reveal the global pattern of polymorphism in Arabidopsis thaliana. Cell. 2016; 166:481–491. [DOI] [PMC free article] [PubMed] [Google Scholar]
- 14. Seren Ü., Grimm D., Fitz J., Weigel D., Nordborg M., Borgwardt K., Korte A.. AraPheno: a public database for Arabidopsis thaliana phenotypes. Nucleic Acids Res. 2017; 45:D1054–D1059. [DOI] [PMC free article] [PubMed] [Google Scholar]
- 15. Welter D., MacArthur J., Morales J., Burdett T., Hall P., Junkins H., Klemm A., Flicek P., Manolio T., Hindorff L. et al. The NHGRI GWAS Catalog, a curated resource of SNP-trait associations. Nucleic Acids Res. 2013; 42:D1001–D1006. [DOI] [PMC free article] [PubMed] [Google Scholar]
- 16. MacArthur J., Bowler E., Cerezo M., Gil L., Hall P., Hastings E., Junkins H., McMahon A., Milano A., Morales J. et al. The new NHGRI-EBI Catalog of published genome-wide association studies (GWAS Catalog). Nucleic Acids Res. 2017; 45:D896–D901. [DOI] [PMC free article] [PubMed] [Google Scholar]
- 17. Horton M.W., Hancock A.M., Huang Y.S., Toomajian C., Atwell S., Auton A., Muliyati N.W., Platt A., Sperone F.G., Vilhjálmsson B.J. et al. Genome-wide patterns of genetic variation in worldwide Arabidopsis thaliana accessions from the RegMap panel. Nat. Genet. 2012; 44:212–216. [DOI] [PMC free article] [PubMed] [Google Scholar]
- 18. Cingolani P., Platts A., Wang le L., Coon M., Nguyen T., Wang L., Land S.J., Lu X., Ruden D.M.. A program for annotating and predicting the effects of single nucleotide polymorphisms, SnpEff: SNPs in the genome of Drosophila melanogaster strain w1118; iso-2; iso-3. Fly. 2012; 6:80–92. [DOI] [PMC free article] [PubMed] [Google Scholar]
- 19. Browning B.L., Browning S.R.. A unified approach to genotype imputation and haplotype-phase inference for large data sets of trios and unrelated individuals. Am. J. Hum. Genet. 2009; 84:210–223. [DOI] [PMC free article] [PubMed] [Google Scholar]
- 20. Grimm D.G., Roqueiro D., Salomé P.A., Kleeberger S., Greshake B., Zhu W., Liu C., Lippert C., Stegle O., Schölkopf B. et al. easyGWAS: a cloud-based platform for comparing the results of genome-wide association studies. Plant Cell. 2017; 29:5–19. [DOI] [PMC free article] [PubMed] [Google Scholar]
- 21. Kang H.M., Sul J.H., Service S.K., Zaitlen N.A., Kong S.Y., Freimer N.B., Sabatti C., Eskin E.. Variance component model to account for sample structure in genome-wide association studies. Nat. Genet. 2010; 42:348–354. [DOI] [PMC free article] [PubMed] [Google Scholar]
- 22. Kang H.M., Zaitlen N.A., Wade C.M., Kirby A., Heckerman D., Daly M.J., Eskin E.. Efficient control of population structure in model organism association mapping. Genetics. 2008; 178:1709–1723. [DOI] [PMC free article] [PubMed] [Google Scholar]
- 23. Mandt S., Wenzel F., Nakajima S., John C., Lippert C., Kloft M.. Sparse probit linear mixed model. Mach. Learn. 2017; 106:1–22. [Google Scholar]
- 24. Segura V., Vilhjálmsson B.J., Platt A., Korte A., Seren Ü., Long Q., Nordborg M.. An efficient multi-locus mixed-model approach for genome-wide association studies in structured populations. Nat. Genet. 2012; 44:825–830. [DOI] [PMC free article] [PubMed] [Google Scholar]
- 25. Rakitsch B., Lippert C., Stegle O., Borgwardt K.. A Lasso multi-marker mixed model for association mapping with population structure correction. Bioinformatics. 2012; 29:206–214. [DOI] [PubMed] [Google Scholar]
- 26. Azencott C.A., Grimm D., Sugiyama M., Kawahara Y., Borgwardt K.M.. Efficient network-guided multi-locus association mapping with graph cuts. Bioinformatics. 2013; 29:i171–i179. [DOI] [PMC free article] [PubMed] [Google Scholar]
- 27. Korte A., Vilhjálmsson B.J., Segura V., Platt A., Long Q., Nordborg M.. A mixed-model approach for genome-wide association studies of correlated traits in structured populations. Nat. Genet. 2012; 44:1066–1071. [DOI] [PMC free article] [PubMed] [Google Scholar]
- 28. Casale F.P., Rakitsch B., Lippert C., Stegle O.. Efficient set tests for the genetic analysis of correlated traits. Nat. Methods. 2015; 12:755–758. [DOI] [PubMed] [Google Scholar]
- 29. Seymour D.K., Chae E., Grimm D.G., Martín Pizarro C., Habring-Müller A., Vasseur F., Rakitsch B., Borgwardt K.M., Koenig D., Weigel D.. Genetic architecture of nonadditive inheritance in Arabidopsis thaliana hybrids. Proc. Natl. Acad. Sci. U.S.A. 2016; 113:E7317–E7326. [DOI] [PMC free article] [PubMed] [Google Scholar]
- 30. Kawakatsu T., Huang S.C., Jupe F., Sasaki E., Schmitz R.J., Urich M.A., Castanon R., Nery J.R., Barragan C., He Y. et al. Epigenomic diversity in a global collection of Arabidopsis thaliana accessions. Cell. 2016; 166:492–505. [DOI] [PMC free article] [PubMed] [Google Scholar]