Abstract
MicrobiomeDB (http://microbiomeDB.org) is a data discovery and analysis platform that empowers researchers to fully leverage experimental variables to interrogate microbiome datasets. MicrobiomeDB was developed in collaboration with the Eukaryotic Pathogens Bioinformatics Resource Center (http://EuPathDB.org) and leverages the infrastructure and user interface of EuPathDB, which allows users to construct in silico experiments using an intuitive graphical ‘strategy’ approach. The current release of the database integrates microbial census data with sample details for nearly 14 000 samples originating from human, animal and environmental sources, including over 9000 samples from healthy human subjects in the Human Microbiome Project (http://portal.ihmpdcc.org/). Query results can be statistically analyzed and graphically visualized via interactive web applications launched directly in the browser, providing insight into microbial community diversity and allowing users to identify taxa associated with any experimental covariate.
INTRODUCTION
Advances in high-throughput sequencing technology, together with the development of multiplex protocols for large-scale marker gene based studies (1,2), have revolutionized microbiology, allowing scientists to complement culture-based approaches with culture-independent profiling of complex microbial communities (often referred to as a ‘microbiome’). As a result, there has been a tremendous increase in microbial census data generated from diverse habitats, including soil, ocean, the built environment, humans and animals. The growth of available data underscores a need for the development of web-based tools that allow users to rapidly explore public datasets, produce customizable visualizations, and generate hypotheses, without investing in compute resources or possessing extensive knowledge in bioinformatics or statistics.
Microbiome experiments are often accompanied by study designs that describe various attributes of the samples being studied. These ‘sample details’ can include information about the source from which the sample was derived, quantitative or qualitative biometrics from human or animal clinical studies, technical comments about how samples were processed and sequencing assays were carried out, respondent survey data, and much more. Despite the considerable effort made over the past decade to develop analytical pipelines for raw sequence data generated from 16S rRNA marker gene studies (3,4) and ‘shotgun’ metagenomic studies (5,6), resources that allow scientists to interrogate the microbial community census data from the perspective of sample details are scarce. Web-based resources for microbiome researchers have focused largely on the storage and analysis of raw sequence data (7–9), or on visualization tools (10–12), rather than on integrating data mining and analysis tools that include both sequence and sample-associated data. To address these unmet needs and empower users to identify experimental variables associated with changes in microbial community structure, we developed MicrobiomeDB (http://microbiomeDB.org). We reasoned that the user interface, query tools and web toolkit developed by the Eukaryotic Pathogens Bioinformatics Resource Center, EuPathDB (http://EuPathDB.org) (13), for identifying genes of interest in eukaryotic pathogens based on gene attributes (e.g. size in kilobases, expression level from RNA sequencing data, polymorphisms from DNA sequencing data) could be adapted to identify samples of interest from microbiome studies based on sample attributes (e.g. age, sex, antibiotic exposure).
DATA LOADING
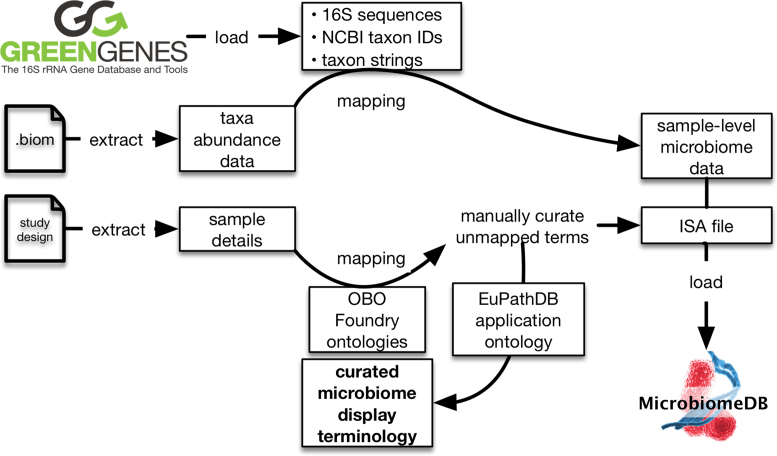
A key feature of MicrobiomeDB is the development of an automated workflow for loading data from microbiome experiments (Figure 1). Microbial community census data from six publicly available datasets derived from four published studies (14–17), each as a Biological Observation Matrix (.biom) (18), was used as input for the workflow. Datasets available on MicrobiomeDB can accessed through the ‘Data sets’ tab of the main menu bar or sidebar menu of the site. The .biom files and their associated study designs were downloaded from the QIITA portal (https://qiita.ucsd.edu/) (7,8), which at the time of download used a standardized method for pre-processing sequences and closed-reference picking of operational taxonomic units. The selection of datasets for loading into MicrobiomeDB was based on qualities that could drive tool development, including: (i) samples originating from a variety of sources (human, animal, and environment); (ii) datasets that varied in size by an order of magnitude or more, allowing us to test site function when operating on different scales and (iii) samples for which data was generated from different variable regions of the 16S rRNA gene. The MicrobiomeDB data loading workflow takes taxonomy assignments from the .biom file, maps these to the Greengenes database (19,20), and retrieves full 16S rRNA gene sequences, NCBI taxon identifiers, and taxonomy strings.
Figure 1.
Schematic showing the automated data loading workflow for MicrobiomeDB. Greengenes identifiers are extracted from .biom files containing microbial community census data and used to retrieve NCBI taxon identifiers, full 16S rRNA gene sequences, and taxon strings. User-provided sample details are mapped to an OBO Foundry ontology to expand a EuPathDB local application ontology. Sample details are formatted as an Investigation, Study, Assay (ISA) file and, along with microbiome census data, are structured in a GUS4 schema for loading into MicrobiomeDB. Manual curation is used to produce a custom microbiome display terminology for searching sample details on the website.
In addition to consuming taxonomy data, the MicrobiomeDB workflow also loads details about samples recorded by the experimenter. Sample details from the six datasets included those compliant with the MixS (Minimal Information about any (x) Sequence) standard (21); however, most of the provided terms were not covered by the standard. Harmonization of sample details was performed to facilitate data integration and guide organization of sample descriptions for searches. Terms were mapped to the Open Biomedical Ontologies (OBO) Foundry ontologies (22) including the Environmental Ontology (23) and the Ontology for Biomedical Investigations (OBI) (24). The mapped ontology terms were added to the local application ontology used across all EuPathDB sites (25), which is available through BioPortal (26) (http://bioportal.bioontology.org/ontologies/EUPATH). Unmapped terms were manually curated to generate new ontology terms that were then added to the same EuPathDB ontology. Sample details were then formatted as an Investigation, Study, Assay file (ISA) (27) and, along with the census data, were structured using a Genomics Unified Schema, version 4 (GUS4; http://www.gusdb.org/SchemaBrowserBeta/categoryList.htm) (28) for loading into the database. A web interface terminology was generated using a subset of the EuPath ontology containing only those terms needed for MicrobiomeDB, which is used to guide searches based on sample details.
HOW TO USE MICROBIOMEDB
The homepage
The homepage for MicrobiomeDB is divided into three main sections. The menu bar at the top of the page allows users to initiate a new search, access data sets, log in to view their saved searches, or contact our development team to report problems with the site or request new features or data to be added. The left-hand side bar displays social media content related to MicrobiomeDB, and provides users with access to the about page, as well as release notes and data sets. Finally, the main page summarizes the content of database, and provides access to tutorials and example searches.
Performing a search in MicrobiomeDB
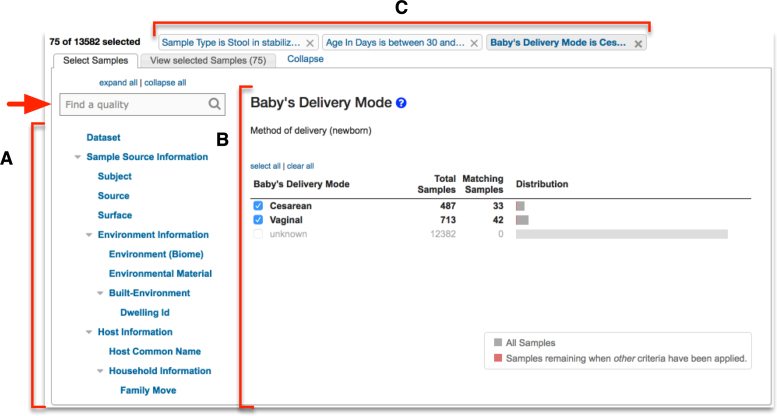
Searching the database is initiated by clicking on ‘New Search’ in the menu bar. Users have the option of searching MicrobiomeDB by either sample details or taxon abundance. Initiating a search by sample details takes users to a filter page (Figure 2) where all terms that describe all the samples in the database are available as a list (Figure 2A), searchable using a reactive text box (Figure 2, arrow). Selecting a term from this list displays its values and the number of samples that map to each value to the right (Figure 2B). When the user selects one or more values, the database is immediately filtered to return only samples annotated with the selected value(s). The user continues this process of filtering based on sample details, and can apply as many filters as they choose. Each filtering step produces a filter criteria that records and summarizes the user's filter history, providing convenient, single-click access to return to and modify any prior filter step (Figure 2C).
Figure 2.
Screenshot of the filter page for searching by sample details. (A) The filter list shows all sample details describing all the samples in the database. This list is searchable via a reactive text box (red arrow) (B) Selecting any term from the filter list shows all the values associated with that term and the number of samples from the database that match each value. (B) Users filter the samples in the database by selecting values of interest. (C) Any filter applied by the user remains accessible through filter history at the top of the page.
A second way to search the database is by taxon abundance (Supplementary Figure S1), which also takes users to a filter page, but rather than using sample details to filter the database, users are presented with a list of the full taxonomy for all taxa represented in the database (Supplementary Figure S1A). Searching for and selecting a single taxon from this list displays a distribution of the relative abundance for that specific taxon across all samples in the database (Supplementary Figure S1B). The user can select a single relative abundance value or a range of values by clicking and dragging any interval on the distribution (Supplementary Figure S1B, arrow), which then returns from the database only samples that contain the selected taxon at the specified relative abundance(s). Like the sample details filter page, the taxon abundance filter page records filter history (Supplementary Figure S1C).
Building a search strategy in MicrobiomeDB
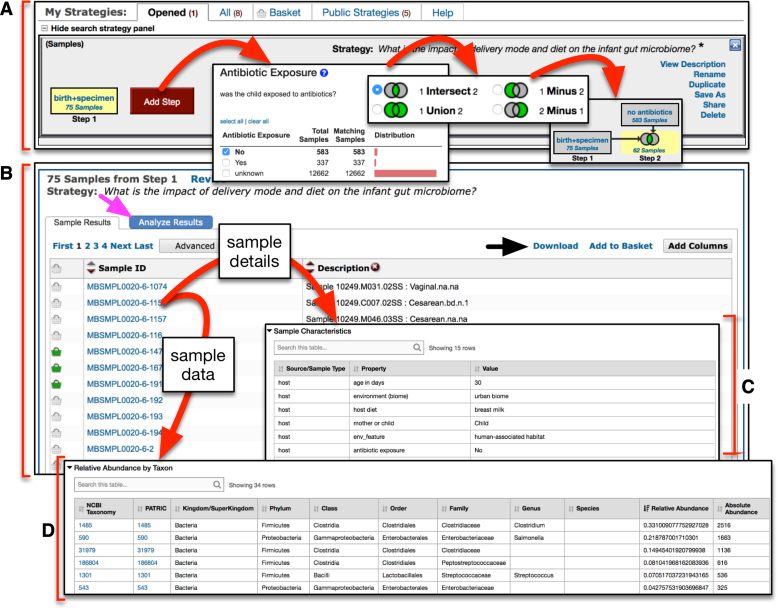
Once filtering by sample details or taxon abundance is complete, selecting ‘Get Answer’ on the filter page takes the user to a results page (Figure 3), which is divided into two main panels. At the top of the page is the strategy panel (Figure 3A), where users can design in silico experiments by expanding on a single query to combine multiple queries of the database using Boolean operators. User-defined names and descriptions can be entered for each strategy, and strategies can be saved, kept private, made public, or shared with colleagues via a URL, making complex data mining strategies transparent and reproducible. Below the strategy panel is the sample table, which displays all the samples returned by the query (Figure 3B). These results can be downloaded (Figure 3B, black arrow), and sample-level details can be viewed by clicking on individual sample identifiers in this table, which takes the user to a sample record page where the dataset and any publications associated with the sample are listed, along with all sample details and taxon abundances recorded for the sample (Figure 3C and D, respectively). Taxon-specific details (e.g. available genome sequences) can also be accessed directly from the abundance table (Figure 3D) by clicking on the taxon identifier to navigate to either the National Center for Biotechnology Information (NCBI) Taxonomy Browser (29) or the Pathosystems Resource Integration Center (PATRIC) (30).
Figure 3.
Screenshot of the query results page. (A) The strategy panel provides users with an interface to name, share and expand on their initial query, thereby constructing in silico experiments. Query results are shown as ‘Step 1’, and additional queries can be added as additional steps. (B) The sample results panel shows all samples matching the search strategy, which can be downloaded (black arrow). Users can visualize and statistically analyze their query results by accessing a suite of interactive web apps (magenta arrow). (C and D) Details and data for individual samples can be viewed by clicking on the sample identifier.
DATA VISUALIZATION AND ANALYSIS
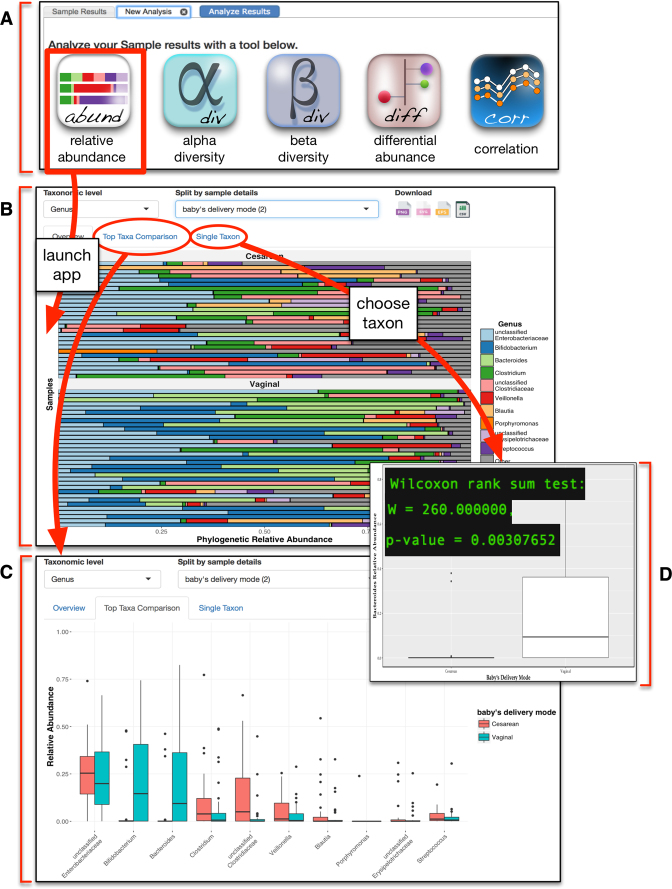
Clicking on the ‘Analyze Results’ tab of the results page (Figure 3B, magenta arrow) reveals a suite of interactive web apps to visualize and statistically analyze the samples returned from any query, directly in the browser window (Figure 4A). All apps were built using the Shiny framework (31,32) for development of web-based applications using the R programming environment (33). Our Shiny apps follow four common guiding principles: first, all data and sample details returned by a query strategy are passed to the app so that users can explore their data in the context of the experimental covariates. For example, graphs can be faceted and colored to reveal how factors such as diet, specimen type, or disease status are associated with shifts in microbial community diversity or composition. Second, all apps adhere to the ‘grammar of graphics’ and were generated using ggplot2 (34). Third, when appropriate, non-parametric statistical analyses (Wilcoxon or Kruskal–Wallis rank sum test) are automatically computed after faceting and test results are displayed on the graphic. Fourth, any graphic produced and the underlying data can be downloaded directly from within the app. Currently, five apps are available on MicrobiomeDB and the underlying R code is available on GitHub (https://github.com/dpbisme/microbiomeDB), allowing users to contribute to app development, or download and run apps locally on their own datasets. These apps are described in more detail below.
Figure 4.
Screenshot of the relative abundance app. (A) The analysis tab of the results page provides access to a suite of interactive web apps for visualization and analysis of microbial community diversity and composition. (B) Selecting the relative abundance app displays a horizontal stacked bar chart of the top ten most abundant taxa. Users can customize this graphic by selecting taxonomic level and sample details to partition the samples into groups. (C) Navigating to the ‘top taxa comparison’ tab of the app displays this data as a box-and-whisker plot that allows the same customization as the stacked bar chart. (D) Double clicking on any single taxon in panel B, or navigating to the ‘single taxon’ tab of the app and entering a taxon of interest, displays a graph of that taxon with statistical analysis comparing the relative abundance between the user-defined group(s).
Relative abundance app
Relative abundance of taxa is pre-calculated for each sample during the data loading workflow (Figure 1). When the relative abundance app is launched, a horizontal stacked bar chart is created from the top 10 most abundant taxa present (by median relative abundance) across all the samples returned by the query, and the relative abundance for all remaining taxa is binned together and displayed as an 11th group termed ‘other’ (Figure 4B). A drop down menu is available to change the taxonomic rank, or to partition the graph based on any available covariates for the displayed samples, producing an updated graphic with each new user input. Selecting the ‘Top Taxa Comparison’ tab of this app opens a new graphic that displays the top 10 taxa as box-and-whisker plots, with one box per covariate (Figure 4C). Finally, a third tab of this app, ‘Single Taxon’, provides users with a searchable list of all taxa present in the samples. Selecting a taxon from this list produces a box-and-whisker plot for only that taxon, and calculates significance (Figure 4D).
Diversity apps
Unlike relative abundance data, diversity metrics are not pre-calculated at the time of data loading. Instead, when users launch the alpha diversity app, the PhyloSeq package (35) is used to de novo calculate Shannon, Simpson, Chao1, ACE and Fisher diversity metrics, which are then displayed as either a dot- or box-plot (Supplementary Figure S2). Clicking on the ‘Explore Sample Details’ tab of the app (Supplementary Figure S2B, arrow) allows users to facet the plot based on one or more experimental variables. Similarly, when users launch the beta diversity app, Bray-Curtis, Jensen–Shannon divergence, Jaccard, Kulczynski, Canberra, Horn and Mountford metrics are used to calculate dissimilarity between samples, which is then used to ordinate the samples as points on a two-dimensional plot, where point color and shape can be mapped to sample details (Supplementary Figure S2C).
Differential abundance and correlation apps
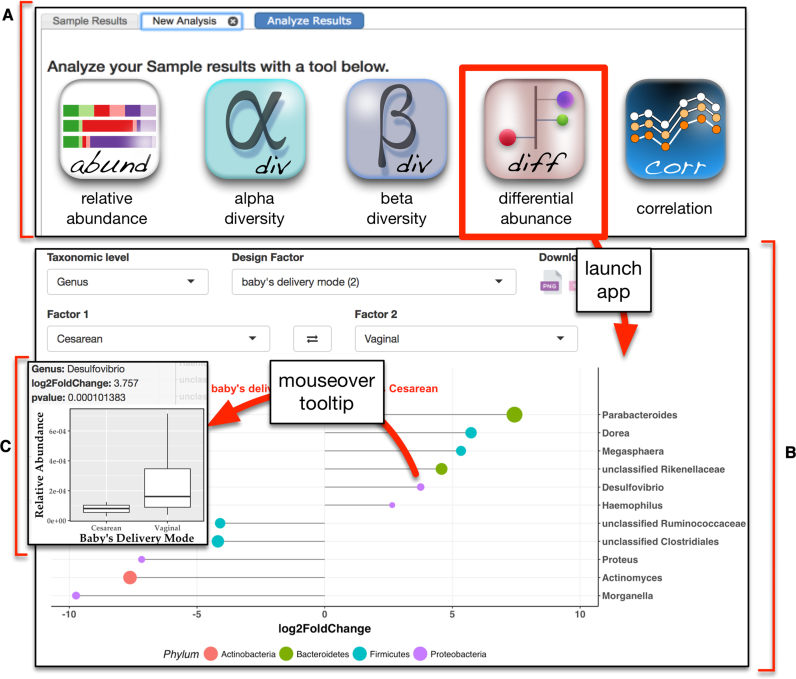
Launching the differential abundance app (Figure 5) uses DESeq2, v1.16.1, to apply a negative binomial generalized linear model and Wald test (36) to identify differentially abundant taxa between any pairwise comparison of sample details. The user selects the experimental variable of interest from a drop down menu (e.g. baby's delivery mode) and is presented with two additional drop down menus that show all values associated with the selected term. Choosing the pairwise comparison of values (e.g. cesarean versus vaginal) initiates the differential abundance analysis. Results are displayed as a ‘lollipop’ chart where each lollipop represents a differentially abundant taxon, its direction indicates the phenotype association, length indicates fold change, the color indicates phylum, and the size signifies statistical significance (Figure 5B). Moving the cursor over any taxon displays a tooltip box-and-whisker graph with statistics for that taxon (Figure 5C). Rather than specifically testing for differentially abundant taxa, users may want to explore associations between taxa and sample details more broadly. To address this need, the correlation app (data not shown) displays the Spearman's rank correlation between continuous sample details and taxa, and also allows users to also view correlations between different continuous sample details. The result is shown as a dot plot where the colors indicate the Spearman's rho (blue for positive correlation and red for negative correlation) and the size signifies statistical significance. A searchable table is also displayed under the chart where the user can see all the correlations in a structured way.
Figure 5.
Screenshot of the differential abundance app. (A) The analysis tab of the results page provides access to a suite of interactive web apps for visualization and analysis of microbial community diversity and composition. (B) Selecting the differential abundance app presents users with several drop down menus to customize their analysis. After choosing the taxonomic level, the design factor, and the pairwise comparison of interest, DESeq2 is run to identify differentially abundant taxa. Results are displayed as a ‘lollipop’ chart where color indicates phylum, length of the lollipop indicates log2 fold change (X-axis), and size of the lollipop reflects statistical significance. (C) Moving the cursor over any lollipop displays a plot of relative abundance with statistics for that taxon.
ADDITIONAL FEATURES
Favorites and basket
Through the favorites tool, users can bookmark samples of interest for convenient access later. Adding or removing a sample to the favorites can be done by clicking on the favorites icon (star) present at the top of each sample record page (Figure 3C and D). Samples in the favorites page can be assigned to user-defined projects and free text can be added to describe each sample. Additional flexibility for dealing with custom sample lists is provided by the basket tool, which allows a user to compile and save a set of samples that can be added to a search strategy and thereby incorporated with any other samples from MicrobiomeDB. Samples are added to the basket by clicking on the basket icon next to the sample ID on the search results page (Figure 3B) or at the top of a sample record page (Figure 3C and D). Favorites and the basket are accessed via links in the menu bar at the top of the homepage.
FUTURE DIRECTIONS
MicrobiomeDB currently accepts microbial community census data in the form of a .biom file. One consequence of loading .biom files is that preprocessing of raw sequences, alignments to a reference database, and taxonomic assignment are all carried out by the data providers, rather than by MicrobiomeDB itself. This significantly limits the ability to integrate datasets, since different data providers likely produce .biom files using different methods. A priority moving forward is to extend the current data loading workflow to accommodate raw 16S rRNA gene sequence data, instead of .biom files, thereby taking a major step toward making standardized data processing a central part of loading data into MicrobiomeDB. Beyond 16S rRNA gene sequences, future development of the site will include tools for loading and analysis of ‘shotgun’ metagenomic sequences, with the initial focus on HMP data where both 16S rRNA and metagenomic data are available, providing valuable insight into differences in community composition gleaned by these approaches (37). In addition, a large collection of highly curated metagenomic data from human samples is also publicly available (https://waldronlab.github.io/curatedMetagenomicData/), and will be prioritized for loading. Although MicrobiomeDB was constructed around a limited number of datasets, this was sufficient for tool development, and the size of the database can now be dramatically increased without the need to significantly modify site infrastructure or apps. We expect to eventually load all datasets available through the QIITA portal (7,8), with an initial focus on datasets from gastrointestinal diseases in humans and animals, including inflammatory bowel disease, infection and malnutrition.
Data visualization and analysis apps will continue to be refined and new apps added to the analysis suite, including new methods to find taxa associated with both discrete and continuous variables, such as age and weight. Shiny app development will be driven, in part, by user comments and requests submitted through the ‘contact us’ link on the website. Setting up a free account on MicrobiomeDB currently allows users to save search strategies, and one goal moving forward is to also enable saving and sharing of entire analyses carried out through the Shiny apps. Finally, it is common for microbiome experiments to include other assays, such as metabolomics or transcriptional profiling, and the extensibility of our data loading workflow and the EuPathDB web toolkit provide an opportunity to incorporate diverse data types. For example, EuPathDB infrastructure is already used to mine and view single nucleotide polymorphisms (SNPs) from pathogen genomes, and this functionality will be leveraged for viewing SNPs in metagenomic data in the future. In addition, metagenomics studies will also open the doors to utilizing eukaryotic pathogens genomes and community datasets already richly represented across EuPathDB sites. Taken together, these results constitute a first step toward a full-featured, open-source web platform for a systems biology view of microbial communities.
Supplementary Material
SUPPLEMENTARY DATA
Supplementary Data are available at NAR Online.
FUNDING
None.
Conflict of interest statement. None declared.
REFERENCES
- 1. Kozich J.J., Westcott S.L., Baxter N.T., Highlander S.K., Schloss P.D.. Development of a dual-index sequencing strategy and curation pipeline for analyzing amplicon sequence data on the MiSeq Illumina sequencing platform. Appl. Environ. Microbiol. 2013; 79:5112–5120. [DOI] [PMC free article] [PubMed] [Google Scholar]
- 2. Caporaso J.G., Lauber C.L., Walters W.A., Berg-Lyons D., Huntley J., Fierer N., Owens S.M., Betley J., Fraser L., Bauer M. et al. Ultra-high-throughput microbial community analysis on the Illumina HiSeq and MiSeq platforms. ISME J. 2012; 6:1621–1624. [DOI] [PMC free article] [PubMed] [Google Scholar]
- 3. Schloss P.D., Westcott S.L., Ryabin T., Hall J.R., Hartmann M., Hollister E.B., Lesniewski R.A., Oakley B.B., Parks D.H., Robinson C.J. et al. Introducing mothur: open-source, platform-independent, community-supported software for describing and comparing microbial communities. Appl. Environ. Microbiol. 2009; 75:7537–7541. [DOI] [PMC free article] [PubMed] [Google Scholar]
- 4. Caporaso J.G., Kuczynski J., Stombaugh J., Bittinger K., Bushman F.D., Costello E.K., Fierer N., Peña A.G., Goodrich J.K., Gordon J.I. et al. QIIME allows analysis of high-throughput community sequencing data. Nat. Methods. 2010; 7:335–336. [DOI] [PMC free article] [PubMed] [Google Scholar]
- 5. Segata N., Izard J., Waldron L., Gevers D., Miropolsky L., Garrett W.S., Huttenhower C.. Metagenomic biomarker discovery and explanation. Genome Biol. 2011; 12:R60. [DOI] [PMC free article] [PubMed] [Google Scholar]
- 6. Wood D.E., Salzberg S.L.. Kraken: ultrafast metagenomic sequence classification using exact alignments. Genome Biol. 2014; 15:R46. [DOI] [PMC free article] [PubMed] [Google Scholar]
- 7. QIITA: an open-source microbial study management platform. https://qiita.ucsd.edu/. [Google Scholar]
- 8. Navas-Molina J.A., Hyde E.R., Sanders J., Knight R.. The microbiome and big data. Curr. Opin. Syst. Biol. 2017; doi:10.1016/j.coisb.2017.07.003. [DOI] [PMC free article] [PubMed] [Google Scholar]
- 9. Office of Cyber Infrastructure and Computational Biology (OCICB), National Institute of Allergy and Infectious Diseases (NIAID). Nephele. https://nephele.niaid.nih.gov. [Google Scholar]
- 10. Wagner J., Chelaru F., Kancherla J., Paulson J.N., Felix V., Mahurkar A., Corrada Bravo H.. Metaviz: interactive statistical and visual analysis of metagenomic data. http://metaviz.cbcb.umd.edu/. [DOI] [PMC free article] [PubMed] [Google Scholar]
- 11. Human Microbiome Project. Data Portal. http://portal.ihmpdcc.org/. [Google Scholar]
- 12. Bik H.M. Phinch: an interactive, exploratory data visualization framework for –Omic datasets. http://phinch.org/. [Google Scholar]
- 13. Aurrecoechea C., Barreto A., Basenko E.Y., Brestelli J., Brunk B.P., Cade S., Crouch K., Doherty R., Falke D., Fischer S. et al. EuPathDB: the eukaryotic pathogen genomics database resource. Nucleic Acids Res. 2017; 45:D581–D591. [DOI] [PMC free article] [PubMed] [Google Scholar]
- 14. Human Microbiome Project Consortium Structure, function and diversity of the healthy human microbiome. Nature. 2012; 486:207–214. [DOI] [PMC free article] [PubMed] [Google Scholar]
- 15. Bokulich N.A., Chung J., Battaglia T., Henderson N., Jay M., Li H., D Lieber A., Wu F., Perez-Perez G.I., Chen Y. et al. Antibiotics, birth mode, and diet shape microbiome maturation during early life. Sci. Transl. Med. 2016; 8:343ra82. [DOI] [PMC free article] [PubMed] [Google Scholar]
- 16. Song S.J., Lauber C., Costello E.K., Lozupone C.A., Humphrey G., Berg-Lyons D., Caporaso J.G., Knights D., Clemente J.C., Nakielny S. et al. Cohabiting family members share microbiota with one another and with their dogs. elife. 2013; 2:e00458. [DOI] [PMC free article] [PubMed] [Google Scholar]
- 17. Lax S., Smith D.P., Hampton-Marcell J., Owens S.M., Handley K.M., Scott N.M., Gibbons S.M., Larsen P., Shogan B.D., Weiss S. et al. Longitudinal analysis of microbial interaction between humans and the indoor environment. Science. 2014; 345:1048–1052. [DOI] [PMC free article] [PubMed] [Google Scholar]
- 18. McDonald D., Clemente J.C., Kuczynski J., Rideout J.R., Stombaugh J., Wendel D., Wilke A., Huse S., Hufnagle J., Meyer F. et al. The Biological Observation Matrix (BIOM) format or: how I learned to stop worrying and love the ome-ome. Gigascience. 2012; 1:7. [DOI] [PMC free article] [PubMed] [Google Scholar]
- 19. DeSantis T.Z., Hugenholtz P., Larsen N., Rojas M., Brodie E.L., Keller K., Huber T., Dalevi D., Hu P., Andersen G.L.. Greengenes, a chimera-checked 16S rRNA gene database and workbench compatible with ARB. Appl. Environ. Microbiol. 2006; 72:5069–5072. [DOI] [PMC free article] [PubMed] [Google Scholar]
- 20. McDonald D., Price M.N., Goodrich J., Nawrocki E.P., DeSantis T.Z., Probst A., Andersen G.L., Knight R., Hugenholtz P.. An improved Greengenes taxonomy with explicit ranks for ecological and evolutionary analyses of bacteria and archaea. ISME J. 2012; 6:610–618. [DOI] [PMC free article] [PubMed] [Google Scholar]
- 21. Yilmaz P., Gilbert J.A., Knight R., Amaral-Zettler L., Karsch-Mizrachi I., Cochrane G., Nakamura Y., Sansone S.-A., Glöckner F.O., Field D.. The genomic standards consortium: bringing standards to life for microbial ecology. ISME J. 2011; 5:1565–1567. [DOI] [PMC free article] [PubMed] [Google Scholar]
- 22. Smith B., Ashburner M., Rosse C., Bard J., Bug W., Ceusters W., Goldberg L.J., Eilbeck K., Ireland A., Mungall C.J. et al. The OBO Foundry: coordinated evolution of ontologies to support biomedical data integration. Nat. Biotechnol. 2007; 25:1251–1255. [DOI] [PMC free article] [PubMed] [Google Scholar]
- 23. Buttigieg P.L., Morrison N., Smith B., Mungall C.J., Lewis S.E. ENVO Consortium . The environment ontology: contextualising biological and biomedical entities. J. Biomed. Semantics. 2013; 4:43. [DOI] [PMC free article] [PubMed] [Google Scholar]
- 24. Bandrowski A., Brinkman R., Brochhausen M., Brush M.H., Bug B., Chibucos M.C., Clancy K., Courtot M., Derom D., Dumontier M. et al. The ontology for biomedical investigations. PLoS ONE. 2016; 11:e0154556. [DOI] [PMC free article] [PubMed] [Google Scholar]
- 25. Zheng J., Cade J., Brunk B.P., Roos D.S., Stoeckert C.J., James S., Arinaitwe E., Greenhouse B., Dorsey G., Sullivan S. et al. Malaria Study Data Integration and Information Retrieval Based on OBO Foundry Ontologies. ICBO/BioCreative. 2016; http://icbo.cgrb.oregonstate.edu/node/309. [Google Scholar]
- 26. Noy N.F., Shah N.H., Whetzel P.L., Dai B., Dorf M., Griffith N., Jonquet C., Rubin D.L., Storey M.-A., Chute C.G. et al. BioPortal: ontologies and integrated data resources at the click of a mouse. Nucleic Acids Res. 2009; 37:W170–W173. [DOI] [PMC free article] [PubMed] [Google Scholar]
- 27. Rocca-Serra P., Brandizi M., Maguire E., Sklyar N., Taylor C., Begley K., Field D., Harris S., Hide W., Hofmann O. et al. ISA software suite: supporting standards-compliant experimental annotation and enabling curation at the community level. Bioinformatics. 2010; 26:2354–2356. [DOI] [PMC free article] [PubMed] [Google Scholar]
- 28. Davidson S.B., Crabtree J., Brunk B.P., Schug J., Tannen V., Overton G.C., Stoeckert C.J.. K2/Kleisli and GUS: Experiments in integrated access to genomic data sources. IBM Syst. J. 2001; 40:512–531. [Google Scholar]
- 29. Sayers E.W., Barrett T., Benson D.A., Bryant S.H., Canese K., Chetvernin V., Church D.M., DiCuccio M., Edgar R., Federhen S. et al. Database resources of the National Center for Biotechnology Information. Nucleic Acids Res. 2009; 37:D5–D15. [DOI] [PMC free article] [PubMed] [Google Scholar]
- 30. Wattam A.R., Davis J.J., Assaf R., Boisvert S., Brettin T., Bun C., Conrad N., Dietrich E.M., Disz T., Gabbard J.L. et al. Improvements to PATRIC, the all-bacterial Bioinformatics Database and Analysis Resource Center. Nucleic Acids Res. 2017; 45:D535–D542. [DOI] [PMC free article] [PubMed] [Google Scholar]
- 31. Chang W., Cheng J., Allaire J.J., Xie Y., McPherson J.. shiny: Web Application Framework for R. 2017.
- 32. RStudio Team RStudio: Integrated Development Environment for R. 2016.
- 33. R Core Team R: A Language and Environment for Statistical Computing. R Foundation for Statistical Computing. 2017. [Google Scholar]
- 34. Wickham H. ggplot2: Elegant Graphics for Data Analysis Springer. 2009; NY: Springer; c2009. [Google Scholar]
- 35. McMurdie P.J., Holmes S.. phyloseq: an R package for reproducible interactive analysis and graphics of microbiome census data. PLoS ONE. 2013; 8:e61217. [DOI] [PMC free article] [PubMed] [Google Scholar]
- 36. Love M.I., Huber W., Anders S.. Moderated estimation of fold change and dispersion for RNA-seq data with DESeq2. Genome Biol. 2014; 15:550–550. [DOI] [PMC free article] [PubMed] [Google Scholar]
- 37. Tessler M., Neumann J.S., Afshinnekoo E., Pineda M., Hersch R., Velho L.F.M., Segovia B.T., Lansac-Toha F.A., Lemke M., DeSalle R. et al. Large-scale differences in microbial biodiversity discovery between 16S amplicon and shotgun sequencing. Sci. Rep. 2017; 7:6589. [DOI] [PMC free article] [PubMed] [Google Scholar]
Associated Data
This section collects any data citations, data availability statements, or supplementary materials included in this article.


