


Abstract
Model organism and human databases are rich with information about genetic and physical interactions. These data can be used to interpret and guide the analysis of results from new studies and develop new hypotheses. Here, we report the development of the Molecular Interaction Search Tool (MIST; http://fgrtools.hms.harvard.edu/MIST/). The MIST database integrates biological interaction data from yeast, nematode, fly, zebrafish, frog, rat and mouse model systems, as well as human. For individual or short gene lists, the MIST user interface can be used to identify interacting partners based on protein–protein and genetic interaction (GI) data from the species of interest as well as inferred interactions, known as interologs, and to view a corresponding network. The data, interologs and search tools at MIST are also useful for analyzing ‘omics datasets. In addition to describing the integrated database, we also demonstrate how MIST can be used to identify an appropriate cut-off value that balances false positive and negative discovery, and present use-cases for additional types of analysis. Altogether, the MIST database and search tools support visualization and navigation of existing protein and GI data, as well as comparison of new and existing data.
INTRODUCTION
Physical and genetic interactions (GIs) underlie important biological functions in all living organisms. For example, many proteins within a signaling pathway, components of a protein complex and kinases and their substrates are annotated in the literature as having genetic and/or physical interactions with one another. There are many public resources providing interaction data. For example, Database of Interacting Proteins (DIP) (1) was built on interactions manually curated based on small-scale studies from the literature, providing a small but well-annotated network. Resources like BioGrid (2) and IntAct (3) include large-scale screen data in addition to manually curated data from small studies, and thus provide much larger networks. Several resources integrate interactions from multiple public resources. For example, IMEx (4), a consortium effort, integrates the binary protein–protein interaction (PPI) data from multiple resources such as DIP and IntAct. Another example is iRefWeb (5), which integrates both physical and GIs from multiple public resources. These resources are available for a broad range of organisms and serve the important role of providing evidence-based interaction data (most typically, PPI data). In addition, protein and/or GI data are also available through species-specific databases such as DroID (6) and FlyBase (7) for Drosophila, Human Protein Reference Database (HPRD) for human and mouse (8), and PomBase (9) for fission yeast.
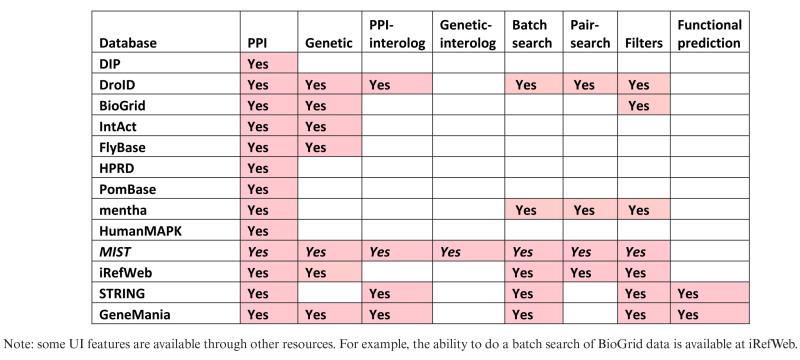
A challenge for bench scientists who are interested to mine and use protein or GI data is that these various resources have different coverage and the results obtained for a given gene or protein can vary significantly depending on which resource is queried (Supplementary Figure S1). In addition, there is a need for more effective mapping of gene or protein interactions among species. In particular as this can provide testable hypothetical interactions for otherwise unannotated genes or proteins in a given species, based on what is available for one or more other species. We addressed this need by developing the Molecular Interaction Search Tool (MIST) database. MIST integrates both physical and genetic interactions from major public resources as well as annotations from species-specific resources like FlyBase, and maps interaction data among major model organisms using an effective ortholog mapping mechanism. In addition to providing flat files and API, MIST is also supported by a web-based user interface, which provides search options and filters so that user can search different types of interactions for one gene or a list of genes or gene-pairs, and build customized networks. We also demonstrate that MIST can be used for ‘omics data analyses. MIST differs from tools such as STRING (10) and GeneMania (11) as those resources primarily focus on functional prediction, rather than mining of existing evidence-based data (Tables 1 and 2). Altogether, MIST serves as an integrated, searchable database of physical and GI data for major model organisms and human, allowing users to analyze screen data and build evidence-based networks.
Table 1. Data sources and summary of integrated data in MIST.
| Source | Interactions included in MIST | unique interactions not in other database | Interaction types | Species for MIST | Reference (pmid) |
|---|---|---|---|---|---|
| DIP (1) | 106 660 | 6517 | PPI | 10 | 14681454 |
| DroID (including DPiM) (6,29) | 247 816 | 129 219 | PPI,GI | 1 | 21036869 |
| BioGrid (2) | 1 827 231 | 1 105 722 | PPI,GI | 9 | 27980099 |
| IntAct (including MINT) (3) | 634 547 | 16 381 | PPI,GI | 10 | 24234451 |
| FlyBase (7) | 64 007 | 21 192 | PPI,GI | 1 | 27799470 |
| HPRD (8) | 76 233 | 23 363 | PPI | 2 | 18988627 |
| PomBase (9) | 5290 | 3624 | PPI | 1 | 25361970 |
| mentha (4,28) | 1 020 351 | 9454 | PPI | 9 | 23900247 |
| HumanMAPK (30,31) | 4530 | 2941 | PPI | 1 | 20936779 |
| MIST (without interologs) | 2 376 341 | PPI,GI | 10 | ||
| MIST (including interologs) | 13 573 897 | PPI,GI | 10 |
Table 2. Comparison of MIST to similar resources.
|
DATABASE DESCRIPTION
The MIST online resource (Figure 1) includes an integrated database of biological interaction data for most major model organisms: Saccharomyces cerevisiae, Schizosaccharomyces pombe, Caenorhabditis elegans, Drosophila melanogaster, Danio rerio, Xenopus tropicalis, Rattus norvegicus, Mus musculus and Homo sapiens. The data in MIST are from curated public databases such as BioGrid, IntAct, DIP, mentha, as well as from the few species-specific resources (FlyBase, DroID and HPRD) (Table 1). The data types that MIST covers are curated physical and GIs for all of the organisms, as well as predicted kinase–substrate relationships, a predicted correlation network based on expression pattern (12) and phenotype (13) and phosphoproteomics data (14) for Drosophila. The MIST online resource also maps data among the included organisms using the DRSC Integrative Ortholog Prediction Tool (DIOPT) (15). Thus, in addition to viewing interactions from high-throughput data sources and literature mining, users can also view orthology-based inferred interactions or ‘interologs’ (16). The MIST user interface is designed to provide an intuitive search interface and visualization tools useful for functional discovery surrounding one or a few genes/proteins, or a larger network.
Figure 1.

MIST online user interface. The MIST user interface allows users to select a species of interest; upload a single gene, a list of genes or gene pairs; and select one or more interaction types. Users also have the option to apply filters based on confidence and/or data type. The output contains a Cytoscape network view with edges color-coded for different interaction types as well as a summary table about the interaction partners that includes references and experimental approaches. The summary table can be downloaded as a file.
This integrated resource has much larger coverage as compared with individual sources (Table 1). Coverage is further increased by inclusion of interactions mapped among species. For example, when interologs are included, we observe an ∼18-fold increase in coverage of PPI interactions in mouse, and a 2-fold increase in the total number of genes for which an interaction is included (http://fgrtools.hms.harvard.edu/MIST/stats.jsp). In addition to integrating data from different sources, we also assigned a rank to each interaction. A rank of ‘high’ is assigned for interactions supported by multiple experimental methods and/or reported in multiple publications. A rank of ‘moderate’ is assigned if these criteria are not met but the interaction is supported by data from another species. For interologs, we assigned a rank of ‘moderate’ if the interaction was mapped from orthologous genes of multiple species. We propose that high-confidence interactions will be useful as positive controls or benchmarks during the analysis of large-scale data using MIST (see below). The ranking also allows users to filter results, such that they can view higher confidence subsets of interactions as a network or table (Figure 1).
Altogether, features that distinguish MIST from some or all similar databases include: (i) availability of both PPIs and GIs; (ii) availability of data from small and large-scale studies, and from broad and organism-focused sources, leading to improved coverage; (iii) availability of interologs for PPIs and GIs, further increasing coverage; and (iv) a user interface that supports a variety of queries and visualizations by researchers, as described below.
WEB-BASED FEATURES OF THE MIST RESOURCE
The MIST online user interface facilitates the query of genes from common model organisms and human genes. Specifically, on the MIST search page (Figure 1, top panel), users can enter a list of genes and select the type of interaction(s) that they are interested to view, i.e. PPIs or GIs, with or without inclusion of interologs. The results display page (Figure 1, bottom panel) includes both a graphical network view and a table. The network view is built using Cytoscape.js (17). Edges in the network are color-coded based on the type of interaction (e.g. solid red for PPIs, dotted purple for PPI-interologs, solid blue for GIs and dotted green for interologs of GIs). MIST is also linked to literature based complex annotation from COMPLEAT [(18)], at the search result page, the list of complexes that overlap with the network will be listed and users can highlight the nodes of each complex.
Results can be filtered based on the rank assigned to the interactions. With the advanced search option, users can also filter the data based on other criteria. PPIs can be filtered based on approach, which can help distinguish direct binary interactions from interactions that might or might not be direct. Those most interested in binary interactions, for example, can select to view only yeast two-hybrid data, which provide evidence of a direct interaction. Alternatively, a user can choose to view only protein complex data from mass spectrometry (mass spec) interaction studies, in which the proteins with an annotated interaction might or might not have a direct binary interaction. In addition to filtering by evidence type, users can also filter by evidence count (i.e. the number of different types of evidence that support an interaction) and publication count (i.e. the number of publications that report the interaction). The same types of filters are also available for interologs. Moreover, regarding interologs, users can limit results to interactions detected for orthologs in some user-specified number of species (e.g. two or more species). For GIs, users can filter by evidence count or by publication count. A logical operator (i.e. AND or OR) can be used to combine these options.
In addition to supporting search of the MIST database with a simple gene list, the MIST user interface also supports search with a list of gene or protein pairs, for example to search MIST with a list of pairs detected in a new study. With this application, MIST can be used to quickly identify existing evidence in the same or other species, allowing the user to quickly sort known, interolog-supported, and novel interactions represented in the list.
The web-based user interface was designed to help bench scientist. MIST also provides API as well as flat files of the data per organism to facilitate access by programs or bioinformaticians so that MIST can be easily integrated into other resources.
USING CROSS-SPECIES INTERACTION DATA TO GAIN INSIGHT INTO ORTHOLOGOUS GENES
Overall there are 1 340 739 PPIs in MIST and 965 817 GIs identified using proteins from the same species. Comparing the data with data for orthologous genes from other species, 114 396 of PPIs (9%) and 14 776 of GIs (2%) overlap with data for orthologous genes. We analyzed the overall overlap for each model organism (Figure 2). We also compared the pairwise overlap (Figure 2C). The most overlap is seen between human and mouse (27% of mouse PPIs overlap with human PPIs). The human and budding yeast PPI datasets are the largest datasets, and this is reflected in higher percent overlap. In MIST, about 5% of interactions were directly tested between proteins from different species, an experimental approach sometimes undertaken due to the availability of reagents. For example, in a study by Hein et al. (19), 1125 GFP-tagged mouse proteins were expressed in the human HeLa cell line and tested for interactions with host proteins. Specifically, we selected 26 482 PPIs experimentally identified by testing of mouse versus human proteins from 2591 reports in PubMed, then asked if there is human versus human evidence supporting the idea that the corresponding human ortholog of the mouse protein interacts with the human partner protein identified in the mouse–human study (Supplementary Figure S2). To do this, we first mapped mouse to human orthologs using DIOPT, and then reconstructed human–human protein pairs to compare with PPI data obtained directly among human proteins. Among the reconstructed human–human pairs, 32% overlap with human PPI data, a percentage that is significantly higher than what we obtain using reconstructed human–human pairs from random mouse–human gene pairs (Supplementary Figure S2A). Due to the current limits of human PPI coverage, 9% of the human orthologous genes were not covered by current human PPI data; therefore, we expect that the overlap will increase as more human PPI data become available. In addition, the overlapping pairs are enriched for high DIOPT score orthologs, which reflects the confidence of ortholog mapping (Supplementary Figure S2B). This analysis confirms that orthologous genes tend to preserve their ability to interact with other genes (16), supporting the idea that our approach of including interologs to build more comprehensive network has validity.
Figure 2.

Comparison of PPI and GI data with data from orthologous genes. (A) Overlap of PPI and interolog (derived from PPI of other species) for each species. (B) Overlap of GIs and interologs (derived from GIs of other species) for each species. (C) Pairwise comparison of PPI data by orthologous mapping. Species are organized from largest number of PPIs (human) to least (Schizosaccharomyces pombe). Overlap percentage is corrected for pairwise conservation (DIOPT score ≥ 3 for both partners).
EXAMPLE APPLICATIONS USING MIST
Below, we describe three example applications of MIST that go beyond its utility as a tool for querying and viewing PPI and GI networks. The first exemplifies the use of MIST for analysis of a gene list, in this case obtained using a functional genomics approach. The other two use MIST to analyze lists of pairs, one compiled based on gene features (in this case, paralogs) and the other representing raw experimental data.
Asking if essential genes are likely to interact with one another
As our first analysis use-case, we analyzed essential genes identified in cancer cell lines (20). We made first the assumption that the number of different cancer cell lines for which a given gene was detected as an essential gene is a measure of confidence that the gene is indeed essential. We then queried the list of essential genes at MIST to ask if essential genes tend to interact with one another. Interestingly, the MIST analysis shows that genes for which more cell lines support the idea that the gene is essential are more likely to interact with one another as compared with a random gene list. This was true to the same extent for both PPIs and GIs (Figure 3A). This indicates the potential use of MIST in analyzing data from large-scale screens, for example to set a cutoff value or to prioritize subsets of genes for follow-up studies. As exemplified below for paralogs, this approach can be used to determine whether any grouped sets of genes/proteins are more likely to interact with one another than what is expected at random.
Figure 3.

Using MIST to analyze gene or gene pair lists. (A). Using MIST to analyze results of a genome-wide study of essential genes in cancer cells. Genes scoring as ‘hits’ (positive results) in the CRISPR screen by Hart et al. (20) with higher confidence are more likely to interact with each other, showing that MIST can facilitate the analysis and interpretation of large-scale screen data. (B) Using MIST to analyze paralogs. Paralog pairs as identified using DIOPT overlap with both PPIs and GIs in model organisms and human. The overlap correlates with paralog rank. Protein complexes identified using COMPLEAT provides supporting evidence for the idea that some paralogs (blue circles) physically interact. (C) Using MIST to analyze proteomics data. Analysis with MIST of a raw mass spectrometry interactome dataset can help define a SAINT score cutoff that improves sensitivity without undue increase in specificity. As shown at the top of panel C, the x-axis is the SAINT score, and the y-axis is the percent overlap with PPI and/or interologs. As shown in at the bottom of panel C, MIST can also help ‘rescue’ interactions supported by independent evidence. The blue circle represents the published hits selected by SAINT score cutoff. The areas outside the blue circle but inside the red or green circles represent ‘rescued’ interactions that are included in the raw data and do not meet the cutoff, but are supported by independent evidence.
Asking if paralogs are likely to interact with one another
Paralogs are genes that originate from a duplication event within a genome. Paralogs therefore typically share high sequence similarity, and may serve redundant or partially redundant functions. DIOPT predicts paralogous gene pairs within a genome, and the count of algorithms supporting the prediction serves as a measure of prediction strength. In addition to providing a count, the current version of DIOPT further annotates paralog predictions as high, moderate or low based on the count of algorithms supporting paralogy, as well as whether the pair has the best score by forward or reverse search. We compared all paralogous pairs predicted by DIOPT with the integrated interaction data at MIST. We find that paralog gene pairs are significantly enriched for MIST interactions (2–48%) compared to random gene pairs (0.3%) for both PPIs and GIs. In addition, the level of enrichment of interactions correlates with the confidence of paralog prediction in all nine species (Figure 3B). This finding supports the idea that paralogs are likely to participate in the same molecular and/or genetic functions as their partners, and that this likelihood increases with sequence similarity (21). GIs among paralogs likely reflect their functions in the same or redundant pathways. Physical interactions among paralogs were not unexpected either (e.g. as some paralog form heteromers) (22) but nevertheless were more surprising. We further analyzed paralogs positive in the analysis for physical interactions with one another using COMPLEAT (18) and identified protein complexes annotated from the literature that are enriched with paralogs. Based on this analysis, we conclude that this is not solely due to simple interactions among paralogs; it sometimes reflects formation of larger complexes that include both members of one or more paralogous pair. One example is the human GST–Smad3 complex, in which two pairs of proteins among the 10 proteins in the complex are paralogous (SMARCC1 and SMARCC2, NCOR1 and NCOR2) (23). Another example is the human SIN3–HDAC–SAP30–ARID4 complex, in which two pairs of proteins among the seven proteins in the complex are paralogous (RBBP7 and RBBP4, HDAC1 and HDAC2) (24). We conclude that analyzing paralogs using MIST can help generate hypotheses regarding the biological mechanisms of functionally related proteins or complexes.
Setting cut-off values for experimental protein interaction datasets
As introduced above, users can search MIST using a list of gene pairs, such as a list of pairs of interactors identified in a new low- or high-throughput experiment. This should be particularly useful to analyze interaction datasets obtained using large-scale approaches such as Y2H and mass spec. Specifically, MIST can help to create a reference set that can be used to choose an appropriate cut-off value for small and large-scale interactome data, and after a cutoff value is set, to recover sub-threshold biologically meaningful interactions that would otherwise be discarded as non-hits. To exemplify how MIST can be used to analyze raw high-throughput interaction data, we used MIST to re-analyze Hippo pathway interactome data from Drosophila. The source of the data was a study in which bait-prey interactions were identified by mass spec (25). Specifically, we looked at the overlap between interactions identified in the mass spec study and Drosophila data in MIST (both PPIs and interologs). We found a correlation between the mass spec SAINT score, which is a confidence score assigned to bait-prey pairs using the SAINT algorithm (26), and the fraction of pairs that overlap with data in MIST (Figure 3C). This demonstrates the potential use of MIST interolog data to create a reference set and set an appropriate cut-off value when analyzing raw interactome datasets. This analysis also revealed that 161 interactions that were considered sub-threshold based on the SAINT analysis are supported by additional evidence, which represents 79% more interactions than the published Hippo interactome (25). Thus, a considerable fraction of overlapping interactions is lost when a stringent threshold is applied. In such cases, users can supplement the high-confident interactions that pass the cutoff with an additional list of sub-threshold interactions that are supported by data in MIST (i.e. supported by the literature, by other high-throughput studies, and/or by interologs). This approach might help reduce false negative discovery without significantly impacting false positive discovery. Similarly, we also analyzed a low-confidence subset of data from a human Y2H study (27). Using MIST, we identified 1928 additional interactions that overlap with other studies or data from different species, which represents 14% more interactions than the human Y2H interactome published by this study. These analyses demonstrate that MIST can facilitate the analysis, interpretation, and prioritization of interactions identified in new large-scale studies.
MATERIALS AND METHODS
Data sources and algorithms
We downloaded interaction data from BioGrid (release: 3.4.149; (2)), IntAct (release: June 2017; (3)), FlyBase (release:FB2017_03, June 2017; (7)), HPRD (release: April 2010; (8)), DroID (release: December 2015; (6)), PomBase (release: June 2017; (9)), DIP (release: February 2017; (1)), mentha (release: 19 June 2017; (28)). We developed a series of in-house programs to: (i) parse the ftp files from each public resource; (ii) select the interactions for the 10 model organisms covered by MIST; (iii) synchronize different protein/gene identifiers to NCBI Entrez Gene IDs before integration; (iv) annotate PPIs depending on direct or indirect evidence based on the type of experimental approach. Before we integrated the interactions, we first formatted each gene/protein pair as A-B and B-A if the source database had not done so, then removed redundancy per source database. We then used DIOPT release 6.02 to map interactions among genes from different organisms. We used the most stringent filter for orthologous mapping, which identifies the best matching candidate(s). In addition, we filtered out the mappings with low rank as well as the mappings with scores lower than 3 (15). We also assigned ranks to all MIST interactions based on the number of approaches, number of publications and comparison to interologs. Interactions with more than one reference and/or more than one approach are ranked as high, while interactions that failed these criteria but have support from different species are ranked as moderate. Interologs mapped from multiple independent data from more than one species are also ranked moderate. All other interactions are ranked as low. For the pairwise comparison, the percent overlap was calculated based on the PPIs for which both genes are conserved (DIOPT score ≥ 3).
Online implementation
MIST is a Java web-based application backed by a MySQL database. We use Cytoscape.js library (17) to display network information, and DataTables.js plugin (datatables.net) for jQuery to add table pagination and sorting. Form handling and other client-side functions were written in JavaScript using the jQuery library (jquery.com). The application and database is hosted by the Research Computing group at Harvard Medical School.
CONCLUSION AND FUTURE DEVELOPMENT
Proteins function mainly through interactions with other proteins. Moreover, functionally related genes, such as paralogs or genes with similar mutant phenotypes, are more likely to interact with each other than unrelated genes. The MIST database integrates protein and GI data from multiple public resources and as such, has more coverage than any given source. Mapping data among species (i.e. identification of interologs) further improved coverage. We showed that this resource is useful for analysis of lists of genes/proteins identified through bioinformatics approaches or functional assays, and for analysis lists of gene/protein pairs identified in interaction assays. We expect that MIST will have general utility for analysis of similar gene or pair lists. MIST currently supports data from the ten most commonly used model organisms. As large datasets become available for other species, these could be easily added. In the near future, we plan to integrate more interaction types, such as drug–gene interactions, and more types of data, including protein abundance data and tissue or subcellular localization data, so that users can further prioritize interactions based on expression levels and location. We also plan to integrate gene annotation and functional predictions to help functional discovery.
AVAILABILITY
MIST is available for online use without any restrictions at http://fgrtools.hms.harvard.edu/MIST/.
Flat files and API are available at http://fgrtools.hms.harvard.edu/MIST/downloads.jsp.
Supplementary Material
ACKNOWLEDGEMENTS
We would like to thank all members of Perrimon laboratory and DRSC for suggestions, particularly Ben Ewen-Campen and Raghuvir Viswanatha for their input during manuscript preparation.
Footnotes
Present address: Ankita Nand, University of Massachusetts Medical School.
SUPPLEMENTARY DATA
Supplementary Data are available at NAR Online.
FUNDING
NIGMS [R01 GM067761, R01 GM084947]; NHGRI [R01 HG007118 to N.P., P.I.]; NCI Cancer Center Support Grant [NIH 5 P30 CA06516 to S.E.M., in part]; Howard Hughes Medical Institute (to N.P.). Funding for open access charge: NIGMS [R01 GM067761].
Conflict of interest statement. None declared.
REFERENCES
- 1. Salwinski L., Miller C.S., Smith A.J., Pettit F.K., Bowie J.U., Eisenberg D.. The Database of Interacting Proteins: 2004 update. Nucleic Acids Res. 2004; 32:D449–D451. [DOI] [PMC free article] [PubMed] [Google Scholar]
- 2. Chatr-Aryamontri A., Oughtred R., Boucher L., Rust J., Chang C., Kolas N.K., O’Donnell L., Oster S., Theesfeld C., Sellam A. et al. The BioGRID interaction database: 2017 update. Nucleic Acids Res. 2017; 45:D369–D379. [DOI] [PMC free article] [PubMed] [Google Scholar]
- 3. Orchard S., Ammari M., Aranda B., Breuza L., Briganti L., Broackes-Carter F., Campbell N.H., Chavali G., Chen C., del-Toro N. et al. The MIntAct project–IntAct as a common curation platform for 11 molecular interaction databases. Nucleic Acids Res. 2014; 42:D358–D363. [DOI] [PMC free article] [PubMed] [Google Scholar]
- 4. Orchard S., Kerrien S., Abbani S., Aranda B., Bhate J., Bidwell S., Bridge A., Briganti L., Brinkman F.S., Cesareni G. et al. Protein interaction data curation: the International Molecular Exchange (IMEx) consortium. Nat. Methods. 2012; 9:345–350. [DOI] [PMC free article] [PubMed] [Google Scholar]
- 5. Turner B., Razick S., Turinsky A.L., Vlasblom J., Crowdy E.K., Cho E., Morrison K., Donaldson I.M., Wodak S.J.. iRefWeb: interactive analysis of consolidated protein interaction data and their supporting evidence. Database (Oxford). 2010; 2010:baq023. [DOI] [PMC free article] [PubMed] [Google Scholar]
- 6. Murali T., Pacifico S., Yu J., Guest S., Roberts G.G. 3rd, Finley R.L. Jr. DroID 2011: a comprehensive, integrated resource for protein, transcription factor, RNA and gene interactions for Drosophila. Nucleic Acids Res. 2011; 39:D736–D743. [DOI] [PMC free article] [PubMed] [Google Scholar]
- 7. Gramates L.S., Marygold S.J., Santos G.D., Urbano J.M., Antonazzo G., Matthews B.B., Rey A.J., Tabone C.J., Crosby M.A., Emmert D.B. et al. FlyBase at 25: looking to the future. Nucleic Acids Res. 2017; 45:D663–D671. [DOI] [PMC free article] [PubMed] [Google Scholar]
- 8. Keshava Prasad T.S., Goel R., Kandasamy K., Keerthikumar S., Kumar S., Mathivanan S., Telikicherla D., Raju R., Shafreen B., Venugopal A. et al. Human Protein Reference Database–2009 update. Nucleic Acids Res. 2009; 37:D767–D772. [DOI] [PMC free article] [PubMed] [Google Scholar]
- 9. McDowall M.D., Harris M.A., Lock A., Rutherford K., Staines D.M., Bahler J., Kersey P.J., Oliver S.G., Wood V.. PomBase 2015: updates to the fission yeast database. Nucleic Acids Res. 2015; 43:D656–D661. [DOI] [PMC free article] [PubMed] [Google Scholar]
- 10. Szklarczyk D., Morris J.H., Cook H., Kuhn M., Wyder S., Simonovic M., Santos A., Doncheva N.T., Roth A., Bork P. et al. The STRING database in 2017: quality-controlled protein-protein association networks, made broadly accessible. Nucleic Acids Res. 2017; 45:D362–D368. [DOI] [PMC free article] [PubMed] [Google Scholar]
- 11. Zuberi K., Franz M., Rodriguez H., Montojo J., Lopes C.T., Bader G.D., Morris Q.. GeneMANIA prediction server 2013 update. Nucleic Acids Res. 2013; 41:W115–W122. [DOI] [PMC free article] [PubMed] [Google Scholar]
- 12. Hu Y., Comjean A., Perrimon N., Mohr S.E.. The Drosophila Gene Expression Tool (DGET) for expression analyses. BMC Bioinformatics. 2017; 18:98. [DOI] [PMC free article] [PubMed] [Google Scholar]
- 13. Vinayagam A., Zirin J., Roesel C., Hu Y., Yilmazel B., Samsonova A.A., Neumuller R.A., Mohr S.E., Perrimon N.. Integrating protein-protein interaction networks with phenotypes reveals signs of interactions. Nat. Methods. 2014; 11:94–99. [DOI] [PMC free article] [PubMed] [Google Scholar]
- 14. Sopko R., Foos M., Vinayagam A., Zhai B., Binari R., Hu Y., Randklev S., Perkins L.A., Gygi S.P., Perrimon N.. Combining genetic perturbations and proteomics to examine kinase-phosphatase networks in Drosophila embryos. Dev. Cell. 2014; 31:114–127. [DOI] [PMC free article] [PubMed] [Google Scholar]
- 15. Hu Y., Flockhart I., Vinayagam A., Bergwitz C., Berger B., Perrimon N., Mohr S.E.. An integrative approach to ortholog prediction for disease-focused and other functional studies. BMC Bioinformatics. 2011; 12:357. [DOI] [PMC free article] [PubMed] [Google Scholar]
- 16. Yu H., Luscombe N.M., Lu H.X., Zhu X., Xia Y., Han J.D., Bertin N., Chung S., Vidal M., Gerstein M.. Annotation transfer between genomes: protein-protein interologs and protein-DNA regulogs. Genome Res. 2004; 14:1107–1118. [DOI] [PMC free article] [PubMed] [Google Scholar]
- 17. Franz M., Lopes C.T., Huck G., Dong Y., Sumer O., Bader G.D.. Cytoscape.js: a graph theory library for visualisation and analysis. Bioinformatics. 2016; 32:309–311. [DOI] [PMC free article] [PubMed] [Google Scholar]
- 18. Vinayagam A., Hu Y., Kulkarni M., Roesel C., Sopko R., Mohr S.E., Perrimon N.. Protein complex-based analysis framework for high-throughput data sets. Sci. Signal. 2013; 6:rs5. [DOI] [PMC free article] [PubMed] [Google Scholar]
- 19. Hein M.Y., Hubner N.C., Poser I., Cox J., Nagaraj N., Toyoda Y., Gak I.A., Weisswange I., Mansfeld J., Buchholz F. et al. A human interactome in three quantitative dimensions organized by stoichiometries and abundances. Cell. 2015; 163:712–723. [DOI] [PubMed] [Google Scholar]
- 20. Hart T., Chandrashekhar M., Aregger M., Steinhart Z., Brown K.R., MacLeod G., Mis M., Zimmermann M., Fradet-Turcotte A., Sun S. et al. High-resolution CRISPR screens reveal fitness genes and genotype-specific cancer liabilities. Cell. 2015; 163:1515–1526. [DOI] [PubMed] [Google Scholar]
- 21. Diss G., Gagnon-Arsenault I., Dion-Cote A.M., Vignaud H., Ascencio D.I., Berger C.M., Landry C.R.. Gene duplication can impart fragility, not robustness, in the yeast protein interaction network. Science. 2017; 355:630–634. [DOI] [PubMed] [Google Scholar]
- 22. Reinke A.W., Baek J., Ashenberg O., Keating A.E.. Networks of bZIP protein-protein interactions diversified over a billion years of evolution. Science. 2013; 340:730–734. [DOI] [PMC free article] [PubMed] [Google Scholar]
- 23. Xi Q., He W., Zhang X.H., Le H.V., Massague J.. Genome-wide impact of the BRG1 SWI/SNF chromatin remodeler on the transforming growth factor beta transcriptional program. J. Biol. Chem. 2008; 283:1146–1155. [DOI] [PMC free article] [PubMed] [Google Scholar]
- 24. Laherty C.D., Billin A.N., Lavinsky R.M., Yochum G.S., Bush A.C., Sun J.M., Mullen T.M., Davie J.R., Rose D.W., Glass C.K. et al. SAP30, a component of the mSin3 corepressor complex involved in N-CoR-mediated repression by specific transcription factors. Mol. Cell. 1998; 2:33–42. [DOI] [PubMed] [Google Scholar]
- 25. Kwon Y., Vinayagam A., Sun X., Dephoure N., Gygi S.P., Hong P., Perrimon N.. The Hippo signaling pathway interactome. Science. 2013; 342:737–740. [DOI] [PMC free article] [PubMed] [Google Scholar]
- 26. Choi H., Larsen B., Lin Z.Y., Breitkreutz A., Mellacheruvu D., Fermin D., Qin Z.S., Tyers M., Gingras A.C., Nesvizhskii A.I.. SAINT: probabilistic scoring of affinity purification-mass spectrometry data. Nat. Methods. 2011; 8:70–73. [DOI] [PMC free article] [PubMed] [Google Scholar]
- 27. Rolland T., Tasan M., Charloteaux B., Pevzner S.J., Zhong Q., Sahni N., Yi S., Lemmens I., Fontanillo C., Mosca R. et al. A proteome-scale map of the human interactome network. Cell. 2014; 159:1212–1226. [DOI] [PMC free article] [PubMed] [Google Scholar]
- 28. Calderone A., Castagnoli L., Cesareni G.. mentha: a resource for browsing integrated protein-interaction networks. Nat. Methods. 2013; 10:690–691. [DOI] [PubMed] [Google Scholar]
- 29. Guruharsha K.G., Rual J.F., Zhai B., Mintseris J., Vaidya P., Vaidya N., Beekman C., Wong C., Rhee D.Y., Cenaj O. et al. A protein complex network of Drosophila melanogaster. Cell. 2011; 147:690–703. [DOI] [PMC free article] [PubMed] [Google Scholar]
- 30. Bandyopadhyay S., Chiang C.Y., Srivastava J., Gersten M., White S., Bell R., Kurschner C., Martin C., Smoot M., Sahasrabudhe S. et al. A human MAP kinase interactome. Nat. Methods. 2010; 7:801–805. [DOI] [PMC free article] [PubMed] [Google Scholar]
- 31. Vinayagam A., Stelzl U., Foulle R., Plassmann S., Zenkner M., Timm J., Assmus H.E., Andrade-Navarro M.A., Wanker E.E.. A directed protein interaction network for investigating intracellular signal transduction. Sci. Signal. 2011; 4:rs8. [DOI] [PubMed] [Google Scholar]
Associated Data
This section collects any data citations, data availability statements, or supplementary materials included in this article.