Abstract
Three-dimensional (3D) chromatin structure is an emerging paradigm for understanding gene regulation mechanisms. Hi-C (high-throughput chromatin conformation capture), a method to detect long-range chromatin interactions, allows extensive genome-wide investigation of 3D chromatin structure. However, broad application of Hi-C data have been hindered by the level of complexity in processing Hi-C data and the large size of raw sequencing data. In order to overcome these limitations, we constructed a database named 3DIV (a 3D-genome Interaction Viewer and database) that provides a list of long-range chromatin interaction partners for the queried locus with genomic and epigenomic annotations. 3DIV is the first of its kind to collect all publicly available human Hi-C data to provide 66 billion uniformly processed raw Hi-C read pairs obtained from 80 different human cell/tissue types. In contrast to other databases, 3DIV uniquely provides normalized chromatin interaction frequencies against genomic distance dependent background signals and a dynamic browsing visualization tool for the listed interactions, which could greatly advance the interpretation of chromatin interactions. ‘3DIV’ is available at http://kobic.kr/3div.
INTRODUCTION
Noncoding DNA, which accounts for the vast majority of human genome (>98%), is at the height of growing interest for its broad range of functional flexibility. Massive epigenomic and transcriptomic annotations of noncoding DNA in diverse cell/tissue types have been completed by ENCODE (1) and Roadmap Epigenomics (2) consortiums. Unexpectedly, these consortiums discovered mammalian genomes to be abundant in distal cis-regulatory elements (cREs), which are also enriched in many disease-associated human genetic variants (3). Nevertheless, the functional consequence of the majority of cREs is poorly understood due to the lack of information on their target genes.
Many studies have attempted to address this challenge by investigating long-range chromatin interactions, which was enabled by proximity ligation based chromosome conformation capture (3C) methods (4), as an emerging paradigm to identify distal target genes of cREs (5,6). Among them, Hi-C, one of 3C variants, became a powerful method to detect long-range chromatin interactions in a genome-wide manner (7). However, utilization of Hi-C data has been hindered by several technical difficulties, including the complexity of Hi-C data processing, requirement of massive computational resources and the large size of raw sequencing data.
In order to overcome these limitations, several databases were developed to provide pre-computed long-range chromatin interactions (8–13), but the number of samples collected and the derived information such as TADs (topologically associating domains) or the table of interaction frequencies were not sufficient for full utilization of Hi-C data for many researchers (Table 1). Besides, the lack of normalized Hi-C interaction frequencies against genomic distance dependent background signals made it difficult to precisely identify biologically meaningful long-range chromatin interactions. Finally, a better visualization system was required for researchers to intuitively understand the identified long-range chromatin interactions.
Table 1. Comparison of chromatin interaction database.
| Name of service | # of samples* | Hi-C heatmap | TAD annotation | Interaction table | Distance normalized interaction frequency | One-to-all interaction frequency | Dynamic browsing of visualization | Export and session management | Upload data or local installation | Data-type |
|---|---|---|---|---|---|---|---|---|---|---|
| 3DIV | 80 | ✓ | ✓ | ✓ | ✓ | ✓ | ✓ | ✓ | Hi-C | |
| Chrom Contact | 6 | ✓ | ✓ | Hi-C | ||||||
| HUGIN | 21 | ✓ | ✓ | ✓ | ✓ | ✓ | ✓ | Hi-C | ||
| 3Disease browser | 6 | ✓ | ✓ | ✓ | Hi-C | |||||
| Hi-View | 2 | ✓ | ✓ | ✓ | ✓ | ✓ | Hi-C | |||
| Hi-C data browser | 40 | ✓‡ | ✓ | ✓ | Hi-C, capture Hi-C, and ChIA-PET | |||||
| HiGlass | 34† | ✓ | ✓¶ | ✓ | ✓ | Hi-C | ||||
| Juicebox | 58† | ✓ | ✓¶ | ✓§ | ✓ | ✓ | Hi-C, capture Hi-C, and ChIA-PET | |||
| WashU epigenome browser | 54† | ✓ | ✓ | ✓ | Hi-C, capture Hi-C, and ChIA-PET |
*Number of samples refer to only Hi-C experiments and multiple replicates were counted as one.
†HiGlass, Juicebox and WashU epigenome browser can visualize user’s own dataset.
‡Hi-C data browser provides Hi-C heatmap on different pages.
§Juicebox does not use pre-built one-to-all interaction data, but builds one-to-all interaction track in wiggle format on demand.
¶HiGlass and Juicebox load TADs annotations separately from interaction frequency data.
In this aspect, we constructed a new database named 3DIV, which provides a list of long-range chromatin interaction partners of any queried locus. The listed interactions can be visualized using a dynamic browsing system where users can easily explore long-range chromatin interaction patterns surrounding the target of interest and compare multiple samples with synchronized modes.
MATERIALS AND METHODS
Hi-C data collection and processing
We processed 80 Hi-C samples as summarized in Supplementary Table S1. Raw Hi-C reads were aligned to the human reference genome hg19. Then cis-interactions were extracted to build raw interaction frequency matrices in 5 kb resolution. A negative binomial model-based implicit normalization pipeline removed the biases from the interaction frequency matrices. Finally, distance dependent background signal was normalized to emphasize biologically meaningful long-range chromatin interactions. Additional information for Hi-C data processing is described in Supplementary Figure S1 and Supplementary Methods.
Annotations of TADs, GWAS SNPs and epigenetic features
3DIV provides four different TAD calling options using TopDom ( ) (14) and DomainCaller (
 ) (15). Coordinates and associated phenotypes of disease associated SNPs were obtained from RegulomeDB (16). Histone ChIP-seq experiments on 38 corresponding Hi-C samples were analyzed to provide epigenetic features. ChIP-seq sample information and data processing including enhancer and super-enhancer annotations are described in Supplementary Table S2 and Supplementary Methods.
Implementation of 3DIV
3DIV was implemented in a three-tiered architecture, in which data, logic and presentation tiers (or layers) are separated (Supplementary Figure S2). The advantage of multi-tiered architecture is the elimination of the need to re-design retrieval and storage components for new database instances. Detailed description for the implementation is provided in Supplementary Methods.
3DIV ACCESS AND DISPLAY FEATURE
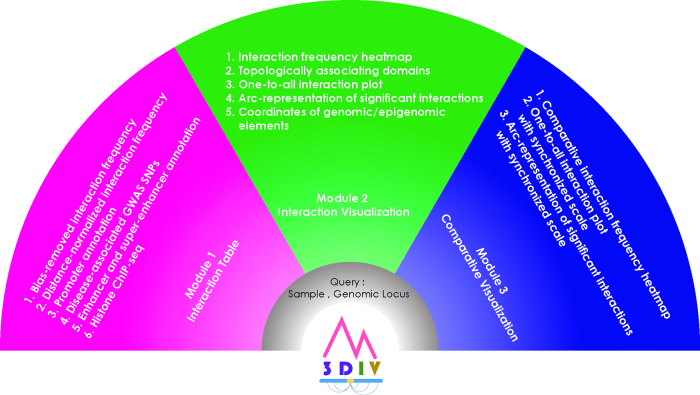
3DIV is freely available from https://kobic.kr/3div/ and is compatible with almost all modern web browsers (Mozilla Firefox 50+, Google Chrome version 37+, Microsoft Edge 38+ and Safari 10+). 3DIV consists of three modules; interaction table, interaction visualization and comparative interaction visualization (Figure 1). Interaction table module provides a list of long-range chromatin interaction partners of the queried locus in a table format. Interaction visualization module visualizes the listed interactions using various visualization schemes. Comparative visualization module visualizes the chromatin interactions of two samples in a comparative manner. These modules share an identical querying scheme (Supplementary Figure S3A) and the querying process is as follows. Users need to pass both the samples of Hi-C experiment and the locus of interest as the query. Users can select one or more sample(s) by clicking the checkbox(es) and the gene name, SNP ID or genomic coordinates as the query. When the gene name is passed as the query, 3DIV uses transcriptional start site (TSS) of the corresponding gene as the queried genomic coordinate.
Figure 1.
Functionalities of 3DIV. 3DIV consists of three major modules; interaction table, interaction visualization and comparative interaction visualization.
Interaction table
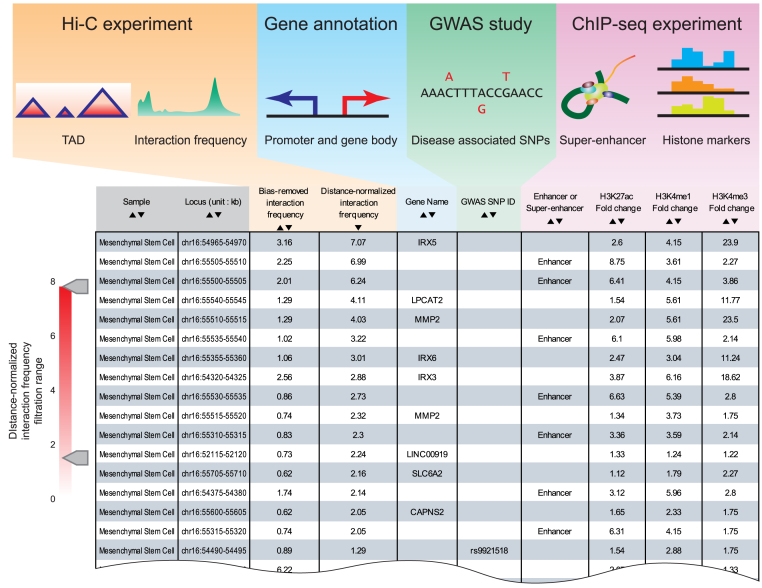
The output of interaction table module includes bias-removed interaction frequency, distance-normalized interaction frequency, annotation of promoters, disease associated GWAS SNPs, annotation of enhancers and super-enhancers, and histone ChIP-seq signals (Figure 2). Interaction table allows users to order annotations by clicking the column header or to extract interactions by distance-normalized interaction frequency using the scroll for interaction frequency filtration.
Figure 2.
Data sources and output result from interaction table module. 3DIV processed data from numerous sources including Hi-C experiments, gene annotations, GWAS studies and ChIP-seq experiments. From these processed data, 3DIV extracted chromatin interaction frequencies, annotation of promoters and gene bodies, coordinates of disease-associated SNPs, annotation of enhancer/super-enhancers and histone ChIP-seq signals. Interaction table provides a list of chromatin interaction partners for the queried locus with the aforementioned genomic/epigenomic annotations.
Visualization of chromatin interaction
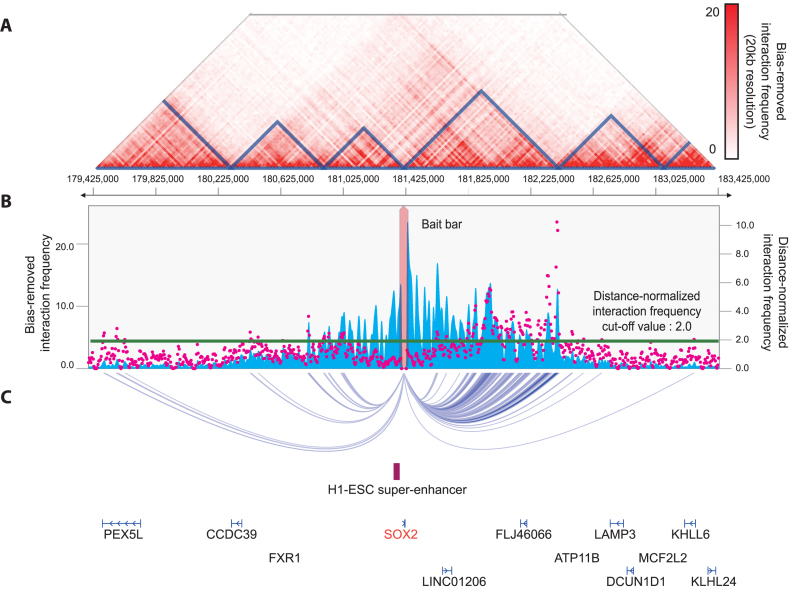
Visualization of chromatin interactions around the queried locus helps users to intuitively understand implications of the listed interactions obtained from the interaction table module. For this purpose, 3DIV provides interaction heatmap (Figure 3A), interaction frequencies with the queried locus in a form of one-to-all interaction plot (Figure 3B) and arc-representation of significant interactions (Figure 3C). Interaction heatmap also provides TAD (topologically associating domains) annotation which is specified by the TAD calling option combobox (Supplementary Figure S3A, blue rectangle). Blue bar graph and magenta dot graph in one-to-all interaction plot represent bias-removed and distance-normalized interaction frequencies, respectively. Further, the arc-representation provides visualization of significant interactions, which are defined by the threshold displayed as the green line in interaction frequency graph. Users can change the threshold value of significant interactions.
Figure 3.
Output result from interaction visualization module. (A) Shown is interaction frequency heatmap ranged from 179 425 000 to 183 425 000 of chromosome 3 in H1 embryonic stem cell. The color of the heatmap indicates the level of normalized interaction frequencies and each triangle indicates topological association domain. (B) One-to-all interaction plot is shown for SOX2 promoter region as bait. Y-axes in the left and the right indicate bias-removed interaction frequency (blue bar graph) and distance-normalized interaction frequency (magenta dots), respectively. Green line indicates the cut-off for distance-normalized interaction frequency. (C) Shown is arc-representation of significant interaction for the given cut-off value defined by the green line in (B).
Comparative visualization of chromatin interaction
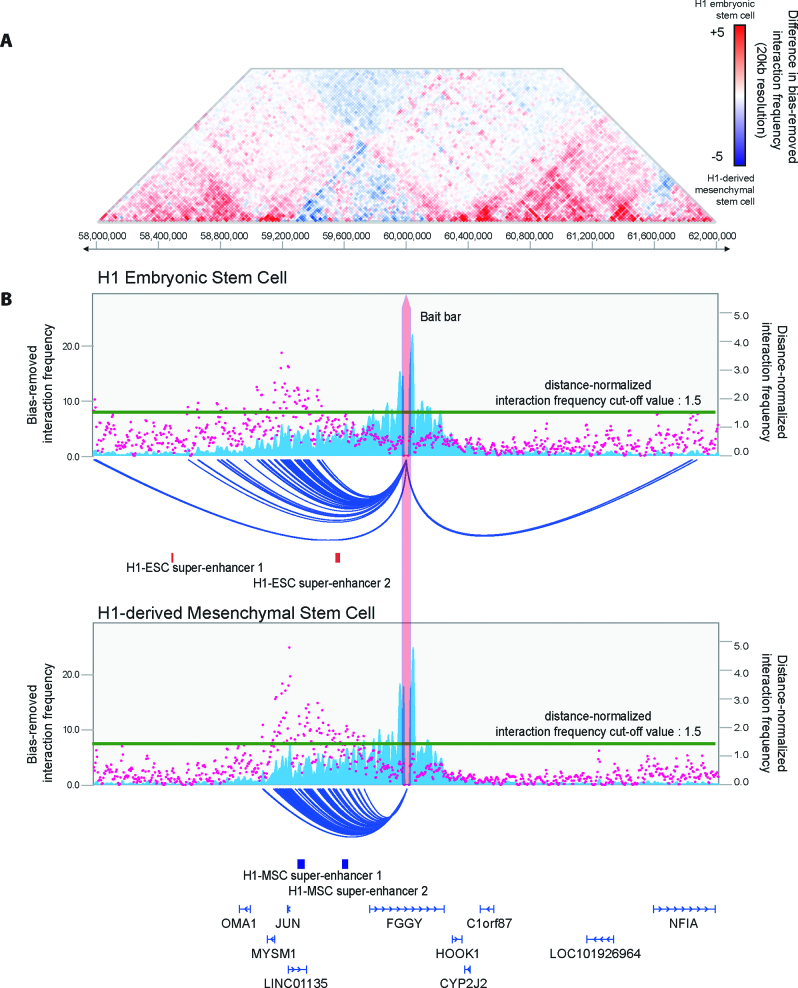
3DIV also enables users to perform comparative analysis of gain or loss of interactions between two samples by generating a comparative heatmap with automatic scale synchronization. 3DIV provides comparative interaction heatmap (Figure 4A) and one-to-all interaction plot (Figure 4B). In comparative heatmap, the cells filled by vivid red or blue indicate sample-specific interactions. One-to-all interaction plot is similar to the one generated by general interaction visualization module, except for the automatic scale synchronization. With comparative interaction visualization module and interaction frequency graphs, users can investigate dynamic long-range chromatin interactions between samples.
Figure 4.
Shown are comparative interaction frequencies around chr1:60 000 000 between H1 embryonic stem cell (H1-ESC) and H1-derived mesenchymal stem cell (H1-MSC). Key features of comparative interaction visualization are comparative interaction frequency heatmap and synchronized scale. (A) Comparative interaction heatmap visualizes differential chromatin interaction frequency near the queried locus ranged from 58 000 000 to 62 000 000 of chromosome 1 between H1 embryonic stem cell and H1-derived mesenchymal stem cell. Red and blue dots indicate chromatin interactions that are H1 embryonic stem cell-specific and H1-derived mesenchymal stem cell-specific, respectively. (B) Shown are one-to-all interaction plots for two samples. Any adjustment on one plot is synchronized to the other, as well as the cut-off for distance-normalized interaction frequency for arc-representation.
Dynamic browsing, exportation and session management
In addition, 3DIV provides user-friendly features, including dynamic browsing system, exportation of output, and session manager to save and load the result (Supplementary Figure S4). In dynamic browsing system, users can easily customize resolution or color range of heatmap by using the resolution drop-down button and color gradient bar (Supplementary Figure S4A, green rectangle). Similarly, users can dynamically browse one-to-all interaction plot and arc-representation by simply dragging the whitespace on interaction frequency graph to slide the visualization window (Supplementary Figure S4B, blue rectangle). Alternatively, users can zoom-in/out by clicking zoom-in/out button (Supplementary Figure S4A, orange rectangle) or assign the visualization window by dragging the yellow band above interaction frequency graph (Supplementary Figure S4B, orange rectangle). Moreover, users can change the queried locus by dragging the red query bar (Supplementary Figure S4B, magenta rectangle). 3DIV also provides brief genomic or epigenomic characteristics of the interaction when users specify an interaction by clicking an arc-representation of significant interaction (Supplementary Figure S4C). Additionally, users can hide and show the visualization element by clicking hide/show button (Supplementary Figure S4A, magenta rectangle). Lastly, 3DIV allows users to export the visualization result as SVG file for building publication-ready figures and save or load the result by creating a session without login or registration (Supplementary Figure S3B).
DISCUSSION
It is becoming apparent that 3D conformation of genome is more complicated than previously anticipated, but there is no doubt that it is critical to interpret the function of distal cis-regulatory elements. In this aspect, we have made efforts to provide a pre-calculated list of long-range chromatin interactions with user-friendly visualization system to be widely used in this field.
Despite the huge scale and intuitive visualization, 3DIV still has a room for expansion on supporting diverse experimental data, including ChIA-PET, capture Hi-C and single cell Hi-C, for investigation of 3D genome structure. Additionally, expansion of database to include non-human organisms, such as mouse or fly, could increase the value of 3DIV utilization. Thus, we plan to expand 3DIV to support more experimental results in multiple organisms and local installation for visualization of users’ own chromatin interaction data in the future. In summary, we have built 3DIV, a huge database of long-range chromatin interactions from all publically available human Hi-C data with an intuitive visualization system, which would assist in deciphering functions of many cis-regulatory elements.
Supplementary Material
ACKNOWLEDGEMENTS
We thank all members in Dr Jung, Dr Lee and Dr Kim’s laboratories for their comments and criticisms on this study.
Author contributions: D. Yang, I. Jang, D. Kim, I. Jung and B. Lee designed the project. D. Yang performed most of the computational analysis with A. J. Lee, H. Kim and J. Eom. I. Jang constructed most of the database with J. Choi and MS. Kim. D. Yang wrote the manuscript under supervision of D. Kim, I. Jung and B. Lee. All authors commented on the manuscript.
SUPPLEMENTARY DATA
Supplementary Data are available at NAR Online.
FUNDING
Ministry of Science, ICT and Future Planning through the National Research Foundation in Republic of Korea [2017R1C1B2008838 to I. Jung, 2012M3A9C4048758 to D. Kim, 2014M3C9A3064681 to B. Lee]; Korean Ministry of Health and Welfare [HI17C0328 to I. Jung]; KAIST new faculty research fund (to I. Jung); KRIBB Research Initiative Program [2010–0029345 to B. Lee]; Data Computing Project of KISTI-GSDC. Funding for open access charge: Ministry of Science, ICT and Future Planning through the National Research Foundation in Republic of Korea [2014M3C9A3064681 to B. Lee].
Conflict of interest statement. None declared.
REFERENCES
- 1. ENCODE Project Consortium An integrated encyclopedia of DNA elements in the human genome. Nature. 2012; 489:57–74. [DOI] [PMC free article] [PubMed] [Google Scholar]
- 2. Kundaje A., Meuleman W., Ernst J., Bilenky M., Yen A., Heravi-Moussavi A., Kheradpour P., Zhang Z., Wang J. et al. Integrative analysis of 111 reference human epigenomes. Nature. 2015; 518:317–330. [DOI] [PMC free article] [PubMed] [Google Scholar]
- 3. Maurano M.T., Humbert R., Rynes E., Thurman R.E., Haugen E., Wang H., Reynolds A.P., Sandstrom R., Qu H., Brody J. et al. Systematic localization of common disease-associated variation in regulatory DNA. Science. 2012; 337:1190–1195. [DOI] [PMC free article] [PubMed] [Google Scholar]
- 4. Dekker J., Rippe K., Dekker M., Kleckner N.. Capturing chromosome conformation. Science. 2002; 295:1306–1311. [DOI] [PubMed] [Google Scholar]
- 5. Thurman R.E., Rynes E., Humbert R., Vierstra J., Maurano M.T., Haugen E., Sheffield N.C., Stergachis A.B., Wang H., Vernot B. et al. The accessible chromatin landscape of the human genome. Nature. 2012; 489:75–82. [DOI] [PMC free article] [PubMed] [Google Scholar]
- 6. Dixon J.R., Jung I., Selvaraj S., Shen Y., Antosiewicz-Bourget J.E., Lee A.Y., Ye Z., Kim A., Rajagopal N., Xie W. et al. Chromatin architecture reorganization during stem cell differentiation. Nature. 2015; 518:331–336. [DOI] [PMC free article] [PubMed] [Google Scholar]
- 7. Lieberman-Aiden E., Van Berkum N.L., Williams L., Imakaev M., Ragoczy T., Telling A., Amit I., Lajoie B.R., Sabo P.J., Dorschner M.O. et al. Comprehensive mapping of long-range interactions reveals folding principles of the human genome. science. 2009; 326:289–293. [DOI] [PMC free article] [PubMed] [Google Scholar]
- 8. Zhou X., Wang T.. Using the Wash U Epigenome Browser to examine genome-wide sequencing data. Curr. Protoc. Bioinformatics. 2012; 40, doi:10.1002/0471250953.bi1010s40. [DOI] [PMC free article] [PubMed] [Google Scholar]
- 9. Sato T., Suyama M.. ChromContact: a web tool for analyzing spatial contact of chromosomes from Hi-C data. BMC Genomics. 2015; 16:1060. [DOI] [PMC free article] [PubMed] [Google Scholar]
- 10. Li R., Liu Y., Li T., Li C.. 3Disease Browser: a web server for integrating 3D genome and disease-associated chromosome rearrangement data. Sci. Rep. 2016; 6:34651. [DOI] [PMC free article] [PubMed] [Google Scholar]
- 11. Xu Z., Zhang G., Duan Q., Chai S., Zhang B., Wu C., Jin F., Yue F., Li Y., Hu M.. HiView: an integrative genome browser to leverage Hi-C results for the interpretation of GWAS variants. BMC Res. Notes. 2016; 9:159. [DOI] [PMC free article] [PubMed] [Google Scholar]
- 12. Durand N.C., Robinson J.T., Shamim M.S., Machol I., Mesirov J.P., Lander E.S., Aiden E.L.. Juicebox provides a visualization system for Hi-C contact maps with unlimited zoom. Cell Syst. 2016; 3:99–101. [DOI] [PMC free article] [PubMed] [Google Scholar]
- 13. Martin J.S., Xu Z., Reiner A.P., Mohlke K.L., Sullivan P., Ren B., Hu M., Li Y.. HUGIn: Hi-C unifying genomic interrogator. Bioinformatics. 2017; doi:10.1093/bioinformatics/btx359. [DOI] [PMC free article] [PubMed] [Google Scholar]
- 14. Shin H., Shi Y., Dai C., Tjong H., Gong K., Alber F., Zhou X.J.. TopDom: an efficient and deterministic method for identifying topological domains in genomes. Nucleic Acids Res. 2016; 44:e70. [DOI] [PMC free article] [PubMed] [Google Scholar]
- 15. Dixon J.R., Selvaraj S., Yue F., Kim A., Li Y., Shen Y., Hu M., Liu J.S., Ren B.. Topological domains in mammalian genomes identified by analysis of chromatin interactions. Nature. 2012; 485:376–380. [DOI] [PMC free article] [PubMed] [Google Scholar]
- 16. Boyle A.P., Hong E.L., Hariharan M., Cheng Y., Schaub M.A., Kasowski M., Karczewski K.J., Park J., Hitz B.C., Weng S. et al. Annotation of functional variation in personal genomes using RegulomeDB. Genome Res. 2012; 22:1790–1797. [DOI] [PMC free article] [PubMed] [Google Scholar]
Associated Data
This section collects any data citations, data availability statements, or supplementary materials included in this article.


