

Abstract
Background
The unisexual Amazon molly (Poecilia formosa) originated from a hybridization between two sexual species, the sailfin molly (Poecilia latipinna) and the Atlantic molly (Poecilia mexicana). The Amazon molly reproduces clonally via sperm-dependent parthenogenesis (gynogenesis), in which the sperm of closely related species triggers embryogenesis of the apomictic oocytes, but typically does not contribute genetic material to the next generation. We compare for the first time the gonadal transcriptome of the Amazon molly to those of both ancestral species, P. mexicana and P. latipinna.
Results
We sequenced the gonadal transcriptomes of the P. formosa and its parental species P. mexicana and P. latipinna using Illumina RNA-sequencing techniques (paired-end, 100 bp). De novo assembly of about 50 million raw read pairs for each species was performed using Trinity, yielding 106,922 transcripts for P. formosa, 115,175 for P. latipinna, and 133,025 for P. mexicana after eliminating contaminations. On the basis of sequence similarity comparisons to other teleost species and the UniProt databases, functional annotation, and differential expression analysis, we demonstrate the similarity of the transcriptomes among the three species. More than 40% of the transcripts for each species were functionally annotated and about 70% were assigned to orthologous genes of a closely related species. Differential expression analysis between the sexual and unisexual species uncovered 2035 up-regulated and 564 down-regulated genes in P. formosa. This was exemplary validated for six genes by qRT-PCR.
Conclusions
We identified more than 130 genes related to meiosis and reproduction within the apomictically reproducing P. formosa. Overall expression of these genes seems to be down-regulated in the P. formosa transcriptome compared to both ancestral species (i.e., 106 genes down-regulated, 29 up-regulated). A further 35 meiosis and reproduction related genes were not found in the P. formosa transcriptome, but were only expressed in the sexual species. Our data support the hypothesis of general down-regulation of meiosis-related genes in the apomictic Amazon molly. Furthermore, the obtained dataset and identified gene catalog will serve as a resource for future research on the molecular mechanisms behind the reproductive mode of this unisexual species.
Electronic supplementary material
The online version of this article (10.1186/s12864-017-4382-2) contains supplementary material, which is available to authorized users.
Keywords: Differential gene expression, Gynogenesis, Hybrid speciation, Meiosis, Poecilia formosa, Poecilia latipinna, Poecilia mexicana
Background
Sexual reproduction is the most common form of reproduction in the animal kingdom, and only 0.1% of all animal species reproduce asexually [1]. Compared to asexual reproduction, sexual reproduction enables genetic recombination, but seems otherwise to be less efficient and exhibits profound costs, like the two-fold costs of males [2]. The evolution, persistence and underlying molecular mechanisms of both sexual and asexual reproduction are therefore central topics of evolutionary biology [3, 4]. In sexually reproducing eukaryotes, meiosis, the reduction division of diploid germ cells to generate haploid gametes such as sperm, eggs, and pollen, is an essential process. After fertilization, zygotes are created by incorporating the genetic material of both sexes, restoring the original ploidy level. This is in contrast to some asexual species, including the Amazon molly (Poecilia formosa) where no meiotic cell cycle takes place and the gametes are produced via mitosis [5]. There are several variants and types of asexual reproduction, but we will focus here on the prevalent type in vertebrates, which is parthenogenesis. In many species with parthenogenesis, meiosis is lacking (apomixis) and oocytes do not undergo a reduction division leading to diploid eggs [6]. Consequently, offspring are genetically identical to the mother. In vertebrates, this phenomenon is found in fishes, amphibians, and reptiles and only known for species of hybrid origin [7], shedding light on the role of hybridization in functional aspects of biology, and in particular in hybrid speciation. These unisexual vertebrates are used as model organisms to understand the origin and maintenance of sexual reproduction and meiosis. However, the underlying mechanisms driving asexuality, as well as the mechanisms of the transition from sexuality to asexuality, are still unclear.
Meiosis and sexual reproduction seem to have arisen very early in eukaryotic evolution and therefore vertebrate asexual lineages originated from sexual relatives [8]. Schurko and Logsdon Jr. [9] propose that the presence of a set of multiple genes required specifically for meiosis is indicative of the capability of an organism to undergo meiosis and should imply sexual reproduction. In the genome of an apomictic species, these genes should be obsolete and undergo genomic decay to the point where they are dysfunctional. Alternatively, they may evolve other functions. Meiosis genes were detected even in the putative ancient asexual protists Giardia intestinalis [8] and Trichomonas vaginalis [10]. Recently evolved asexual species, such as apomictic hybrid species provide an excellent model to investigate the evolution of meiosis-related genes under presumably relaxed selective constraints and can help to understand the transition from sexuality to asexuality. The unisexual hybrid species P. formosa and its bisexual, parental species are a particularly suitable model to investigate differences between sexually and asexually reproducing species and to determine relevant genes for the underlying processes.
P. formosa derived its common name ‘Amazon molly’ from a mythological Greek tribe of warrior women, the Amazons. It is an all-female species [11] with a natural distribution in the coastal areas along Northeastern Mexico and Southern Texas [12]. It reproduces clonally by sperm-dependent parthenogenesis, i.e., gynogenesis [13, 14]. Although this is a mode of asexual reproduction, gynogenesis does involve the mating of a female with a male from a different species (pseudo-fertilization) [15]. P. formosa evolved by hybridization of two sexually reproducing species, the Atlantic molly Poecilia mexicana (maternal) and the sailfin molly Poecilia latipinna (paternal) [16–18], and originated around 280, 000 years ago [19]. Both ancestral species [11] and the very closely related Tamesí molly (Poecilia latipunctata) [20] can act as sperm donors for P. formosa to initiate embryogenesis of the diploid apomictically produced oocytes [21, 22]. P. formosa progeny are identical copies (clones) of the mother, since the genetic material of the sperm donors does not contribute to the offspring except in very rarely occurring events of paternal introgression [23, 24], when parts of or the complete genetic material of the sperm introgresses and is passed on to subsequent generations, leading to polyploid or microchromosome-bearing lineages [25]. In the family Poeciliidae, like in other live-bearing fishes, insemination takes place by introducing the sperm via a copulatory organ, the modified primary anal fin (gonopodium), to the reproductive tract of the females [26]. Therefore, P. formosa must occur in sympatry with at least one of the species acting as sperm donors to be able to mate and subsequently reproduce [7]. This behavior has been described as sexual parasitism, given that the males gain no apparent benefits from mating with the heterospecific P. formosa [27], except under mate copying scenarios described by Schlupp et al. [28] and Heubel et al. [29].
In this study, we focus on the detection of genes that encode components specific for reproduction and meiosis. The presence or absence of functional (i.e., expressed) copies of these genes is evaluated by comparative transcriptome analyses of the unisexual Amazon molly P. formosa and its parental bisexual species. Such analysis can help to resolve the underlying molecular processes between the two reproduction modes and their evolution. Transcriptomics are a common tool for identifying genes of interest (candidate genes) for diverse research topics [30] and are particularly suitable to discover unique and shared genes/gene expression among closely related species [31, 32]. Here, we describe and characterize the transcriptome of a hybrid vertebrate, P. formosa, in comparison to both ancestral sexual species, P. latipinna and P. mexicana, generated by high-throughput sequencing of RNA from the gonads. The identification of more than 100 expressed genes related to reproduction, especially the meiotic cell cycle, in an apomictic species is remarkable and will provide a valuable genomic resource for future studies.
Methods
Sample preparation and next generation sequencing
To construct the transcriptomes of all three species (P. formosa, P. mexicana, and P. latipinna) the gonadal RNA of three females per species was sequenced with next-generation sequencing methods. These fish were taken from strains kept and bred at the University of Potsdam (Germany). The founder individuals of P. formosa (strain For III/9) were collected at Río Purificación (Barretal, Tamaulipas, Mexico) in 1993, P. latipinna (strain F.O II/7 1355) at Key Largo (Florida, USA) in 1993, and P. mexicana (strain Mex IV/5) at Laguna de Champaxan (Altamira, Tamaulipas, Mexico) in 1994. The fish were kept under standard conditions (12:12 h light-dark cycle at 25 °C) at the University of Potsdam in compliance with German animal welfare regulations. Two months before tissue collection (which took place in 2013), sexually mature females of each species were isolated into separate tanks to avoid gene expression shifts due to interactions with males. Before sacrificing the fish on ice, the sex and species affiliation of each individual was verified by examining the anal fin structure and the dorsal fin ray number, respectively. The excised gonads were immediately frozen in liquid nitrogen and stored at −80 °C. For RNA extraction, a combination of Trizol (Life Technologies) and the RNeasy Mini Kit (Qiagen) extraction methods was performed, including a genomic DNA removal protocol. Detailed instructions for the tissue collection and RNA isolation procedure can be found in Zhu et al. [33]. The total yield of RNA was calculated by measuring the concentration and purity using a Spectrophotometer (NanoDrop 1000; ThermoScientific) and the RNA isolates of three individuals per species were pooled for library preparation. A commercial sequencing provider (LGC Genomics GmbH, Berlin) performed transcriptomics library preparation and sequencing (100 bp, paired-end) of all three libraries on one channel of an Illumina HiSeq2000, as well as demultiplexing and adapter clipping (Casava v1.8.2; Illumina Inc.).
Preprocessing – Quality control, filtering and trimming
The initial processing of the data included quality control, filtering, and trimming of the raw reads. After controlling the quality of the obtained paired-end reads with the FastQC software (v0.11.2) [34], we used Trimmomatic (v0.32) [35] to perform different filtering and trimming steps. First, all reads containing an unknown base character (`N`) were removed. Second, bases which showed a low quality at the start or end of the read were cut off (leading/trailing). Third, the sliding window algorithm scanned the reads with a specific base wide sliding window (4 bp), which cut off when the average quality per base dropped below an average quality threshold (15). After trimming, the potentially present ribosomal RNA (rRNA) fragments were excluded from the dataset with SortMeRNA (v2.0) [36]. This software filters and removes rRNA by comparing the reads with clustered rRNA sequence databases of the small and large subunits of bacteria, eukaryotes, and archaea, compiled with the data of the SILVA project [37].
De novo assembly and removal of contamination
We initially built the transcriptomes on the basis of two strategies, de novo and genome-guided with the genome of P. formosa as reference genome (Ensemble release 2014) [38]. Recently, it has been argued that reference genomes are not always well suited as references for RNA sequencing experiments, unless they have been re-annotated before [39, 40]. Indeed, our assembly statistics and functional annotations for the reference-guided assemblies were not as good as the individual de novo assemblies for the three species. Therefore, we used the de novo assemblies for all subsequent analyses. The assembly of the trimmed and filtered reads was done with the software package Trinity (r20140717 to v2.2.0) [41] with standard parameters. Trinity is a widely used assembler based on the method of de Bruijn graphs for the reconstruction of transcriptomes de novo or genome-guided from RNA sequencing data. The Trinity assembler comprises three major consecutive software modules: First, reads were combined into larger contigs (by Inchworm), second, these contigs were clustered into components (by Chrysalis), and finally the most plausible sets of transcripts from these groups were produced (by Butterfly). Downstream analyses, e.g., to calculate quality statistics of the transcriptomes were conducted with the associated software tools of Trinity using Bowtie2 (v2.2.24) [42], SAMtools (v1.3) [43], and RSEM [44]. All sequence comparisons were conducted with the Basic Local Alignment Search Tool (BLAST) (v2.3.0+ and v2.6.0+) [45]. To identify potential contaminants within the assemblies, the transcripts of all the species were compared to protein sequence databases of four different non-target taxa (archaea, bacteria, fungi, and invertebrates) in UniProt (Swiss-Prot/TrEMBL release 2014_10) [46]. Beforehand, each taxonomic database was clustered by removing redundant sequences with 95% identity (CD-Hit v4.6.1) [47]. Transcripts which had a match were compared against a protein database of Danio rerio (TrEMBLE release 2014_10) to ensure that only real contaminants were eliminated from further analyses, while transcripts showing a high similarity with a fish sequence database were retained. Also, transcripts missing an open reading frame (ORF) were removed. ORF identification was achieved using the web server of OrfPredictor (v2.3) [48].
Annotation and comparative analyses
Classification of gene ontology (GO) terms into the categories “biological process”, “cellular components”, and “molecular functions” associated with a given gene product was carried out with the standalone graphical user interface (GUI) version of GOblet (v0.2.1) [49]. Based on sequence similarities and comparisons to well-annotated proteins from UniProt databases, the contigs of all three species were annotated with terms from the Gene Ontology project [50]. Only records with evidence codes assigned by curators of the GO Consortium from the UniProt/Swiss-Prot databases (release 2015_06) of humans, rodents, vertebrates, and mammals were chosen with an E-value cut-off of 1e−10, while those inferred solely from electronic annotation (IEA) were not considered. For each assembly, the frequencies of occurrence for the 150 generic GO slim terms (www.geneontology.org/ontology/subsets/) were calculated. The generic GO slim terms developed by the GO Consortium contain those GO terms, which show a high biological relevance and cover most of the genes/proteins annotated for all species in the database. Species-specific over- and under-representation of the GO terms was tested with a Fisher’s exact test (α = 0.05) with false discovery rate (FDR) correction of the p-value.
We conducted several sequence comparisons with different protein, genomic, and complementary DNA (cDNA) datasets of teleost fish species (Additional file 1: Table S1; E-value cut-off: 1e−50) [51] and the UniProt/Swiss-Prot database (release 2015_03; E-value cut-off: 1e−20) using the BLAST algorithm. For the identification of candidate genes relevant to our focus on sexual vs. asexual reproduction, the results were scanned for genes known to be involved in meiosis [8–10, 52, 53]. Furthermore, transcripts were translated to amino acid sequences with a minimum length of 70, using the Transdecoder pipeline (v3.0.2; http://transdecoder.github.io), which identifies coding regions and detects the longest ORF for every transcript in combination with homology results from the Swiss-Prot database (E-value cut-off: 1e-5) and Hmmer (v3.1b2) [54], which searches the peptides for protein domains against the pfam database (release 30.0) [55], a collection of protein family alignments. These sets of amino acid sequences were further analyzed by the OrthoFinder pipeline (v1.1.4) [56] to identify orthogroups of the three assemblies, using the Poecilia reticulata proteome as reference [57]. Afterward, the orthogroups were annotated with GOblet and analyzed specifically with regard to differences between the unisexual P. formosa and the three sexual species (P. latipinna, P. mexicana, and P. reticulata).
Differential expression
Processed reads of each species were mapped back to the combined transcripts of all three species with Bowtie2 using strict mapping parameters (no-discordant | no-mixed | score-min L,-0.1,-0.1). Then, the transcripts were clustered with Corest (v1.06) [58] and for each gene cluster, the number of mapped reads of each species was compiled. Based on the clustering, differential expression between the unisexual (P. formosa) and sexual (P. mexicana and P. latipinna) species was analyzed for gene clusters with transcripts occurring in all three species using edgeR [59]. Because of the absence of a second (replicate) unisexual species, the dispersion value was set to 0.1 as recommended in the manual and statistical significance of inferred up- and down-regulated genes was not evaluated. Up- and down-regulated genes were annotated with GOblet (v0.2.2). For specific parent GO terms and all their child-terms, all entries were manually scanned to identify further candidate genes to be differentially expressed under unisexual vs. sexual reproduction. For six genes related to the androgen receptor pathway, we obtained gene-specific expression data produced by quantitative real-time RT-PCR (abbreviated as qRT-PCR; data from [33]), originating from the same RNA isolates used for our transcriptome analysis. These gene-specific expression levels were used to exemplary validate differential expression of the respective genes derived from the transcriptome data.
Results
Next generation sequencing and de novo assembly
The sequencing of the three individuals from each species, pooled into one library on one lane of an Illumina HiSeq2000 (paired-end, 100 bp), yielded 115,183,830 raw reads for the Amazon molly P. formosa, 117,678,742 for the sailfin molly P. latipinna, and 100,309,634 for the Atlantic molly P. mexicana (Table 1). The quality control with FastQC showed that the Phred quality was lower in the first three base pairs of the reads, as well as at the end. After adapter clipping and trimming, the number of read pairs was 56,916,341 for P. formosa, 58,302,260 for P. latipinna, and 49,722,788 for P. mexicana. The reads had an average length of 94 bp for P. formosa and 95 bp for P. latipinna and P. mexicana. The average Phred quality of the reads was about 36 (Table 1). Before the assembly, the read pairs which presented potential rRNA fragments were removed with SortMeRNA (0.49% for P. formosa | 0.85% for P. latipinna | 0.89% for P. mexicana). The processed reads for all three species can be obtained from the Sequence Read Archive (SRA) at the National Center for Biotechnology Information (NCBI) (BioProject: PRJNA385580 - P. formosa: SAMN06894540 | P. latipinna: SAMN06894541 | P. mexicana: SAMN06894542).
Table 1.
Transcriptome sequencing results (100 bp, single end)
| Species | Poecilia formosa | Poecilia latipinna | Poecilia mexicana |
|---|---|---|---|
| Raw reads | 115,183,830 | 117,678,742 | 100,309,634 |
| Adapter clipped reads | 115,141,762 | 117,644,190 | 100,280,696 |
| Adapter clipped read pairs | 57,570,881 | 58,822,095 | 50,140,348 |
| Total bases | 29,987,059,554 | 30,641,028,948 | 26,118,870,016 |
| Total read pairsa | 56,916,341 | 58,302,260 | 49,722,788 |
| Average read lengtha | 94 | 95 | 95 |
| Average Phred qualitya | 35.7 | 35.8 | 35.9 |
a: After trimming
The de novo assembly for the three read sets was conducted with the Trinity assembler (Table 2). The average contig length for the 108,690 transcripts for P. formosa was 1077 bp, for P. latpinna there were 117,211 transcripts with an average length of 1232 bp, and for P. mexicana the average length was 1365 bp across 135,217 transcripts (Additional file 2: Figure S1). The weighted median length of the transcripts (N50 value) was 1764 bp for P. formosa, 2339 bp for P. latipinna, and 2569 bp for P. mexicana. By comparisons with the four clustered databases of archaea, bacteria, fungi and invertebrates (clustering reduction: bacteria 81%, archaea 27%, fungi and invertebrates 32%) from UniProt (Swiss-Prot/TrEMBL), we detected 1106 (1.02%) possible contaminants among P. formosa transcripts, 1160 (0.99%) in P. latipinna and 1209 (0.89%) in P. mexicana, mostly belonging to invertebrates. ORFs were missing in 0.61% of the transcripts of P. formosa, 0.75% in P. latipinna, and 0.73% in P. mexicana. In total 1768 (1.63%) contigs for P. formosa, 2035 (1.74%) for P. latipinna, and 2192 (1.62%) for P. mexicana were excluded from the transcriptome datasets used for further analysis, either as contaminants or because of a lacking ORF.
Table 2.
Statistics for the de novo assembly
| Species | Poecilia formosa | Poecilia latipinna | Poecilia mexicana |
|---|---|---|---|
| Transcripts | 108,690 | 117,211 | 135,217 |
| Components | 59,935 | 73,450 | 79,522 |
| Total number of base pairs | 117,095,092 | 144,420,105 | 184,588,701 |
| Average contig length (bp) | 1077 | 1232 | 1365 |
| Median contig length (bp) | 682 | 625 | 713 |
| N50 (bp) | 1764 | 2339 | 2569 |
Comparative analysis and identification of candidate genes
Functional gene annotation with the GOblet software yielded 47,719 transcripts assigned to GO terms for P. formosa (44.63%), 46,157 (40.08%) for P. latipinna, and 55,659 (41.84%) for P. mexicana, based on sequence similarity comparisons with the UniProt/Swiss-Prot databases of vertebrates, rodents, human, and mammals (total entries: 47,483). In total, 19,227 different GO terms were detected among all three transcriptomes; 18,531 of these were shared between all three species (total number of GO terms for P. formosa: 18,856 | P. latipinna: 18,807 | P. mexicana: 19,019); 85 GO terms are unique for the P. formosa (70 transcripts) assembly (Fig. 1). The relative frequency of found generic GO slim terms was similar for all three species. Significant differences for the GO terms enrichment analysis between the species could be found for 32 GO terms between P. formosa and P. mexicana and for 17 GO terms between P. formosa and P. latipinna (Fig. 2), six of which were significantly different to the unisexual P. formosa in both sexual species (i.e., “immune system process”, “cellular amino acid metabolic process”, “signal transduction”, “cell-cell-signalling”, “biosynthetic process”, and “lyase activity”). The GO enrichment analysis for the detected GO terms for each species (Additional files 3, 4 and 5: Figures S2, S3, S4) did not reveal any differences among the three species.
Fig. 1.
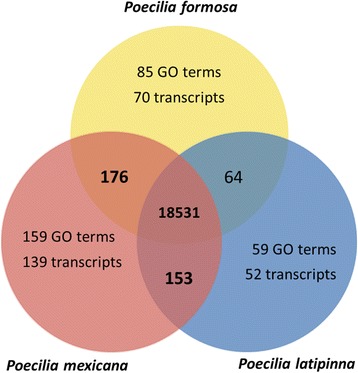
Venn diagram of unique and shared gene ontology (GO) terms for the three species Total numbers of identified GOs unique for each species and shared among species; for GOs unique to a species, the respective number of transcripts are specified
Fig. 2.
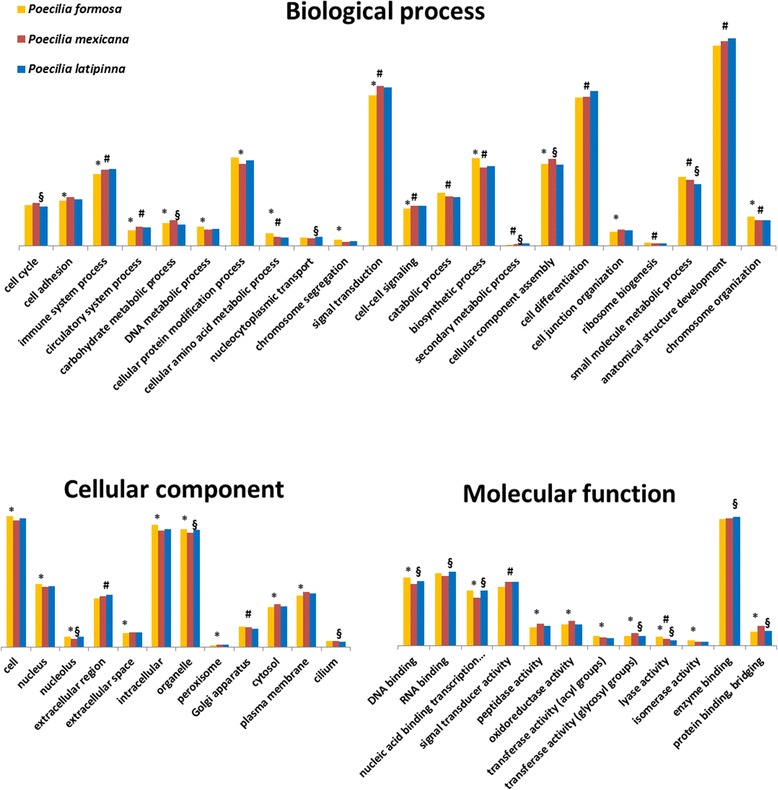
Occurrence of the represented generic GO slim terms (proportional to the total number) within the annotated transcriptomes of the Amazon molly (P. formosa) and its ancestral species P. latipinna and P. mexicana for the three main categories “Biological process”, “Cellular component” and “Molecular function”. Significant differences (one sided Fisher-Test; p < 0.05 corrected for multiple testing via Benjamini-Hochberg) between the species are labelled as * for P. formosa/P. mexicana; # for P. formosa/P. latipinna and § for P. latipinna/P. mexicana
Sequence comparisons among teleost fish included our three species, two additional species from the family Poeciliidae, i.e., the guppy (P. reticulata) and the common platy (Xiphophorus maculatus), and two well-annotated model organisms, the Japanese medaka (Oryzias latipes) and the zebrafish (D. rerio) (Table 3). In comparison with the two model species, the three assemblies showed similar results. P. formosa had a slightly higher congruency with the entire Swiss-Prot database (52.45%) in comparison with P. latipinna and P. mexicana (46.48% and 48.54%, respectively). All BLAST results were scanned for 108 meiosis-related genes obtained from the literature and databases, 46 of these genes are specific to the meiotic cell cycle (Table 4). Three common housekeeping genes [60, 61], the gene for the TATA-box binding protein (tbp), the hypoxanthine phosphoribosyl transferase 1 (hprt1), and Beta-actin (actb), were inspected and found to be equally present in all three species in terms of the number of counts. Out of the 108 meiosis-related genes, only the stra8 gene and the meiosis-specific hormad2 gene could not be detected in any of the assemblies of our study species. Four other genes were not found for P. formosa: the ccnB1ip gene, the xycp1 gene and two meiosis-specific genes (rad51B and rec114). In total 1335 transcript counts of meiosis-related genes were discovered for P. formosa, markedly fewer than the 2313 counts for P. mexicana and 2054 for P. latipinna.
Table 3.
Summary of BLAST comparisons
| Taxa | Entries | BLAST algorithm | Poecilia formosa | Poecilia latipinna | Poecilia mexicana | |
|---|---|---|---|---|---|---|
| Poecilia formosa | cDNA | 30,958 | tblastx | 67,957 (63.56%) | 63,547 (55.17%) | 74,800 (56.23%) |
| DNA | 3985 | blastn | 106,300 (99.4 2%) | 114,516 (99.43%) | 131,651 (98.97%) | |
| protein | 30,898 | blastx | 49,267 (46.08%) | 48,170 (41.82%) | 58,574 (44.03%) | |
| Poecilia mexicana | DNA | 18,105 | blastn | 106,151(99.28%) | 113,876 (98.87%) | 131,866 (99.13%) |
| protein | 47,406 | blastx | 51,032 (47.73%) | 49,608 (43.07%) | 60,442 (45.44%) | |
| Poecilia latipinna | DNA | 17,988 | blastn | 106,127 (99.26%) | 114,721 (99.61%) | 130,691 (98.25%) |
| protein | 47,072 | blastx | 51,096 (47.79%) | 49,757 (43.20%) | 60,227 (45.27%) | |
| Poecilia reticulata | DNA | 43,715 | blastn | 49,894 (47.73%) | 48,762 (42.34%) | 59,326 (44.60%) |
| protein | 2768 | blastx | 100,357 (93.86%) | 107,025 (92.92%) | 122,599 (92.13%) | |
| Xiphophorus maculatus | cDNA | 20,482 | tblastx | 67,957 (63.56%) | 63,547 (55.17%) | 74,800 (56.23%) |
| DNA | 20,632 | blastn | 106,300 (99.42%) | 114,516 (99.43%) | 131,651 (98.97%) | |
| protein | 20,454 | blastx | 49,267 (46.08%) | 48,170 (41.82%) | 58,574 (44.03%) | |
| Oryzias latipes | cDNA | 24,675 | tblastx | 39,246 (36.71%) | 40,351 (35.03%) | 49,354 (37.10%) |
| DNA | 7189 | blastn | 15,343 (14.35%) | 16,805 (14.59%) | 21,320 (16.03%) | |
| protein | 24,674 | blastx | 38,139 (35.67%) | 38,839 (33.72%) | 47,559 (35.75%) | |
| Danio rerio | cDNA | 48,435 | tblastx | 37,939 (35.48%) | 39,132 (33.98%) | 47,942 (36.04%) |
| DNA | 1133 | blastn | 2155 (2.02%) | 3066 (2.66%) | 4005 (3.01%) | |
| protein | 43,153 | blastx | 37,216 (34.81%) | 38,463 (33.40%) | 46,709 (35.11%) | |
| Swiss-Prot | protein | 547,964 | blastx | 56,085 (52.45%) | 53,528 (46.48%) | 64,569 (48.54%) |
For each taxon, we show the number of the sequences of the cDNA/DNA (toplevel) and protein databases, the BLAST algorithm used, and the percentage of matched sequences. cDNA resources were utilized when available for the respective species
Table 4.
Genes associated with meiosis, their Uniprot accession ID and the number of the corresponding transcripts in the Amazon molly (P. formosa: Pfor), the Sailfin molly (P. latipinna: Plat) and Atlantic molly (P. mexicana: Pmex) transcriptomes
| Gene | Description | Accession number | Number of transcripts | ||
|---|---|---|---|---|---|
| Pfor | Pmex | Plat | |||
| ago1 | Argonaute 1, Eukaryotic translation initiation factor 2C 1 | Q8CJG1 | 7 | 13 | 10 |
| ago2 | Argonaute 2, Eukaryotic translation initiation factor 2C 2 | Q8CJG0 | 12 | 24 | 20 |
| ago3 | Argonaute 3, Eukaryotic translation initiation factor 2C 3 | Q9H9G7 | 31 | 38 | 55 |
| ago4 | Argonaute 4, Eukaryotic translation initiation factor 2C 4 | Q9HCK5 | 20 | 16 | 21 |
| ccnA1 | Cyclin-A1 | Q92161 | 4 | 2 | 9 |
| ccnA2 | Cyclin-A2 | P30274 | 3 | 4 | 6 |
| ccnB1ip1 | Cyclin B1 interacting protein 1 | Q9NPC3 | 0 | 1 | 1 |
| ccnC | Cyclin-C | Q28F72 | 3 | 3 | 5 |
| cdk1 | Cell division protein kinase/Cyclin-dependent kinase 1 | Q9DG98 | 38 | 73 | 52 |
| cdk2 | Cell division protein kinase/Cyclin-dependent kinase 2 | P43450 | 8 | 23 | 5 |
| cdk4 | Cyclin-dependent kinase 4 | Q91727 | 12 | 3 | 5 |
| cdk7 | Cyclin-dependent kinase 7 | P51953 | 4 | 2 | 3 |
| cdk10 | Cell division protein kinase/Cyclin-dependent kinase 10 | Q2TBL8 | 4 | 7 | 5 |
| cdk14 | Cell division protein kinase/Cyclin-dependent kinase 14 | B0VXL7 | 59 | 173 | 110 |
| cdk16 | Cell division protein kinase/Cyclin-dependent kinase 16 | Q00536 | 19 | 19 | 9 |
| dmc1* | Meiotic recombination protein DMC1 | Q61880 | 1 | 3 | 2 |
| fkbp6* | Inactive peptidyl-prolyl cis-trans isomerase FKBP6 | Q91XW8 | 1 | 1 | 2 |
| hfm1 | Probable ATP-dependent DNA helicase HFM1 | A2PYH4 | 14 | 41 | 27 |
| hormad1* | HORMA domain-containing protein 1 | Q86X24 | 3 | 2 | 2 |
| hormad2* | HORMA domain-containing protein 2 | Q8N7B1 | 0 | 0 | 0 |
| m1ap | Meiosis 1 arrest protein | Q9Z0E1 | 67 | 44 | 65 |
| majin* | Membrane-anchored junction protein | Q9D992 | 11 | 28 | 18 |
| marf1 | Meiosis arrest female protein 1 | Q8BJ34 | 16 | 29 | 12 |
| mcm2 | DNA helicase MCM2, Minichromosome maintenance protein 2 | Q6DIH3 | 13 | 29 | 8 |
| mcm3 | DNA helicase MCM3, Minichromosome maintenance protein 3 | Q5ZMN2 | 3 | 9 | 11 |
| mcm4 | DNA helicase MCM4, Minichromosome maintenance protein 4 | P33991 | 2 | 2 | 4 |
| mcm4B | Minichromosome maintenance protein 4-B | P30664 | 1 | 1 | 2 |
| mcm5 | DNA helicase MCM5, Minichromosome maintenance 5 | Q561P5 | 9 | 20 | 9 |
| mcm6 | DNA helicase MCM6, Minichromosome maintenance 6 | Q14566 | 4 | 10 | 11 |
| mcm7 | DNA helicase MCM7, Minichromosome maintenance 7 | Q6NX31 | 1 | 2 | 1 |
| mcm8 | DNA helicase MCM8, Minichromosome maintenance 8 | Q9UJA3 | 20 | 74 | 21 |
| mcm9 | DNA helicase MCM9, Minichromosome maintenance 9 | Q6NRM6 | 16 | 50 | 14 |
| mei1* | Meiosis inhibitor protein 1 | Q5TIA1 | 28 | 55 | 64 |
| mei4* | Meiotic double-stranded break formation protein 4 | Q8BRM6 | 17 | 41 | 56 |
| meiob* | Meiosis-specific with OB domain-containing protein | Q9D513 | 6 | 4 | 15 |
| meioc* | Meiosis-specific coiled-coil domain-containing protein | A2AG06 | 3 | 4 | 5 |
| mlh1* | DNA mismatch repair protein Mlh1, MutL protein homolog 1 | P40692 | 11 | 15 | 10 |
| mlh3* | DNA mismatch repair protein Mlh3, MutL protein homolog 3 | Q9UHC1 | 9 | 14 | 6 |
| mnd1* | Meiotic nuclear division protein 1 homolog | Q32L19 | 40 | 183 | 80 |
| mns1* | Meiosis-specific nuclear structural protein 1 | Q6PBA8 | 6 | 6 | 4 |
| mre11 | Double-strand break repair protein MRE11 | Q9W6K1 | 9 | 6 | 6 |
| msh2* | DNA mismatch repair protein Msh2, MutS protein homolog 2 | Q5XXB5 | 18 | 29 | 31 |
| msh3* | DNA mismatch repair protein Msh3, MutS protein homolog 3 | P20585 | 15 | 37 | 33 |
| msh4* | DNA mismatch repair protein Msh4, MutS protein homolog 4 | O15457 | 5 | 1 | 6 |
| msh5* | DNA mismatch repair protein Msh5, MutS protein homolog 5 | O43196 | 6 | 8 | 6 |
| msh6* | DNA mismatch repair protein Msh6, MutS protein homolog 6 | P52701 | 5 | 7 | 4 |
| nbn | Nibrin | O60934 | 6 | 9 | 4 |
| piwil1 | Piwi-like protein 1 | Q8UVX0 | 5 | 2 | 4 |
| piwil2 | Piwi-like protein 2 | A6P7L8 | 20 | 27 | 19 |
| pms1 | PMS1 protein homolog 1 | P54277 | 32 | 51 | 22 |
| pms2 | DNA mismatch repair protein (endonuclease) PMS2 | P54278 | 6 | 4 | 5 |
| prdm9 | Histone-lysine N-methyltransferase | Q96EQ9 | 5 | 6 | 7 |
| psmc3ip* | Homologous-pairing protein 2 homolog (HOP2) | Q63ZL2 | 2 | 1 | 1 |
| rad1 | Cell cycle checkpoint protein RAD1 | Q5R7X9 | 9 | 4 | 3 |
| rad21* | Double-strand-break repair protein rad21 homolog | O60216 | 34 | 39 | 33 |
| rad50 | DNA repair protein RAD50 | P70388 | 3 | 5 | 4 |
| rad51 | DNA repair protein RAD51 homolog 1 | Q06609 | 5 | 2 | 3 |
| rad51B* | DNA repair protein RAD51 homolog 2/B | Q91917 | 0 | 15 | 3 |
| rad51C* | DNA repair protein RAD51 homolog 3/C | O43502 | 2 | 1 | 1 |
| rad51D* | DNA repair protein RAD51 homolog 4/D | O75771 | 31 | 27 | 189 |
| rad52 | DNA repair protein RAD52 homolog | P39022 | 1 | 3 | 1 |
| rad54A* | DNA repair and recombination protein RAD54-like | Q92698 | 5 | 12 | 10 |
| rad54B* | DNA repair and recombination protein RAD54B | Q9DG67 | 20 | 19 | 28 |
| rad9A | Cell cycle checkpoint control protein RAD9A | Q99638 | 4 | 6 | 8 |
| rad9B | Cell cycle checkpoint control protein RAD9B | Q6WBX8 | 7 | 20 | 25 |
| rec8* | Meiotic recombination protein REC8 | O95072 | 20 | 39 | 180 |
| rec114* | Meiotic recombination protein REC114 | Q7Z4M0 | 0 | 2 | 2 |
| recQl1 | ATP-dependent DNA helicase Q1 | Q9Z129 | 30 | 115 | 82 |
| recQl4 | ATP-dependent DNA helicase Q4 | O94761 | 78 | 49 | 63 |
| recQl5 | ATP-dependent DNA helicase Q5 | O94762 | 9 | 8 | 6 |
| rmi1 | RecQ-mediated genome instability protein 1 | A4IF98 | 3 | 2 | 2 |
| rmi2 | RecQ-mediated genome instability protein 2 | Q5ZM20 | 4 | 2 | 2 |
| rnf212 | Ring finger protein 212 / Probable E3 SUMO-protein ligase | F6TQD1 | 11 | 9 | 6 |
| sfr1* | SWI5 Dependent Homologous Recombination Repair Protein 1 | B7ZD04 | 4 | 1 | 1 |
| sgo2 | Shugoshin 2 | Q7TSY8 | 9 | 5 | 11 |
| smarca2 | SWI/SNF-related matrix-associated actin-dependent regulator of chromatin subfamily A member 2 | Q6DIC0 | 44 | 80 | 77 |
| smarca4 | SWI/SNF-related matrix-associated actin-dependent regulator of chromatin subfamily A member 4 | A7Z019 | 17 | 29 | 36 |
| smc1a* | Structural maintenance of chromosomes protein 1A | Q9CU62 | 6 | 4 | 4 |
| smc1b* | Structural maintenance of chromosomes protein 1B | Q8NDV3 | 10 | 75 | 17 |
| smc2* | Structural maintenance of chromosomes protein 2 | P50533 | 5 | 8 | 4 |
| smc3* | Structural maintenance of chromosomes protein 3 | Q9CW03 | 29 | 47 | 18 |
| smc4* | Structural maintenance of chromosomes protein 4 | P50532 | 9 | 8 | 8 |
| smc5* | Structural maintenance of chromosomes protein 5 | Q802R9 | 3 | 1 | 4 |
| smc6* | Structural maintenance of chromosomes protein 6 | Q6P9I7 | 36 | 54 | 48 |
| smchd1 | Structural maintenance of chromosomes flexible hinge domain-containing protein 1 | A6NHR9 | 10 | 19 | 24 |
| spdya-A | Speedy protein 1-A | Q9PU13 | 3 | 1 | 5 |
| spo11* | Meiotic recombination protein | Q9Y5K1 | 5 | 18 | 3 |
| stag1* | Cohesin subunit SA-1 | Q8WVM7 | 18 | 45 | 36 |
| stag2* | Cohesin subunit SA-2 | Q8N3U4 | 18 | 27 | 19 |
| stag3* | Cohesin subunit SA-3 | O70576 | 19 | 12 | 24 |
| stra8 | Stimulated by retinoic acid gene 8 protein | P70278 | 0 | 0 | 0 |
| syce1 | Synaptonemal complex central element protein 1 | Q8N0S2 | 1 | 1 | 1 |
| syce2* | Synaptonemal complex central element protein 2 | Q505B8 | 10 | 6 | 8 |
| syce3* | Synaptonemal complex central element protein 3 | B5KM66 | 1 | 2 | 1 |
| sycp1 | Synaptonemal complex protein 1 | Q62209 | 0 | 4 | 6 |
| sycp2 | Synaptonemal complex protein 2 | Q9CUU3 | 8 | 8 | 6 |
| sycp3 | Synaptonemal complex protein 3 | P70281 | 6 | 15 | 2 |
| terb1* | Telomere repeats-binding bouquet formation protein 1 | Q8NA31 | 5 | 3 | 3 |
| terb2* | Telomere repeats-binding bouquet formation protein 2 | Q9D494 | 2 | 1 | 1 |
| tex11* | Testis-expressed sequence 11 protein | Q8IYF3 | 43 | 53 | 46 |
| TOP6BL | Type 2 DNA topoisomerase 6 subunit B-like | Q8N6T0 | 18 | 43 | 9 |
| trip13 | Pachytene checkpoint protein 2 homolog | Q15645 | 5 | 2 | 7 |
| wWee2 | Wee1-like protein kinase 2 | Q66JT0 | 10 | 36 | 12 |
| xrcc1 | DNA repair protein XRCC1 | Q60596 | 3 | 2 | 2 |
| xrcc2* | DNA repair protein XRCC2 | Q9CX47 | 9 | 8 | 21 |
| xrcc3* | DNA repair protein XRCC3 | Q08DH8 | 4 | 3 | 2 |
| xrcc4 | DNA repair protein XRCC4 | Q924T3 | 27 | 52 | 23 |
| zmcm3 | Zygotic minichromosome maintenance protein 3 | Q7ZXZ0 | 2 | 5 | 1 |
Genes specific for meiosis are labeled with an asterisk (*)
To identify putative orthologues, the transcripts were first analyzed by the Transdecoder pipeline, beginning by translating the contigs into amino acid sequences. The total number of ORFs regardless to their coding potential was 218,390 amino acid sequences for P. formosa, 251,006 for P. latipinna, and 318,099 for P. mexicana. All amino acid sequences were compared via the blastp algorithm to the UniProt/Swiss-Prot database, yielding 44,860 (20.54%) matches for P. formosa, 57,563 (22.93%) for P. latipinna, and 73,013 (22.95%) for P. mexicana. Homology comparisons with the pfam database resulted in 72,519 matches for P. formosa (corresponding to 13,341 unique database entries), 78,797 for P. latipinna (corresponding to 13,388 unique database entries), and 99,659 for P. mexicana (corresponding to 13,603 unique database entries). In total, the Transdecoder analysis yielded 82,815 amino acid sequences predicted as likely coding regions for P. formosa, 87,235 for P. latipinna, and 109,824 for P. mexicana, which were all fed into the OrthoFinder pipeline, together with the P. reticulata proteome (Table 5). For the 323,589 amino acid sequences across all four species, 77.24% were assigned to 37,781 orthogroups with a median group size of four genes. An orthogroup includes the orthologous genes of the compared species and is defined as the group of genes descended from a single gene in the last common ancestor of a group of species. 74.38% of the amino acid sequences of P. formosa were assigned to orthogroups with P. reticulata (P. mexicana: 69.45% | P. latipinna: 73.42%). All four species shared 15,027 orthogroups. Ninety orthogroups (comprising 1052 genes, corresponding to 0.33% of all genes) were species-specific, i.e., they consisted entirely of genes detected only in one species. Specifically, 14 orthogroups were unique for P. formosa, 33 for P. latipinna, 24 for P. mexicana, and 19 for P. reticulata (Fig. 3, created with the online application jvenn [62]). The unique orthogroups for each of the four species and the 988 orthogroups, which were exclusively identified among the three sexual species, were annotated to detect differences in the occurrence of the corresponding GO terms (generic slim) between the sexual and the unisexual species (Fig. 4). In the sexual species, there are more genes annotated to the GO term “embryo development” (GO:0009790) or “chromosome” (GO:0005694) than in the unisexual P. formosa. In contrast, P. formosa exhibits more genes in unique orthogroups for different enzyme activities (for example, “ligase activity” (GO:0016874)). None of the orthogroups specific for P. formosa was associated with reproduction or meiosis. The analysis of the 988 orthogroups shared among the sexual species revealed 34 additional genes related to the meiotic cell cycle (Additional files 6: Table S2, Additional files 7, 8 and 9).
Table 5.
Orthology analysis using OrthoFinder
| Poecilia formosa | Poecilia latipinna | Poecilia mexicana | Poecilia reticulata | |
|---|---|---|---|---|
| Total number of genes | 82,815 | 87,235 | 109,824 | 43,715 |
| Number of genes in orthogroups (%) | 61,651 (74.44%) | 65,588 (75.19%) | 82,547 (75.16%) | 40,138 (91.18%) |
| Number of unassigned genes | 21,164 | 21,647 | 27,277 | 3577 |
| Number of orthogroups (%) | 32,147 (85.09%) | 31,374 (83.04%) | 32,899 (87.08%) | 18,389 (48.67%) |
| Number of species-specific orthogroups (genes) | 14 (129) | 33 (385) | 24 (370) | 19 (168) |
Fig. 3.
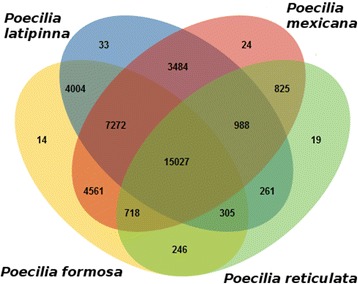
Identified orthogroups for the transcriptomes of P. formosa, P. mexicana, and P. latipinna in comparison with the proteome of P. reticulata
Fig. 4.
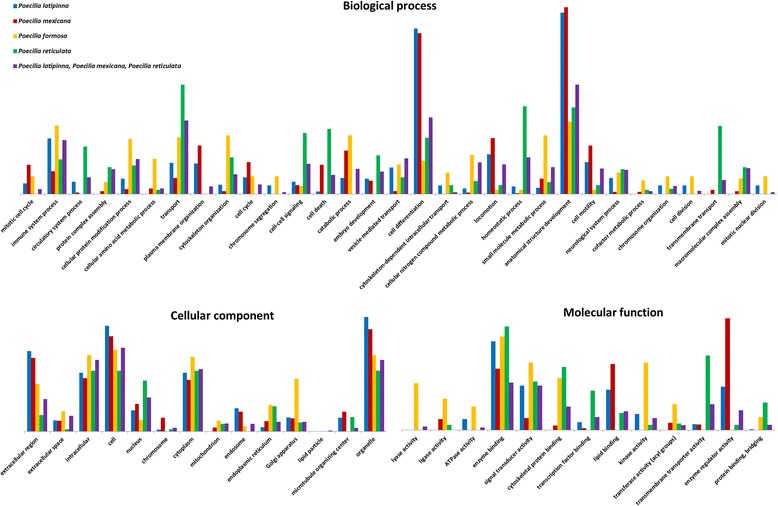
Number of unique gene ontology term entities for the annotated orthogroups for P. formosa, P. mexicana, P. latipinna, P. reticulata and the sexual species in combination (P. latipinna, P. mexicana, and P. reticulata). Only generic slim GO terms significantly different in their occurrence (one-sided Fisher-Tests; p < 0.05 corrected for multiple testing via Benjamini-Hochberg), between P. formosa and the other species are shown; bar sizes are proportional to their total number of occurrences
Compared to its sexually reproducing parental species, 2035 (4.69%) genes were up-regulated and 564 (1.30%) genes were down-regulated in the unisexual P. formosa identified at a false discovery rate (FDR) of 5% for the 43,356 tested genes, corrected via the Benjamini and Hochberg’s algorithm (Fig. 5). The differentially expressed genes associated with the GO terms “reproduction” (GO:000003) and “reproductive process” (GO:0022414) are listed in Table 6. Twenty seven genes related to reproduction have a higher expression in P. formosa, e.g., the gene of the Speedy protein A. For the GO enrichment of the GO term “cell junction” (GO:0030054), up- and down-regulated genes were over-represented. This means some genes of this GO term may be up-regulated in the sexual, others in the unisexual species. This is indicative of an alteration of gene activity between the unisexual and sexual species (Fig. 6). We exemplary compared our expression patterns to gene-specific expression data for six genes of the androgen receptor pathway by qRT-PCR on the same RNA isolates used for the transcriptome analysis (data from [33]). One gene (cyp19a2) was consistently up-regulated in the asexual species (1.9 fold in qRT-PCR; 1.4 fold with regard to transcriptome read numbers). Two genes (erα and erβ) were consistently up-regulated in the sexual species (1.7 resp. 1.6 fold in the qRT-PCR; both 1.9 fold in the transcriptome analysis). Two further genes (arβ and cyp19a2) were not differentially expressed in neither the qRT-PCR study nor the transcriptome analysis. For one gene (arα), the transcriptome data exhibited a 3.7 fold higher read number in the asexual species, relative to the sexual species. This was not confirmed by qRT-PCR, but expression at this gene was very variable among six biological replicates in one of the sexual species, P. latipinna (2.9 fold within 95% confidence limits). While the up-regulation of arα detected in the transcriptome data for the asexual species may be hence a false positive (presumably caused by the variable expression in one of the sexual species), we find overall consistent expression patterns in five (out of six) analyzed genes among transcriptome read number analysis and a gene-specific qRT-PCR analysis. The scale of expression differences (fold change) was also similar among the two methods.
Fig. 5.
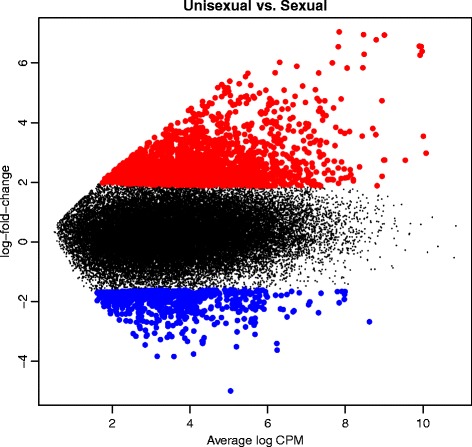
Mean difference plot showing the log-fold change and average abundance of each gene of the differential expression analysis between P. formosa (“Unisexual”) and P. mexicana and P. latipinna (“Sexual”). Color depicts genes down-regulated (blue) or up-regulated (red) in P. formosa
Table 6.
Detected GO term IDs, the GO term names and the corresponding genes for the up-regulated (+) or down-regulated (−) in P. formosa (only genes involved in reproduction and meiosis are listed)
| GO term ID | GO term name | Gene | Description | Expression |
|---|---|---|---|---|
| GO:0000212 | Meiotic spindle organization | larp | La-related protein 1 | (+) |
| tubgcp4 | Gamma-tubulin complex component 4 | (+) | ||
| GO:0000706 | Meiotic DNA double-strand break processing | atr | Serine/threonine-protein kinase ATR | (+) |
| GO:0000710 | Meiotic mismatch repair | xpc | DNA repair protein complementing XP-C cells | (+) |
| GO:0000711 | Meiotic DNA repair synthesis | ccng1 | Cyclin-G1 | (+) |
| ccng2 | Cyclin-G2 | (+) | ||
| GO:0001555 | Oocyte growth | rbp4a | Retinol-binding protein 4-A | (+) |
| rbp4b | Retinol-binding protein 4-B | (+) | ||
| GO:0007111 | Meiosis II cytokinesis | actba | Actin, cytoplasmic 1 | (+) |
| GO:0007130 | Synaptonemal complex assembly | bag6 | Large proline-rich protein BAG6; | (+) |
| GO:0007131 | Reciprocal meiotic recombination | topbp1-A | DNA topoisomerase 2-binding protein 1-A | (+) |
| GO:0007286 | Spermatid development | abhd2-A | Monoacylglycerol lipase ABHD2-A | (+) |
| GO:0007288 | Sperm axoneme assembly | neurl1 | E3 ubiquitin-protein ligase NEURL1 | (+) |
| GO:0008584 | Male gonad development | acvr2A | Activin receptor type-2A | (−) |
| ncoa1 | Nuclear receptor coactivator 1 | (+) | ||
| GO:0016344 | Meiotic chromosome movement towards spindle pole | fmn2 | Formin-2 | (+) |
| GO:0019102 | Male somatic sex determination | ar | Androgen receptor | (+) |
| GO:0040022 | Feminization of hermaphroditic germline | dhx16 | Putative pre-mRNA-splicing factor ATP-dependent RNA helicase DHX16 | (+) |
| GO:0044779 | Meiotic spindle checkpoint | ttk | Dual specificity protein kinase Ttk | (+) |
| GO:0045141 | Meiotic telomere clustering | sun1 | SUN domain-containing protein 1 | (+) |
| GO:0048477 | Oogenesis | lrmp | Lymphoid-restricted membrane protein | (−) |
| GO:0051039 | Positive regulation of transcription involved in meiotic cell cycle | brd2 | Bromodomain-containing protein 2 | (+) |
| GO:0051177 | Meiotic sister chromatid cohesion | anchr | Abscission/NoCut checkpoint regulator | (+) |
| GO:0051307 | Meiotic chromosome separation | mcm5A | DNA replication licensing factor mcm5-A | (−) |
| GO:0051446 | Positive regulation of meiotic cell cycle | spdya | Speedy protein A | (+) |
| GO:0051447 | Negative regulation of meiotic cell cycle | dusp1 | Dual specificity protein phosphatase 1 | (+) |
| GO:0051598 | Meiotic recombination checkpoint | rad1 | Cell cycle checkpoint protein RAD1 | (+) |
| GO:0090306 | Spindle assembly involved in meiosis | aspm | Abnormal spindle-like microcephaly-associated protein | (+) |
| GO:1,903,537 | Meiotic cell cycle process involved in oocyte maturation | pgrmc1 | Membrane-associated progesterone receptor | (+) |
| GO:1,903,538 | Regulation of meiotic cell cycle process involved in oocyte maturation | prkar1a | cAMP-dependent protein kinase type I-alpha regulatory subunit | (+) |
Fig. 6.
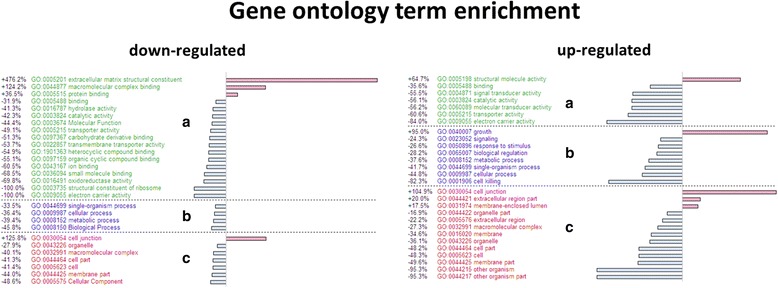
Gene ontology term enrichment for the differentially expressed genes between the unisexual (P. formosa) and sexual species (P. mexicana and P. latipinna) generated by GOblet. Only significantly enriched (red) or depleted (blue) generic GO terms are shown (one-sided Fisher-Tests; p < 0.05), for the three components “Molecular function (a)”, “Biological process (b)” and “Cellular components” (c)
Discussion
Quality of the de novo transcriptome assemblies
De novo assembly of the datasets resulted in a higher number of transcripts for the Atlantic molly P. mexicana and the sailfin molly P. latipinna, compared to the Amazon molly P. formosa and sequencing statistics were overall quite similar between the parental species, especially regarding the N50 value and the average contig length. On average, the statistics for the de novo assemblies show similar results compared to other transcriptomes of fish species using RNA sequencing techniques (Illumina) [63–66]. The higher number of total transcripts for all three species compared to other transcriptomes of the family Poeciliidae, for example, the P. mexicana transcriptome (number of transcripts: 80,111) [63] or the transcriptome of the Western mosquitofish Gambusia affinis (average number of transcripts: 63,734) [64], can be likely attributed to the fact that we retained some of the transcripts with a low expression, which some other authors may have filtered out. We – on purpose – retained these transcripts in order to maintain our ability to detect genes expressed in a species-specific manner.
For the Trinity assembler, which is well suited for the reconstruction of transcriptomes de novo [38, 67, 68], each component (also referred to as unigenes) represents a set of transcripts, which are assumed to represent genes (P. formosa: 59,935 | P. latipinna: 73,450 | P. mexicana: 79,522) and include different isoforms (transcripts) derived from alternative splicing or closely related paralogs. Based on the longest isoform for each component, all three assemblies are more similar in the N50 value (P. formosa: 1510 bp | P. latipinna: 1654 bp | P. mexicana: 1726 bp) and the average contig length (P. formosa: 865 bp | P. latipinna: 843 bp | P. mexicana: 859 bp). Comparing our transcriptomes to the annotation releases of the three Poecilia species genomes, P. formosa has a lower number of transcripts and components than both ancestral species; this appears to reflect the actual composition of the datasets. A lower number of genomic mRNA transcripts has been previously reported for P. formosa (39,207), compared to P. mexicana (47,406) and P. latipinna (47,072) (NCBI annotation release 100, 2015).
All three de novo assembled transcriptomes exhibited comparable quality measures in downstream analyses, like functional annotation and the comparative analysis of sequence similarities with the different teleost databases. Also, the ratio of transcripts without ORFs and possible contaminants for all assemblies was similar. The contamination load obtained was only between 1.6 and 1.7% of the transcripts per species. All three de novo assemblies showed high consistency with the different genomic and proteomic datasets. By implication, the agreement with the closer related species of the Poeciliidae family was higher in comparison to the less closely related species, like the Japanese medaka O. latipes or the zebrafish D. rerio. Even with very strict mapping parameters, a high percentage of reads mapped back to the transcripts (P. formosa: 76.39% | P. latipinna: 78.69% | P. mexicana: 77.63%), which matches the desired range (between 70 and 80%) described in the Trinity user guide. In summary, overall results are similar for all the de novo assembly datasets, suggesting that the transcriptomes for all three species were suitable for comparative analysis.
Differential gene expression between unisexual and bisexual mollies
Based on the clustering and count data of the mapped reads of the species with themselves and between them, we performed a differential expression analysis comparing two conditions (unisexual vs. sexual). We considered the two sexual species as biological replicates and compared this group to the unisexual species. As a second related unisexual species does not exist, we do not have a species replicate for the unisexual condition. We were hence unable to establish statistical significance for the inferred 2035 up-regulated and 564 down-regulated genes identified for the unisexual P. formosa. We exemplary confirmed the transcriptome-derived expression patterns in five (out of six) genes analyzed by qRT-PCR. We are also aware of that an unknown number of differentially expressed genes may have gone undetected and a thorough analysis of differential expression would require a higher number of replicates per condition [69]. Nonetheless, we argue – with caution – that differences in read numbers in our transcriptome data may have revealed candidates for genes differentially expressed among sexual vs. unisexual species, to be further analyzed in future research.
We used three different approaches to identify candidate genes, which may be involved in the molecular underpinning of the different reproduction modes among the sexual and unisexual species. First, we searched the BLAST results for the occurrence of genes related to meiosis or reproduction. Second, we conducted an orthology analysis with a closely related species, the guppy P. reticulata. Finally, as described above, we identified differentially expressed genes, i.e. those, which are higher or lower expressed in P. formosa, as compared to its parental species. Scanning the BLAST results for the occurrence of 108 meiosis-related genes showed that 1.25% (equates to 1335 transcripts) of all generated transcripts for P. formosa are linked to the meiotic cell cycle which is significantly lower compared to 1.74% for P. mexicana and 1.78% for P. latipinna (p < 0.05 in both pairwise comparisons, tested with χ2 test). The ratio of the meiosis-specific genes to the total number of transcripts is 0.50% in P. formosa (P. mexicana: 0.73% | P. latipinna: 0.92%). In line with the lack of meiosis in P. formosa, a significantly lower percentage of transcripts was related to this process, in comparison to the sexual species. Yet, the down-regulation of meiosis-related genes is not as complete as one might have expected for a species producing gametes apomictically. Only two meiosis-related genes could not be detected in any of the three transcriptomes (str8 and hormad2). The stimulated by retinoic acid gene 8 (str8) is required in mice for the transition of female and male germ cells into meiosis and is typically expressed in adult testes and embryonic ovaries [70]. Therefore, this gene is not necessarily expressed in adult female gonads, the tissue analyzed here. The second absent gene was the hormad2 gene, which encodes the HORMA domain-containing 2 protein. The hormad1 and hormad2 genes are explicitly expressed during meiosis in male and female mice [71], but nothing is known about their function in fish.
In P. formosa, the most prominent meiosis-specific gene lacking in the transcriptome was the gene for meiotic recombination protein Rec114, required for DNA double strand break (DSB) formations, which induces meiotic recombination [72]. Studies in mice showed that the rec114 gene is expressed in adult testes and in embryonic ovaries and seems to be conserved among most sexually reproducing eukaryotes [73]. This gene was not found in a previously published transcriptome of the Amazon molly either [74]. The functional annotation of the homologous genes for P. mexicana, P. latipinna, and the closely related P. reticulata yielded 35 genes of interest, which were absent in the Amazon molly transcriptome. Particularly interesting is the gene for the ATP-dependent RNA helicase cgh1 (conserved germline helicase-1). In the hermaphrodite Caenorhabditis elegans, it is responsible for regulating maternal mRNA translational repression and protecting it from degradation (reviewed in [75]). The absence of this gene in C. elegans and presumably in other organisms leads to non-functional sperm and, more importantly, to the degradation of developing oocytes [76].
Evolutionary implications of lowered expression in meiosis-related genes
Our results raise questions about the function of the detected and missing genes expressed in the Amazon molly P. formosa gonads as well as about its reproduction mechanisms. The presence or absence of transcripts related to a specific process (in this case reproduction and especially meiosis) lead to expectations about their evolution in asexual species compared to sexual ones. If a certain biological process is no longer maintained, the underlying genes are expected to be under reduced functional constraints (relaxed selection), leading to the accumulation of deleterious mutations, which may compromise their biological function and/or their expression. Ultimately, genes may degenerate such that they can become pseudogenes [77, 78]. The time span since P. formosa evolved from its ancestor species (280,000 years [19]) may have been too short to result in pervasive pseudogenization of meiosis genes. Nonetheless, the generally lower expression levels and the lack of expression in several such genes, some of which of crucial importance in sexual reproduction, points to an evolutionary erosion of genes no longer necessary in an apomictic species.
However, meiosis genes are not always under relaxed selection in asexually reproducing species. In a comparison of obligate sexual and asexual individuals in the freshwater snail Potamopyrgus antipodarum, three meiosis-specific genes (spo11, msh4 and msh5) exhibited no degeneration in the asexual lineages, but were instead inferred to be under purifying selection [79]. Also, for three ancient asexual oribatid mites, there is stronger purifying selection on nuclear and mitochondrial orthologous genes compared to sexual species [80]. For the microcrustacean Daphnia pulex, whose reproduction cycle consists of alternating sexual and asexual phases, the main meiosis genes are present in the genome and are expressed under parthenogenesis [9]. These genes could gain new or until now undiscovered functions, possibly leading to novel alternative pathways to meiosis. For example, the spo11 gene – known to initiate meiotic recombination by the introduction of DSBs in sexual species – has been described to lead to extensive genetic recombination between homologous chromosomes, including multiple gene conversion events, in an ameiotic species, the parasexual fungus Candida albicans [81]. Gene conversion has been frequently detected in P. formosa [18], but deeper molecular knowledge is needed to unravel, whether there are potential alternate functions of meiosis genes in this species. Comparing meiosis-specific genes on the intron/exon level among the three species can be a first approach to analyze their functions and to detect selective constraints. An additional approach would be to study knockout/knockdown individuals in comparison with the wild type, which is a well-established and extensively used genetic technique to directly examine functional and phenotypic effects of candidate genes [82], particularly in the fish model organisms D. rerio (reviewed in [83]) and O. latipes [84] as well as for Carassius gibelio [85], which has multiple reproduction modes including sexual reproduction and unisexual gynogenesis [86]. The dataset published in this study forms an excellent basis for further investigations, including those described above or for single nucleotide polymorphism (SNP) detection, and qRT-PCR, ideally conducted in an allele-specific manner, to resolve the evolutionary questions raised. Furthermore, our dataset would be beneficial for the (re-)annotation of the genomes of all three species.
Conclusions
The generated de novo gonadal transcriptomes of the Amazon molly Poecilia formosa and its parental species, the sailfin molly P. latipinna and the Atlantic molly P. mexicana, were functionally annotated and analyzed on the basis of sequence similarities between the species. They provide a valuable resource for questions concerning the reproductive mode of an asexual hybrid species in comparison to its sexual ancestor species. Interestingly, there are also vertebrate examples, where hybrid speciation leads to an automictic form of parthenogenesis. Here, meiosis and recombination are maintained (e.g., in whiptail lizards, [87]). In contrast, our ameiotic species lacks recombination and is hence a ‘frozen hybrid’ at all nuclear loci [18, 33, 88].
Inline with our a priori hypothesis, there was a general tendency towards lower expression of meiosis-related genes in the apomictic P. formosa. However, only a few of these genes were completely absent in the P. formosa transcriptome, while the remainder constitutes interesting candidates for further evolutionary studies, e.g., on potential neofunctionalization vs. pseudogenization. Furthermore, our dataset comprises a substantial addition to the already present genomic resources available for the family of Poeciliidae and can be used for future sequencing projects as well as for the annotation of the genome for all three species.
Additional files
Databases for the BLAST sequence similarity comparisons. (DOCX 14 kb)
Transcript length distribution for the de novo assemblies of the Amazon molly (P. formosa), the sailfin molly (P. latipinna), and the Atlantic molly (P. mexicana). (BMP 1741 kb)
Enrichment analysis of the generic GO slim terms evaluated using one-sided Fisher-Tests for P. formosa The. residues are given relative to the expected value, shown are significantly enriched (red) or depleted (blue) (p < 0,05) GOs for the three components: Molecular function (A), biological process (B), and cellular component (C). (BMP 4123 kb)
Enrichment analysis of the generic GO slim terms evaluated using one-sided Fisher-Tests for P. latipinna. The residues are given relative to the expected value, shown are significantly enriched (red) or depleted (blue) (p < 0,05) GOs for the three components: Molecular function (A), biological process (B), and cellular component (C). (BMP 4278 kb)
Enrichment analysis of the generic GO slim terms evaluated using one-sided Fisher-Tests for P. mexicana. The residues are given relative to the expected value, shown are significantly enriched (red) or depleted (blue) (p < 0,05) GOs for the three components: Molecular function (A), biological process (B), and cellular component (C). (BMP 4395 kb)
GO terms ID, the GO term names and the corresponding genes related to reproduction and meiosis for the orthogroups only detected in the sexual species. (DOCX 17 kb)
Blast results for the sequence comparisons between the Poecilia formosa transcriptome and the Uniprot/Swiss-Prot database. (TXT 7495 kb)
Blast results for the sequence comparisons between the Poecilia latipinna transcriptome and the Uniprot/Swiss-Prot database. (TXT 7176 kb)
Blast results for the sequence comparisons between the Poecilia mexicana transcriptome and the Uniprot/Swiss-Prot database. (TXT 8636 kb)
Acknowledgements
We thank Manfred Schartl, University of Würzburg, for providing founding specimens for strains of P. formosa and P. latipinna. Fangjun Zhu helped with tissue extraction and conducted the RNA isolation; Kristina Mitic, University of Potsdam, analyzed possible contaminants for the P. latipinna and P. mexicana assemblies; Stefanie Hartmann, University of Potsdam, provided helpful suggestions for data analysis. Robert Sehlke, Max Planck Institute for Biology of Ageing Cologne, collaborated in developing the GUI application of the GOblet software.
Funding
Funding was provided by the University of Potsdam to IMS and RT and the Alexander von Humboldt Foundation to IS. Regarding publication costs, we further acknowledge the support of the Deutsche Forschungsgemeinschaft and Open Access Publishing Fund of University of Potsdam.
Availability of data and materials
The data underlying this publication can be obtained from the Sequence Read Archive (SRA) at the National Center for Biotechnology Information (NCBI) (BioProject: PRJNA385580 – P. formosa: SAMN06894540 | P. latipinna: SAMN06894541 | P. mexicana: SAMN06894542).
Abbreviations
- BLAST
Basic local alignment search tool
- cDNA
Complementary desoxyribonucleic acid
- DSB
Double strand break
- FDR
False discovery rate
- GO
Gene ontology
- GUI
Graphical user interface
- IEA
Inferred from electronic annotation
- N50 value
Weighted median length of transcripts
- NCBI
National Center for Biotechnology Information
- ORF
Open reading frame
- qRT-PCR
Quantitative real-time Reverse Transcriptase Polymerase Chain Reaction
- rRNA
ribosomal ribonucleic acid
- SNP
Single nucleotide polymorphism
Authors’ contributions
RT and IS conceived and supervised the work. RT, IS, and IMS designed the study. IMS performed the research and analyzed the data. DG provided and customized the GUI of the GOblet standalone software. RT, IS, and IMS jointly interpreted the data. IMS drafted the manuscript. RT, IS, and DG significantly contributed to the manuscript. RT, IS, IMS and DG read and approved the manuscript and contributed to its revision.
Ethics approval and consent to participate
Fish were taken from strains kept and bred at the University of Potsdam in compliance with German animal welfare regulations. Sampling followed the international recognized guidelines and applicable national law (Tierschutzgesetz). The procedure was approved by the deputy of animal welfare at University of Potsdam.
Consent for publication
Not applicable.
Competing interests
The authors declare that they have no competing interests.
Publisher’s Note
Springer Nature remains neutral with regard to jurisdictional claims in published maps and institutional affiliations.
Footnotes
Electronic supplementary material
The online version of this article (10.1186/s12864-017-4382-2) contains supplementary material, which is available to authorized users.
Contributor Information
Ina Maria Schedina, Email: schedina@uni-potsdam.de.
Detlef Groth, Email: dgroth@uni-potsdam.de.
Ingo Schlupp, Email: schlupp@ou.edu.
Ralph Tiedemann, Email: tiedeman@uni-potsdam.de.
References
- 1.Vrijenhoek RC. Animal clones and diversity. Bioscience. 1998;48:617–628. doi: 10.2307/1313421. [DOI] [Google Scholar]
- 2.Maynard Smith J. The evolution of sex. Cambridge: UK Cambridge University Press; 1978.
- 3.Butlin R. Evolution of sex: the costs and benefits of sex: new insights from old asexual lineages. Nat Rev Genet. 2002;3:311–317. doi: 10.1038/nrg749. [DOI] [PubMed] [Google Scholar]
- 4.Otto SP. The evolutionary enigma of sex. Am Nat. 2009;174(suppl):S1–S14. doi: 10.1086/599084. [DOI] [PubMed] [Google Scholar]
- 5.Fagerström T, Briscoe DA, Sunnucks P. Evolution of mitotic cell-lineages in multicellular organisms. Trends Ecol Evol. 1998;13(3):117–120. doi: 10.1016/S0169-5347(97)01314-1. [DOI] [PubMed] [Google Scholar]
- 6.Stenberg P, Saura A. Cytology of asexual animals. In: Schön I, Martens K, van Dijk P, editors. Lost sex: the evolutionary biology of parthenogenesis. Dordrecht: Springer science + business Media; 2009. pp. 63–74. [Google Scholar]
- 7.Avise JC. Clonality: the genetics, ecology, and evolution of sexual abstinence in vertebrate animals. Oxford: Oxford University Press, U.K; 2008. [Google Scholar]
- 8.Ramesh MA, Malik SB, Logsdon JM Jr. A phylogenomic inventory of meiotic genes; evidence for sex in Giardia and an early eukaryotic origin of meiosis. Curr Biol. 2005;15:185–91. [DOI] [PubMed]
- 9.Schurko AM, Logsdon JM., Jr Using a meiosis detection toolkit to investigate ancient asexual "scandals" and the evolution of sex. BioEssays. 2008;30(6):579–589. doi: 10.1002/bies.20764. [DOI] [PubMed] [Google Scholar]
- 10.Malik SB, Pightling AW, Stefaniak LM, Schurko AM, Logsdon JM., Jr An expanded inventory of conserved meiotic genes provides evidence for sex in Trichomonas vaginalis. PLoS One. 2007;3(8):e2879. doi: 10.1371/journal.pone.0002879. [DOI] [PMC free article] [PubMed] [Google Scholar]
- 11.Hubbs CL, Hubbs LC. Apparent parthenogenesis in nature, in a form of fish hybrid origin. Science. 1932;76:628–630. doi: 10.1126/science.76.1983.628. [DOI] [PubMed] [Google Scholar]
- 12.Schlupp I, Parzefall J, Schartl M. Biogeography of the Amazon molly, Poecilia formosa. JBiogeogr. 2002;29(1):1–6. doi: 10.1046/j.1365-2699.2002.00651.x. [DOI] [Google Scholar]
- 13.Schlupp I. The evolutionary ecology of gynogenesis. Annu Rev Ecol Evol Syst. 2005;36:399–417. doi: 10.1146/annurev.ecolsys.36.102003.152629. [DOI] [Google Scholar]
- 14.Beukeboom LW, Vrijenhoek RC. Evolutionary genetics and ecology of sperm-dependent parthenogenesis. J Evol Biol. 1998;11:755–782. doi: 10.1007/s000360050117. [DOI] [Google Scholar]
- 15.Lamatsch DK, Stöck M. Sperm-dependent parthenogenesis and hybridogenesis in Teleost fishes. In: Schön I, Martens K, van Dijk P, editors. Lost sex: the evolutionary biology of parthenogenesis. Dordrecht: Springer Science + Business Media; 2009. p. 399–432.
- 16.Avise JC, Trexler JC, Travis J, Nelson WS. Poecilia mexicana is the recent female parent of the unisexual fish P. formosa. Evolution. 1991;45(6):1530–1533. doi: 10.1111/j.1558-5646.1991.tb02657.x. [DOI] [PubMed] [Google Scholar]
- 17.Schartl M, Wilde B, Schlupp I, Parzefall J. Evolutionary origin of a parthenoform, the Amazon molly Poecilia formosa, on the basis of a molecular genealogy. Evolution. 1995;49:827–835. doi: 10.1111/j.1558-5646.1995.tb02319.x. [DOI] [PubMed] [Google Scholar]
- 18.Tiedemann R, Moll K, Paulus KP, Schlupp I. New microsatellite loci confirm hybrid origin, parthenogenetic inheritance, and mitotic gene conversion in the gynogenetic Amazon molly (Poecilia formosa) Mol Ecol Res. 2005;5(3):586–589. [Google Scholar]
- 19.Lampert KP, Schartl M. The origin and evolution of a unisexual hybrid: Poecilia formosa. Philos Trans R Soc Lond Ser B Biol Sci. 2008;363(1505):2901–9. [DOI] [PMC free article] [PubMed]
- 20.Niemeitz A, Kreutzfeldt R, Schartl M, Parzefall J, Schlupp I. Male mating behaviour of a molly, Poecilia latipunctata: a third host for the sperm-dependent Amazon molly, Poecilia formosa. Acta Ethol. 2002;5(1):45–49. doi: 10.1007/s10211-002-0065-2. [DOI] [Google Scholar]
- 21.Rasch EM, Monaco PJ, Balssano JS. Cytophotometric and autoradiographic evidence for funtional apoxomixis in gynogenetic fish, Poecilia formosa, and its related triploid hybrids. Histochem. 1982;73:515–33. [DOI] [PubMed]
- 22.Monaco PJ, Rasch EM, Balsano JS. Apomictic reproduction in the Amazon Molly, Poecilia formosa, and its triploid hybrids. In: Turner BJ, editor. Evolutionary genetics of fishes. New York: Plenum Press; 1984. pp. 311–328. [Google Scholar]
- 23.Schartl M, Nanda I, Schlupp I, Wilde B, Epplen JT, Schmid M, Parzefall J. Incorporation of subgenomic amounts of DNA as compensation for mutational load in a gynogenetic fish. Nature. 1995;373:68–71. doi: 10.1038/373068a0. [DOI] [Google Scholar]
- 24.Nanda I, Schlupp I, Lamatsch DK, Lampert KP, Schmid M, Schartl M. Stable inheritance of host species-derived microchromosomes in the gynogenetic fish Poecilia formosa. Genetics. 2007;177(2):917–26. [DOI] [PMC free article] [PubMed]
- 25.Lamatsch DK, Nanda I, Epplen JT, Schmid M, Schartl M. Unusual triploid males in a microchromosome-carrying clone of the Amazon molly, Poecilia formosa. Cytogenet Cell Genet. 2000;91:148–156. doi: 10.1159/000056836. [DOI] [PubMed] [Google Scholar]
- 26.Rosen DE, Gordon M. Functional anatomy and evolution of male genitalia in poeciliid fishes. Zoologica. 1953;38:1–47. [Google Scholar]
- 27.Hubbs CL. Interactions between a bisexual fish species and its gynogenetic sexual parasite. Texas Memorial Museum Bulletin. 1964;8:1–72. [Google Scholar]
- 28.Schlupp I, Marler C, Ryan ML. Benefit to male sailfin mollies of mating with heterospecific females. Science. 1994;263(5145):373–374. doi: 10.1126/science.8278809. [DOI] [PubMed] [Google Scholar]
- 29.Heubel KU, Hornhardt K, Ollmann T, Parzefall J, Ryan MJ, Schlupp I. Geographic variation in female mate-copying in the species complex of a unisexual fish, Poecilia formosa. Behaviour. 2008;145:1041–1064. doi: 10.1163/156853908784474533. [DOI] [Google Scholar]
- 30.Sarup P, Sørensen JG, Kristensen TN, Hoffmann AA, Loeschcke V, Paige KN, Sørensen P. Candidate genes detected in transcriptome studies are strongly dependent on genetic background. PLoS One. 2011;6(1):e15644. doi: 10.1371/journal.pone.0015644. [DOI] [PMC free article] [PubMed] [Google Scholar]
- 31.De Oliveira AL, Wollesen T, Kristof A, Scherholz M, Redl E, Todt C, Bleidorn C, Wanninger A. Comparative transcriptomics enlarges the toolkit of known developmental genes in mollusks. BMC Genomics. 2016;17(1):905. doi: 10.1186/s12864-016-3080-9. [DOI] [PMC free article] [PubMed] [Google Scholar]
- 32.Zhu W, Wang L, Dong Z, Chen X, Song F, Liu N, Yang H, Fu J. Comparative Transcriptome analysis identifies candidate genes related to skin color differentiation in red tilapia. Sci Rep. 2016;6:31347. doi: 10.1038/srep31347. [DOI] [PMC free article] [PubMed] [Google Scholar]
- 33.Zhu F, Schlupp I, Tiedemann R. Sequence evolution and expression of the androgen receptor and other pathway-related genes in a unisexual fish, the Amazon molly, Poecilia formosa, and its bisexual ancestors. PLoS One. 2016;11(6):e0156209. doi: 10.1371/journal.pone.0156209. [DOI] [PMC free article] [PubMed] [Google Scholar]
- 34.Andrews S. FastQC: a quality control tool for high throughput sequence data. 2010. Available online at: http://www.bioinformatics.babraham.ac.uk/projects/fastqc
- 35.Bolger AM, Lohse M, Usadel B. Trimmomatic: a flexible trimmer for Illumina sequence data. Bioinformatics. 2014;30(15):2114–2120. doi: 10.1093/bioinformatics/btu170. [DOI] [PMC free article] [PubMed] [Google Scholar]
- 36.Kopylova E, Noé L, Touzet H. SortMeRNA: fast and accurate filtering of ribosomal RNAs in metatranscriptomic data. Bioinformatics. 2012;28(24):3211–3217. doi: 10.1093/bioinformatics/bts611. [DOI] [PubMed] [Google Scholar]
- 37.Quast C, Pruesse E, Yilmaz P, Gerken J, Schweer T, Yarza P, Peplies J, Glöckner FO. The SILVA ribosomal RNA gene database project: improved data processing and web-based tools. Nucl Acids Res. 2013;41(Database issue):D590–D596. doi: 10.1093/nar/gks1219. [DOI] [PMC free article] [PubMed] [Google Scholar]
- 38.BX L, Zeng ZB, Shi TL. Comparative study of de novo assembly and genome-guided assembly strategies for transcriptome reconstruction based on RNA-Seq. Sci China Life Sci. 2013;56:143–155. doi: 10.1007/s11427-013-4442-z. [DOI] [PubMed] [Google Scholar]
- 39.Torres-Oliva M, Almudi I, McGregor AP, Posnien N. A robust (re-)annotation approach to generate unbiased mapping references for RNA-seq-based analyses of differential expression across closely related species. BMC Genomics. 2016;17:392. doi: 10.1186/s12864-016-2646-x. [DOI] [PMC free article] [PubMed] [Google Scholar]
- 40.Wang S, Gribskov M. Comprehensive evaluation of de novo transcriptome assembly programs and their effects on differential gene expression analysis. Bioinformatics. 2017;33(3):327–33. [DOI] [PubMed]
- 41.Haas BJ, Papanicolaou A, Yassour M, Grabherr M, Blood PD, Bowden J, Couger MB, Eccles D, Li B, Lieber M, Macmanes MD, Ott M, Orvis J, Pochet N, Strozzi F, Weeks N, Westerman R, William T, Dewey CN, Henschel R, Leduc RD, Friedman N, Regev A. De novo transcript sequence reconstruction from RNA-seq using the Trinity platform for reference generation and analysis. Nat Protoc. 2013;8(8):1494–512. [DOI] [PMC free article] [PubMed]
- 42.Langmead B, Salzberg SL. Fast gapped-read alignment with bowtie 2. Nat Methods. 2012;9(4):357–359. doi: 10.1038/nmeth.1923. [DOI] [PMC free article] [PubMed] [Google Scholar]
- 43.Li H, Handsaker B, Wysoker A, Fennell T, Ruan J, Homer N, Marth G, Abecasis G, Durbin R. 1000 genome project data processing subgroup. The sequence alignment/map format and SAMtools. Bioinformatics. 2009;25(16):2078–2079. doi: 10.1093/bioinformatics/btp352. [DOI] [PMC free article] [PubMed] [Google Scholar]
- 44.Li B, Dewey CNRSEM. Accurate transcript quantification from RNA-Seq data with or without a reference genome. BMC Bioinformatics. 2011;12:323. doi: 10.1186/1471-2105-12-323. [DOI] [PMC free article] [PubMed] [Google Scholar]
- 45.Altschul SF, Gish W, Miller W, Myers EW, Lipman DJ. Basic local alignment search tool. J Mol Biol. 1990;215(3):403–410. doi: 10.1016/S0022-2836(05)80360-2. [DOI] [PubMed] [Google Scholar]
- 46.The UniProt Consortium. UniProt: the universal protein knowledgebase. Nucl Acids Res. 2017;45:D158–69. [DOI] [PMC free article] [PubMed]
- 47.Li W, Godzik A. Cd-hit: a fast program for clustering and comparing large sets of protein or nucleotide sequences. Bioinformatics. 2006;22:1658–1659. doi: 10.1093/bioinformatics/btl158. [DOI] [PubMed] [Google Scholar]
- 48.Min XJ, Butler G, Storms R, Tsang A. OrfPredictor: predicting protein-coding regions in EST-derived sequences. Nucl Acids Res. 2005; web server issue W677-80. Available online at: http://bioinformatics.ysu.edu/tools/OrfPredictor.html. [DOI] [PMC free article] [PubMed]
- 49.Groth D, Hartmann S, Panopoulou G, Poustka AJ, Hennig S. GOblet: annotation of anonymous sequence data with gene ontology and pathway terms. J Integr Bioinform. 2008;5:104. doi: 10.1515/jib-2008-104. [DOI] [PubMed] [Google Scholar]
- 50.The Gene Ontology Consortium Gene ontology: tool for the unification of biology. Nat Genet. 2005;25:25–19. doi: 10.1038/75556. [DOI] [PMC free article] [PubMed] [Google Scholar]
- 51.NCBI Resource Coordinators Database resources of the National Center for Biotechnology Information.Nucl. Acids Res. 2014; Database issue 42:D7–17. [DOI] [PMC free article] [PubMed]
- 52.Li H, Meng F, Guo C, WangY XX, Zhu T, Zhou S, Ma H, Shan H, Kong H. MeioBase: a comprehensive database for meiosis. Front Plant Sci. 2014;5:728. doi: 10.3389/fpls.2014.00728. [DOI] [PMC free article] [PubMed] [Google Scholar]
- 53.Howe DG, Bradford YM, Conlin T, Eagle AE, Fashena D, Frazer K, Knight J, Mani P, Martin R, Moxon SA, Paddock H, Pich C, Ramachandran S, Ruef BJ, Ruzicka L, Schaper K, Shao X, Singer A, Sprunger B, Van Slyke CE, Westerfield M. ZFIN, the Zebrafish model organism database: increased support for mutants and transgenics. Nucl. Acids Res. 2013;41(Database issue):D854–D860. doi: 10.1093/nar/gks938. [DOI] [PMC free article] [PubMed] [Google Scholar]
- 54.Eddy SR. A new generation of homology search tools based on probabilistic inference. Genome Inform. 2009;23:205–211. [PubMed] [Google Scholar]
- 55.Finn RD, Coggill P, Eberhardt RY, Eddy SR, Mistry J, Mitchell AL, Potter SC, Punta M, Qureshi M, Sangrador-Vegas A, Salazar GA, Tate J, Bateman A. The Pfam protein families database: towards a more sustainable future. Nucl. Acids Res. 2016;44(Database Issue):D279–D285. doi: 10.1093/nar/gkv1344. [DOI] [PMC free article] [PubMed] [Google Scholar]
- 56.Emms DM, Kelly S. OrthoFinder: solving fundamental biases in whole genome comparisons dramatically improves orthogroup inference accuracy. Genome Biol. 2015;16:157. doi: 10.1186/s13059-015-0721-2. [DOI] [PMC free article] [PubMed] [Google Scholar]
- 57.Künstner A, Hoffmann M, Fraser BA, Kottler VA, Sharma E, Weigel D, Dreyer C. The genome of the Trinidadian guppy, Poecilia reticulata, and variation in the Guanapo population. PLoS One. 2016;11(12) [DOI] [PMC free article] [PubMed]
- 58.Davidson NM, Oshlack A. Corset: enabling differential gene expression analysis for de novo assembled transcriptomes. Genome Biol. 2014;15(7):410. [DOI] [PMC free article] [PubMed]
- 59.Robinson MD, McCarthy DJ, Smyth GK. edgeR: a bioconductor package for differential expression analysis of digital gene expression data. Bioinformatics. 2010;26:1. doi: 10.1093/bioinformatics/btp616. [DOI] [PMC free article] [PubMed] [Google Scholar]
- 60.Filby AL, Tyler CR. Appropriate 'housekeeping' genes for use in expression profiling the effects of environmental estrogens in fish. BMC Mol Biol. 2007;8(8):10. doi: 10.1186/1471-2199-8-10. [DOI] [PMC free article] [PubMed] [Google Scholar]
- 61.Tang R, Dodd A, Lai D, McNabb WC, Love DR. Validation of zebrafish (Danio rerio) reference genes for quantitative real-time RT-PCR normalization. Acta Biochim Biophys Sin. 2007;39(5):384–390. doi: 10.1111/j.1745-7270.2007.00283.x. [DOI] [PMC free article] [PubMed] [Google Scholar]
- 62.Bardou P, Mariette J, Escudié F, Djemiel C, Klopp C. Jvenn: an interactive Venn diagram viewer. BMC Bioinformatics. 2014;15:293. doi: 10.1186/1471-2105-15-293. [DOI] [PMC free article] [PubMed] [Google Scholar]
- 63.Kelley JL, Passow CN, Plath M, Arias Rodriguez L, Yee MC, Tobler M. Genomic resources for a model in adaptation and speciation research: characterization of the Poecilia mexicana transcriptome. BMC Genomics. 2012;13:652. doi: 10.1186/1471-2164-13-652. [DOI] [PMC free article] [PubMed] [Google Scholar]
- 64.Lamatsch DK, Adolfsson S, Senior AM, Christiansen G, Pichler M, Ozaki Y, Smeds L, Schartl M, Nakagawa S. A transcriptome derived female-specific marker from the invasive western mosquitofish (Gambusia affinis) PLoS One. 2015;10(2):e0118214. doi: 10.1371/journal.pone.0118214. [DOI] [PMC free article] [PubMed] [Google Scholar]
- 65.Li G, Zhao Y, Liu Z, Gao C, Yan F, Liu B, Feng J. De novo assembly and characterization of the spleen transcriptome of common carp (Cyprinus carpio) using Illumina paired-end sequencing. Fish Shellfish Immun. 2015;44(2):420–429. doi: 10.1016/j.fsi.2015.03.014. [DOI] [PubMed] [Google Scholar]
- 66.Yue H, Li C, Du H, Zhang S, Wei Q. Sequencing and de novo assembly of the gonadal transcriptome of the endangered Chinese sturgeon (Acipenser sinensis). PLoS One. 2015;10(6):e0127332. [DOI] [PMC free article] [PubMed]
- 67.Zhao QY, Wang Y, Kong YM, Luo D, Li X, Hao P. Optimizing de novo transcriptome assembly from short-read RNA-Seq data: a comparative study. BMC Bioinformatics. 2011;12(Suppl. 14):S2. [DOI] [PMC free article] [PubMed]
- 68.Chopra R, Burow G, Farmer A, Mudge J, Simpson CE, Burow MD. Comparisons of de novo transcriptome assemblers in diploid and polyploid species using peanut (Arachis spp.) RNA-Seq data. PLoS One. 2014;9(12):e115055. [DOI] [PMC free article] [PubMed]
- 69.Schurch NJ, Schofield P, Gierliński M, Cole C, Sherstnev A, Singh V, Wrobel N, Gharbi K, Simpson GG, Owen-Hughes T, Blaxter M, Barton GJ. How many biological replicates are needed in an RNA-seq experiment and which differential expression tool should you use? RNA. 2016;22(6):839–851. doi: 10.1261/rna.053959.115. [DOI] [PMC free article] [PubMed] [Google Scholar]
- 70.Koubova J, Menke DB, Zhou Q, Capel B, Griswold MD, Page DC. Retinoic acid regulates sex-specific timing of meiotic initiation in mice. PNAS. 2006;103(8):2474–2479. doi: 10.1073/pnas.0510813103. [DOI] [PMC free article] [PubMed] [Google Scholar]
- 71.Wojtasz L, Daniel K, Roig I, Bolcun-Filas E, Xu H, Boonsanay V, Eckmann CR, Cooke HJ, Jasin M, Keeney S, McKay MJ, Toth A. Mouse HORMAD1 and HORMAD2, two conserved meiotic chromosomal proteins, are depleted from synapsed chromosome axes with the help of TRIP13 AAA-ATPase. PLoS Genet. 2009;5(10):e1000702. doi: 10.1371/journal.pgen.1000702. [DOI] [PMC free article] [PubMed] [Google Scholar]
- 72.Keeney S. Mechanism and control of meiotic recombination initiation. Curr Top Dev Biol. 2001;52:1–53. doi: 10.1016/S0070-2153(01)52008-6. [DOI] [PubMed] [Google Scholar]
- 73.Kumar R, Bourbon H-M, de Massy B. Functional conservation of Mei4 for meiotic DNA double-strand break formation from yeasts to mice. Genes Dev. 2010;24:1266–1280. doi: 10.1101/gad.571710. [DOI] [PMC free article] [PubMed] [Google Scholar]
- 74.Schedina IM, Hartmann S, Groth D, Schlupp I, Tiedemann R. Comparative analysis of the gonadal transcriptomes of the all-female species Poecilia formosa and its maternal ancestor Poecilia mexicana. BMC Res Notes. 2014;7:249101. doi: 10.1186/1756-0500-7-249. [DOI] [PMC free article] [PubMed] [Google Scholar]
- 75.Rajyaguru P, Parker R. CGH-1 and the control of maternal mRNAs. Trends Cell Biol. 2008;19(1):24–28. doi: 10.1016/j.tcb.2008.11.001. [DOI] [PubMed] [Google Scholar]
- 76.Navarro RE, Shim EY, Kohara Y, Singson A, Blackwell TK. Cgh-1, a conserved predicted RNA helicase required for gametogenesis and protection from physiological germline apoptosis in C. elegans. Development. 2001;128:3221–3232. doi: 10.1242/dev.128.17.3221. [DOI] [PubMed] [Google Scholar]
- 77.Lynch M, Conery JS. The evolutionary fate and consequences of duplicate genes. Science. 2000;290(5494):1151–1155. doi: 10.1126/science.290.5494.1151. [DOI] [PubMed] [Google Scholar]
- 78.Hall AR, Colegrave N. Decay of unused characters by selection and drift. J Evol Biol. 2008;21(2):610–617. doi: 10.1111/j.1420-9101.2007.01473.x. [DOI] [PubMed] [Google Scholar]
- 79.Rice CS. Evolution of meiosis genes in sexual vs. asexual Potamopyrgus antipodarum. MS (Master of Science) thesis, University of Iowa, 2015.
- 80.Brandt A, Schaefer I, Glanz J, Schwander T, Maraun M, Scheu S, Bast J. Effective purifying selection in ancient asexual oribatid mites. Nat Commun. 2017;8(1):873. doi: 10.1038/s41467-017-01002-8. [DOI] [PMC free article] [PubMed] [Google Scholar]
- 81.Forche A, Alby K, Schaefer D, Johnson AD, Berman J, Bennett RJ. The parasexual cycle in Candida albicans provides an alternative pathway to meiosis for the formation of recombinant strains. PLoS Biol. 2008;6(5):e110. doi: 10.1371/journal.pbio.0060110. [DOI] [PMC free article] [PubMed] [Google Scholar]
- 82.Galli-Taliadoros LA, Sedgwick JD, Wood SA, Körner H. Gene knock-out technology: a methodological overview for the interested novice. J Immunol Methods. 1995;181(1):1–15. doi: 10.1016/0022-1759(95)00017-5. [DOI] [PubMed] [Google Scholar]
- 83.Wixon J. Featured organism: Danio rerio, the zebrafish. Yeast. 2000;17(3):225–231. doi: 10.1002/1097-0061(20000930)17:3<225::AID-YEA34>3.0.CO;2-5. [DOI] [PMC free article] [PubMed] [Google Scholar]
- 84.Taniguchi Y, Takeda S, Furutani-Seiki M, Kamei Y, Todo T, Sasado T, Deguchi T, Kondoh H, Mudde J, Yamazoe M, Hidaka M, Mitani H, Toyoda A, Sakaki Y, Plasterk RH, Cuppen E. Generation of medaka gene knockout models by target-selected mutagenesis. Genome Biol. 2006;7(12):R116. doi: 10.1186/gb-2006-7-12-r116. [DOI] [PMC free article] [PubMed] [Google Scholar]
- 85.Liu W, Li S-Z, Li Z, Wang Y, Li X-Y, Zhong J-X, Zhang X-J, Zhang J, Zhou L, Gui J-F. Complete depletion of primordial germ cells in an all-female fish leads to sex-biased gene expression alteration and sterile all-male occurrence. BMC Genomics. 2015;16:971. doi: 10.1186/s12864-015-2130-z. [DOI] [PMC free article] [PubMed] [Google Scholar]
- 86.Gui JF, Zhou L. Genetic basis and breeding application of clonal diversity and dual reproduction modes in polyploid Carassius auratus gibelio. Sci China Life Sci. 2010;53:409–415. doi: 10.1007/s11427-010-0092-6. [DOI] [PubMed] [Google Scholar]
- 87.Newton AA, Schnittker RR, Yu Z, Munday SS, Baumann DP, Neaves WB, Baumann P. Widespread failure to complete meiosis does not impair fecundity in parthenogenetic whiptail lizards. Development. 2016;143:4486–4494. doi: 10.1242/dev.141283. [DOI] [PMC free article] [PubMed] [Google Scholar]
- 88.Zhu F, Schlupp I, Tiedemann R. Allele-specific expression at the androgen receptor alpha gene in a hybrid unisexual fish, the Amazon molly (Poecilia formosa) PLoS One. 2017;12:e0186411. doi: 10.1371/journal.pone.0186411. [DOI] [PMC free article] [PubMed] [Google Scholar]
Associated Data
This section collects any data citations, data availability statements, or supplementary materials included in this article.
Supplementary Materials
Databases for the BLAST sequence similarity comparisons. (DOCX 14 kb)
Transcript length distribution for the de novo assemblies of the Amazon molly (P. formosa), the sailfin molly (P. latipinna), and the Atlantic molly (P. mexicana). (BMP 1741 kb)
Enrichment analysis of the generic GO slim terms evaluated using one-sided Fisher-Tests for P. formosa The. residues are given relative to the expected value, shown are significantly enriched (red) or depleted (blue) (p < 0,05) GOs for the three components: Molecular function (A), biological process (B), and cellular component (C). (BMP 4123 kb)
Enrichment analysis of the generic GO slim terms evaluated using one-sided Fisher-Tests for P. latipinna. The residues are given relative to the expected value, shown are significantly enriched (red) or depleted (blue) (p < 0,05) GOs for the three components: Molecular function (A), biological process (B), and cellular component (C). (BMP 4278 kb)
Enrichment analysis of the generic GO slim terms evaluated using one-sided Fisher-Tests for P. mexicana. The residues are given relative to the expected value, shown are significantly enriched (red) or depleted (blue) (p < 0,05) GOs for the three components: Molecular function (A), biological process (B), and cellular component (C). (BMP 4395 kb)
GO terms ID, the GO term names and the corresponding genes related to reproduction and meiosis for the orthogroups only detected in the sexual species. (DOCX 17 kb)
Blast results for the sequence comparisons between the Poecilia formosa transcriptome and the Uniprot/Swiss-Prot database. (TXT 7495 kb)
Blast results for the sequence comparisons between the Poecilia latipinna transcriptome and the Uniprot/Swiss-Prot database. (TXT 7176 kb)
Blast results for the sequence comparisons between the Poecilia mexicana transcriptome and the Uniprot/Swiss-Prot database. (TXT 8636 kb)
Data Availability Statement
The data underlying this publication can be obtained from the Sequence Read Archive (SRA) at the National Center for Biotechnology Information (NCBI) (BioProject: PRJNA385580 – P. formosa: SAMN06894540 | P. latipinna: SAMN06894541 | P. mexicana: SAMN06894542).