Abstract
Context:
Nutrition plays a vital role in the quality of life in postmenopausal women.
Aim:
The aim is to determine the dietary intake, physical activity, and assess the body mass index (BMI) among postmenopausal women.
Settings and Design:
A community-based sample survey.
Materials and Methods:
The present study included 140 postmenopausal women (40–70 years) from Udupi, Manipal areas of Karnataka. The study was carried out between July and December 2013. Sociodemographic data were collected using a questionnaire. Anthropometric data included height, weight, waist, and hip circumference. Dietary intake was determined using 24 h dietary recall. Physical activity information was collected.
Statistical Analysis Used:
Data were analyzed using SPSS version 16 software. Paired t-test was performed to determine the dietary adequacy.
Results:
Obesity was 42.1% among the study participants. Increased WHR and waist circumference were 82.1% and 77.1%. Mean daily intake of calcium and saturated fatty acids were significantly higher than recommended dietary allowance (RDA) (P < 0.001). Mean intake of energy, protein, carbohydrate, mono and poly unsaturated fatty acid, fiber and sodium were significantly lower than RDA (P < 0.001). Average daily intake of cereals, pulses, roots and tubers, meat and products, fats and oils, green leafy, and other vegetables were significantly (P < 0.001) lower than RDA. Intake of fruits, milk and milk products, and sugar was significantly higher (P < 0.001) than RDA. Only 37.1% of women performed moderate or active exercises regularly.
Conclusions:
Even though, nutrient and food group deficiencies were observed among postmenopausal women physical inactivity and effects of menopausal transition instigate increased BMI imposing a need to educate on nutrition and physical activity.
KEYWORDS: Dietary habits, exercise, food groups, food intake, nutritional status, postmenopausal women, quality of diet
INTRODUCTION
Menopause is a stage of women's life when reproductive capacity ceases.[1] India has a large population, with 43 million postmenopausal women and it is projected to be 103 million by 2026.[2] The average age of menopause is 47.5 years. Postmenopausal status is associated with higher prevalence of obesity.[3,4] Women in the midlife face many challenges, such as hormonal changes, increased weight gain, loss of bone and muscle mass, and digestive issues.[4] Evidence support that increasing number of women are suffering from one or more chronic disease associated risk factors following the ending of their menstrual cycles.[2] Diet and food intake have a pivotal role in maintaining human health. Unhealthy diet, obesity, and nutritional deficiencies may lead to various disorders.[3] A better understanding of the factors that contribute to chronic diseases including diabetes is vital.[4,5,6,7] There is a need to focus on the effects of optimal nutrition on the health and wellbeing of women during menopause. It is evident that good nutrition and optimizing the intake of specific nutrients, together with lifestyle changes can improve maintaining a healthy menopause.[6] According to modern lifestyle associated with easy access to food, lack of exercise, sedentary lifestyles, calorie dense foods, and excessive television viewing contribute to the development of noncommunicable diseases.[8] It observed that health of the postmenopausal women and overall well-being during the climacteric period is highly related to general good health and a healthy lifestyle including a balanced diet, nonsmoking habits, and regular physical exercise, a positive attitude toward aging and menopause.[9,10] Different lifestyle practices, particularly diet may delay the appearance of risk factors in this population group.[11] For menopause management, it is recommended that lifestyle changes as a primary modality of care including adequate exercise, diet-rich in phytoestrogens, calcium, fiber, and low in fat, especially saturated fats.[2] Dietary calcium intake and physical activity have a major impact on the bone health in postmenopausal women. Physical activity is defined as any bodily movement produced by skeletal a muscle that requires energy expenditure.[12] There are studies indicating that physical activity during menopause reduces the menopausal symptoms such as anxiety stress and depression.[13] Increasing menopausal population and the prevalence of comorbid conditions there is a rising need to understand about the South East Asian postmenopausal community.[14] Studies assessing macro- and micro-nutrient intake among Indian postmenopausal women is scarce; hence, this study aimed at determining the dietary intake, physical activity, and the body mass index (BMI) among the postmenopausal women.
MATERIALS AND METHODS
A community-based sample survey was carried out among 140 postmenopausal women between 40 and 70 years of age in Udupi and Manipal areas of the State of Karnataka.
Study period
July to December, 2013.
Inclusion criteria
Age >40 years
Women who had their last menstrual period before 12 months
Postmenopausal women who have delivered a child beyond 24 weeks of gestation.
Exclusion criteria
Nullipara women
Perimenopausal women
Women following a special diet.
Subjects were randomly selected. The Medical Ethics Committee of the Kasturba Hospital approved this study, and each study participant signed a written consent form.
A structured questionnaire was used to collect sociodemographic and physical activity level data. A dietary recall for 24 – h was used to obtain dietary information. Anthropometric data included (BMI = weight/height2), waist circumference (WC), and waist to hip ratio (WHR). Weight was taken using a digital scale, recorded to the accuracy of 0.1 kg. Participants were wearing lightweight clothing and without shoes. BMI was interpreted according to the World Health Organization (2012) recommendations. Waist circumference was measured with an inelastic tape at the midpoint between the iliac crest and the lower border of the last floating rib at the end of a normal expiration. Waist circumference was considered high when waist circumference >80 cm.[8] Statistical analyses were performed using statistical package for social sciences (SPSS) version 16 for Windows (SPSS Inc., Chicago, IL, USA), nutritional values were analyzed using Dietsoft software. Descriptive data were presented as percentages and frequencies for categorical variables and mean and the standard deviation was used for a continuous variable to interpret data. Chi-square and paired t-test were performed to determine the adequacy of macro nutrient, micro nutrient, and the food group intake, statistical significance was determined at P < 0.001.
RESULTS
The main characteristics of the study group are shown in Table 1. Among the women studied (40–70 years) of age majority (30.1%) were between 51 and 60 years of age. The mean age at menopause among the postmenopausal women was is 49.9 ± 3.9. About 44% of women were married and 36.9% had attended school. The dietary assessment of the study participants based on basic practices at home is given in Table 2. There were 62.7% nonvegetarians and 32.9% vegetarians. Table 3 shows the mean weight and BMI of the postmenopausal women were 60.6 ± 9.50 Kg and 24.59 ± 3.7Kg/m2, respectively. Level of physical activity among the postmenopausal women is given in Table 3. In this study, 77.1% of women had increased waist circumference. WHR observations show that 82.1% of the postmenopausal women were at risk of obesity. According to BMI 57.9% women belonged to the normal BMI category.
Table 1.
General characteristics of the study population
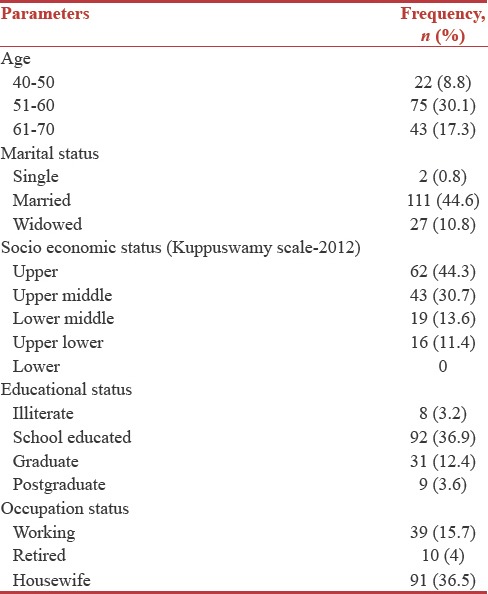
Table 2.
Dietary habits among the study population
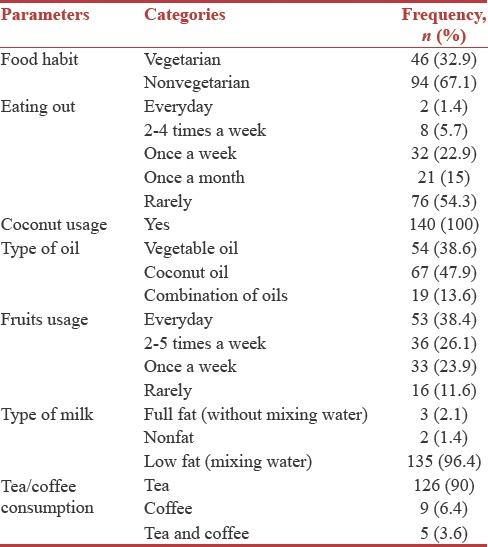
Table 3.
Anthropometric measurements among the study population
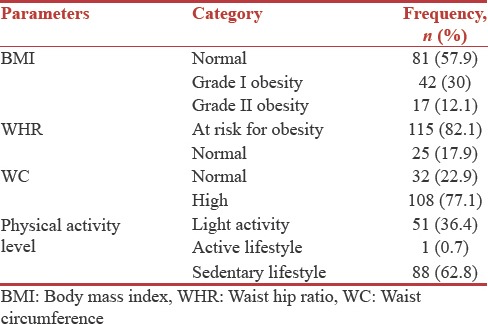
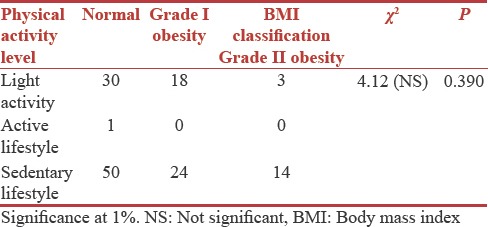
Table 4 shows the association between physical activity level and BMI categories, increased number (50.9%) of postmenopausal women who were leading a sedentary lifestyle and belonged to the grade II obese category. More postmenopausal women (58.8%) who practised light activity belonged to the normal BMI category.
Table 4.
Association between physical activity level and body mass index
The mean daily energy intake among the study participants was 1506.9 ± 242.6 kcal/day. Table 5 shows the carbohydrate, protein, and fat intake is 231.8 ± 34.2 g/day, 48.9 ± 8.9 g/day, and 42.7 ± 11.0 g/day, respectively. Mean intake of mono unsaturated fatty acid (MUFA) 1.159 ± 0.64 g/day, poly unsaturated fatty acid (PUFA) 0.29 ± 0.15 g/day, saturated fatty acid (SFA), 13.03 ± 0.64 g/day, fiber 12.2 ± 6.18 g/day, calcium 741 ± 189.8 mg/day, and sodium 368 ± 109.4 mg/day. Mean intake of calcium and SFAs were within the recommended dietary allowance (RDA) in our population. Energy, protein, carbohydrate, fat, fiber, sodium, PUFAs, and MUFAs intake were significantly lower (P < 0.001) than the suggested intake. The mean daily intake of total SFAs and calcium were significantly higher (P < 0.001) than the RDA for Indian postmenopausal women.
Table 5.
Macro and micro nutrient intake among the study population
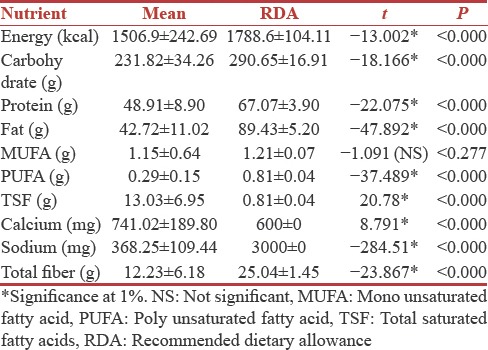
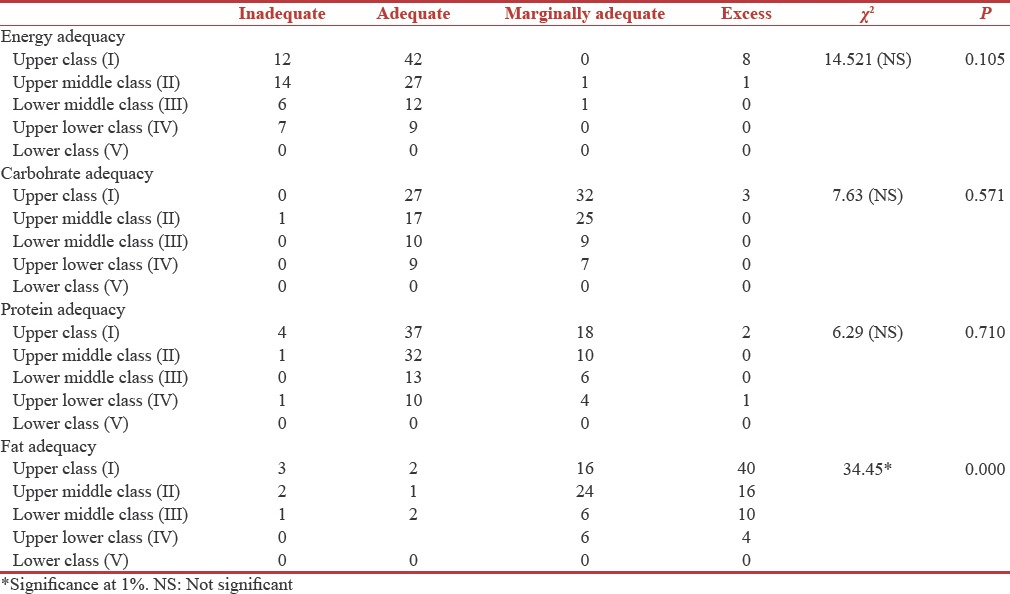
Table 6 shows the mean intake of different food group among the study population. The study observed that intake of cereals, pulses, green leafy vegetables, other vegetables, roots, and tubers, were significantly inadequate (P < 0.001), whereas milk and milk products, fruits, and sugar and jaggery were significantly (P < 0.001) adequate. The different types of physical activities assessed in the study are walking, sitting, standing, running/playing, out- and in-door activities, and sleeping as given in Table 7. Table 8 explains the association between socioeconomic status and the macro nutrient adequacy among the research participants. Energy 64.2%, carbohydrate 45%, protein 65.7%, and fat 7.5% of the women were consuming marginally adequately among the all socioeconomic groups.
Table 6.
Food group intake among the study population
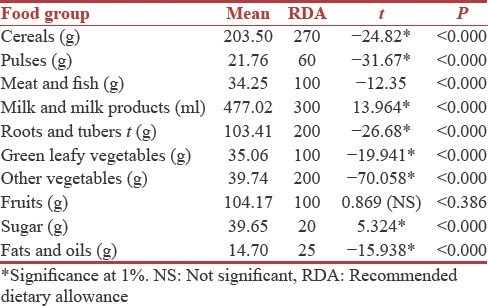
Table 7.
Different physical activities among postmenopausal women
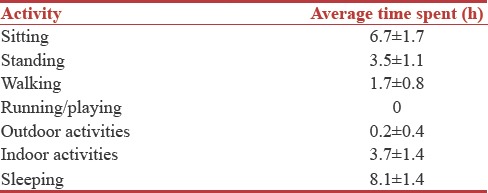
Table 8.
Association between socio economic status and macro nutrient adequacy
DISCUSSION
The mean age at menopause among the postmenopausal women was 49.9 which similar to the mean age at menopause for Indian women.[15,16] Dietary practices and physical activity levels have a potential to affects a person's quality of life. Studies focussing on current dietary intake among Indian postmenopausal women are scarce. Inadequate nutrient intake and poor levels of physical activity level may impose a risk for affecting the health. The present study aimed to understand the dietary intakes, physical activity level among postmenopausal women and its relationship to BMI. The study observed 42.1% of postmenopausal women in the obese category. Even though poor nutrition is observed among the study population lack of physical activity and effects of menopausal transition may be the leading cause for the increased BMI.[17,18] A large study carried out by[19] also stated that the accumulation of fat during menopause is more concentrated in the abdomen. Considering waist circumference and WHR, study participants were at increased risk of being obese.[20,21] have reported similar results when waist and hip measurements have been assessed in conjunction with BMI. Increased anthropometric measurements could put the postmenopausal women at risk for many disease conditions including breast cancer.[22] Increased waist circumference and WHR may be explained by sedentary lifestyle, faulty dietary practices which cause increased accumulation of abdominal fat, decreased basal metabolic rate with age and decreased energy expenditure which has also been studied among 402 postmenopausal women in Mysore, Karnataka.[18] Menopausal transition brings about anomalies in total body composition characterized by an increased body fat mass and central adiposity.[18] The different types of physical activities assessed in the study are walking, sitting, standing, running/playing, out- and in-door activities, and sleeping. Majority of the women did not engage in outdoor activities. Based on physical activity level data 62.4% postmenopausal women were leading a sedentary life style[23] reported similar results, increased waist circumference and WHR which may lead a pathway to variety of health concerns like diabetes[20] and increasing the risk for the cardio vascular disease.[18,24] Moderate physical activity, including brisk walking, may be beneficial for the improvement of the quality of life.[25] Interventions to increase physical activity should be recommended to prevent increases in adiposity. A randomised clinical study carried out by[26] showed that increased waist circumference and weight gain during menopause could be reduced with long-term physical activity and dietary intervention.
The RDAs for the postmenopausal women were compared with the current dietary intake and gaps in the macro- and micro-nutrient intake were observed. The RDAs energy 1788.6 ± 104.11 kcal, carbohydrate 290.65 ± 16.91 g, Protein 67.07 ± 3.90 g, fat 89.43 ± 5.20 g, PUFA 1.21 ± 0.07 g, MUFA0.81 ± 0.04 g, Total saturated fat (TSF) 0.81 ± 0.04 g, calcium 600 ± 0 mg, sodium 3000 ± 0 mg, and total fiber 25.04 ± 1.45 g. Only saturated fat intake and calcium were significantly adequate. In a study by[27] with 106 postmenopausal women in Tamil Nadu dietary calcium intake was significantly higher. Some studies have shown poor dietary intake among postmenopausal women.[23] The mean intake of protein was 48 g/day, and similar results were also reported by another study.[23] When compared the macro nutrient adequacies amongst all socioeconomic groups majority of the women were consuming a marginally adequate amounts of the macro nutrients carbohydrate, energy proteins, and fats. It was observed that fats were consumed in excess among all the socioeconomic groups, which indicates that the postmenopausal women were following faulty dietary habits. The recommended food group intake is as follows; cereals 270 g, pulses 60 g, meat and fish 100 g, milk and milk products 300 ml, roots and tubers 200 g, green leafy vegetables 100 g, other vegetables 200 g, fruits 100 g, fats and oils 20 g, sugar 25 g. All food groups' intakes were inadequate when compared except for milk and milk products, sugars, and fruits which were significantly higher than the RDA. Similar studies have shown that increased intake of fruits improves the bone mineral density.[28,29,30,31,32] Decreased intake of green leafy vegetables and other vegetables among postmenopausal women in the Thiruvananthapuram district similar to the current study results.[23,30] High intake of fruits and vegetables prolongs the reproductive lifespan because of the presence of antioxidants in fruits and vegetables that counteract the adverse effects of reactive oxygen species on the number and quality of ovarian follicles. The intake of tea among the study participant was 90% and regular tea consumption delays the age at menopause probably due to the antioxidant and nonsteroidal estrogenic effects of flavonoids that counteract the degenerative processes.[31] The study showed lower levels of PUFA intake, where a high intake of polyunsaturated fats accelerates age at menopause, whereas total fat and saturated fat intake has no effect on menopause.[31] This study recommends education and interventions on healthy eating, healthy life style including physical activity is necessary to promote and improve healthy ageing. The following study limitations are important when considering the reported findings. The small sample size due to convenience sampling restricts in generalizing the findings Even though the study collected dietary information by 24 h recall for 3 days, the estimations and recall may be faulty. The study is relevant with the current scenario among postmenopausal women as growing numbers are observed in the postmenopausal community. Nutrition and physical active have a major impact on the health and the well-being of the postmenopausal women. Measures need to be taken for the prevention of chronic disease.
CONCLUSIONS
The study highlights the poor intake of energy, carbohydrate, protein, monounsaturated fat, polyunsaturated fat, sodium and fiber, only calcium and saturated fat intakes were meeting the RDA for postmenopausal women. Based on the observed results among the postmenopausal women in Udupi and Manipal areas of Karnataka, all food group intakes were inadequate except milk and milk products, fruits, and sugars. Majority of the postmenopausal women had a normal BMI. Postmenopausal women were leading a sedentary life style according to physical activity level assessment.
Financial support and sponsorship
Nil.
Conflicts of interest
There are no conflicts of interest.
REFERENCES
- 1.World Health Organization. Research on the Menopause in the 1990s. Geneva: WHO; 1996. [Google Scholar]
- 2.Unni J. Third consensus meeting of Indian menopause society (2008): A summary. J Midlife Health. 2010;1:43–7. doi: 10.4103/0976-7800.66987. [DOI] [PMC free article] [PubMed] [Google Scholar]
- 3.Lambrinoudaki I, Brincat M, Erel CT, Gambacciani M, Moen MH, Schenck-Gustafsson K, et al. EMAS position statement: Managing obese postmenopausal women. Maturitas. 2010;66:323–6. doi: 10.1016/j.maturitas.2010.03.025. [DOI] [PubMed] [Google Scholar]
- 4.Khokhar KK, Kaur G, Sidhu S. Prevalence of obesity in working premenopausal and postmenopausal women of Jalandhar district, Punjab. J Hum Ecol. 2010;29:57–62. [Google Scholar]
- 5.Marjani A, Moghasemi S. The metabolic syndrome among postmenopausal women in Gorgan. Int J Endocrinol. 2012;2012:953627. doi: 10.1155/2012/953627. [DOI] [PMC free article] [PubMed] [Google Scholar]
- 6.Sharma S, Aggarwal N, Joshi B, Suri V, Badada S. Prevalence of metabolic syndrome in pre- and post-menopausal women: A prospective study from apex institute of North India. J Midlife Health. 2016;7:169–74. doi: 10.4103/0976-7800.195695. [DOI] [PMC free article] [PubMed] [Google Scholar]
- 7.Sapkota AS, Sapkota A, Kumananda A, Raut M, Jha B. Study of metabolic syndrome in postmenopausal women. Ann Clin Chem Lab Med. 2015;1:6–11. [Google Scholar]
- 8.Kelishadi R, Alikhani S, Delavari A, Alaedini F, Safaie A, Hojatzadeh E, et al. Obesity and associated lifestyle behaviours in Iran: Findings from the first national non-communicable disease risk factor surveillance survey. Public Health Nutr. 2008;11:246–51. doi: 10.1017/S1368980007000262. [DOI] [PubMed] [Google Scholar]
- 9.Guthrie JR, Smith AM, Dennerstein L, Morse C. Physical activity and the menopause experience: A cross-sectional study. Maturitas. 1994;20:71–80. doi: 10.1016/0378-5122(94)90002-7. [DOI] [PubMed] [Google Scholar]
- 10.Greene JG, Visser AP. Longitudinal studies: Comparative conclusions. Maturitas. 1992;14:157–60. doi: 10.1016/0378-5122(92)90007-q. [DOI] [PubMed] [Google Scholar]
- 11.Owens JF, Matthews KA, Räikkönen K, Kuller LH. It is never too late: Change in physical activity fosters change in cardiovascular risk factors in middle-aged women. Prev Cardiol. 2003;6:22–8. doi: 10.1111/j.1520-037x.2003.00972.x. [DOI] [PubMed] [Google Scholar]
- 12.World Health Organization. Global Strategy on Diet, Physical Activity and Health. Global Strategy Report. Geneva: WHO; 2002. [Google Scholar]
- 13.Nelson DB, Sammel MD, Freeman EW, Lin H, Gracia CR, Schmitz KH, et al. Effect of physical activity on menopausal symptoms among urban women. Med Sci Sports Exerc. 2008;40:50–8. doi: 10.1249/mss.0b013e318159d1e4. [DOI] [PubMed] [Google Scholar]
- 14.Singh A, Pradhan SK. Menopausal symptoms of postmenopausal women in a rural community of Delhi, India: A cross-sectional study. J Midlife Health. 2014;5:62–7. doi: 10.4103/0976-7800.133989. [DOI] [PMC free article] [PubMed] [Google Scholar]
- 15.Pallikadavath S, Ogollah R, Singh A, Dean T, Dewey A, Stones W, et al. Natural menopause among women below 50 years in India: A population-based study. Indian J Med Res. 2016;144:366–77. doi: 10.4103/0971-5916.198676. [DOI] [PMC free article] [PubMed] [Google Scholar]
- 16.Kaur M, Talwar I. Age at natural menopause among rural and urban Punjabi brahmin females. Anthropol. 2009;11:255–8. [Google Scholar]
- 17.Matthews KA, Abrams B, Crawford S, Miles T, Neer R, Powell LH, et al. Body mass index in mid-life women: Relative influence of menopause, hormone use, and ethnicity. Int J Obes Relat Metab Disord. 2001;25:863–73. doi: 10.1038/sj.ijo.0801618. [DOI] [PubMed] [Google Scholar]
- 18.Dasgupta S, Salman M, Lokesh S, Xaviour D, Saheb SY, Prasad BV, et al. Menopause versus aging: The predictor of obesity and metabolic aberrations among menopausal women of Karnataka, South India. J Midlife Health. 2012;3:24–30. doi: 10.4103/0976-7800.98814. [DOI] [PMC free article] [PubMed] [Google Scholar]
- 19.Davis SR, Castelo-Branco C, Chedraui P, Lumsden MA, Nappi RE, Shah D, et al. Understanding weight gain at menopause. Climacteric. 2012;15:419–29. doi: 10.3109/13697137.2012.707385. [DOI] [PubMed] [Google Scholar]
- 20.Klein S, Allison DB, Heymsfield SB, Kelley DE, Leibel RL, Nonas C, et al. Waist circumference and cardiometabolic risk: A consensus statement from shaping America's health: Association for weight management and obesity prevention; NAASO, the obesity society; the American society for nutrition; and the American diabetes association. Am J Clin Nutr. 2007;85:1197–202. doi: 10.1093/ajcn/85.5.1197. [DOI] [PubMed] [Google Scholar]
- 21.Mahajan N, Aggarwal M, Bagga A. Health issues of menopausal women in North India. J Midlife Health. 2012;3:84–7. doi: 10.4103/0976-7800.104467. [DOI] [PMC free article] [PubMed] [Google Scholar]
- 22.Mathew A, Gajalakshmi V, Rajan B, Kanimozhi V, Brennan P, Mathew BS, et al. Anthropometric factors and breast cancer risk among urban and rural women in South India: A multicentric case-control study. Br J Cancer. 2008;99:207–13. doi: 10.1038/sj.bjc.6604423. [DOI] [PMC free article] [PubMed] [Google Scholar]
- 23.Raj JP, Oommen AM, Paul TV. Dietary calcium intake and physical activity levels among urban South Indian postmenopausal women. J Family Med Prim Care. 2015;4:461–4. doi: 10.4103/2249-4863.161355. [DOI] [PMC free article] [PubMed] [Google Scholar]
- 24.Panotopoulos G, Raison J, Ruiz JC, Guy-Grand B, Basdevant A. Weight gain at the time of menopause. Hum Reprod. 1997;12(Suppl 1):126–33. doi: 10.1093/humrep/12.suppl_1.126. [DOI] [PubMed] [Google Scholar]
- 25.Schoppen S, Carbajal A, Pérez-Granados AM, Vivas F, Vaquero MP. Food, energy and macronutrient intake of postmenopausal women from a menopause program. Nutr Hosp. 2005;20:101–9. [PubMed] [Google Scholar]
- 26.Eliassen AH, Hankinson SE, Rosner B, Holmes MD, Willett WC. Physical activity and risk of breast cancer among postmenopausal women. Arch Intern Med. 2010;170:1758–64. doi: 10.1001/archinternmed.2010.363. [DOI] [PMC free article] [PubMed] [Google Scholar]
- 27.Simkin-Silverman LR, Wing RR, Boraz MA, Kuller LH. Lifestyle intervention can prevent weight gain during menopause: Results from a 5-year randomized clinical trial. Ann Behav Med. 2003;26:212–20. doi: 10.1207/S15324796ABM2603_06. [DOI] [PubMed] [Google Scholar]
- 28.Chen YM, Ho SC, Woo JL. Greater fruit and vegetable intake is associated with increased bone mass among postmenopausal Chinese women. Br J Nutr. 2006;96:745–51. [PubMed] [Google Scholar]
- 29.Macdonald HM, New SA, Golden MH, Campbell MK, Reid DM. Nutritional associations with bone loss during the menopausal transition: Evidence of a beneficial effect of calcium, alcohol, and fruit and vegetable nutrients and of a detrimental effect of fatty acids. Am J Clin Nutr. 2004;79:155–65. doi: 10.1093/ajcn/79.1.155. [DOI] [PubMed] [Google Scholar]
- 30.Praveena D. Dietary pattern of post-menopausal women. Food Sci Res J. 2015;6:268–72. [Google Scholar]
- 31.Sapre S, Thakur R. Lifestyle and dietary factors determine age at natural menopause. J Midlife Health. 2014;5:3–5. doi: 10.4103/0976-7800.127779. [DOI] [PMC free article] [PubMed] [Google Scholar]
- 32.Kaur G, Chawla P. Impact of nutritional counselling on nutritional status of post-menopausal women. J Food Nutr Sci. 2015;6:429–36. [Google Scholar]


