

Abstract
Drug-induced liver injury (DILI) is a major cause of drug failures in both the preclinical and clinical phase. Consequently, improving prediction of DILI at an early stage of drug discovery will reduce the potential failures in the subsequent drug development program. In this regard, high-content screening (HCS) assays are considered as a promising strategy for the study of DILI; however, the predictive performance of HCS assays is frequently insufficient. In the present study, a new testing strategy was developed to improve DILI prediction by employing in vitro assays that was combined with the RO2 model (i.e., ‘rule-of-two’ defined by daily dose ≥100 mg/day & logP ≥3). The RO2 model was derived from the observation that high daily doses and lipophilicity of an oral medication were associated with significant DILI risk in humans. In the developed testing strategy, the RO2 model was used for the rational selection of candidates for HCS assays, and only the negatives predicted by the RO2 model were further investigated by HCS. Subsequently, the effects of drug treatment on cell loss, nuclear size, DNA damage/fragmentation, apoptosis, lysosomal mass, mitochondrial membrane potential, and steatosis were studied in cultures of primary rat hepatocytes. Using a set of 70 drugs with clear evidence of clinically relevant DILI, the testing strategy improved the accuracies by 10 % and reduced the number of drugs requiring experimental assessment by approximately 20 %, as compared to the HCS assay alone. Moreover, the testing strategy was further validated by including published data (Cosgrove et al. in Toxicol Appl Pharmacol 237:317–330, 2009) on drug-cytokine-induced hepatotoxicity, which improved the accuracies by 7 %. Taken collectively, the proposed testing strategy can significantly improve the prediction of in vitro assays for detecting DILI liability in an early drug discovery phase.
Keywords: Drug-induced liver injury, DILI, High-content screening assay, Primary rat hepatocytes, Drug safety assessment
Introduction
Drug-induced liver injury (DILI) is a major cause for the termination of clinical development programs, partly due to the fact that routine animal toxicity testing is insufficiently powered to predict clinical hepatotoxicity (Kaplowitz 2005). A survey revealed that regulatory toxicology studies with two species (rodent and non-rodent) failed to identify risk of DILI in humans in approximately 45 % of cases, as seen in subsequent clinical trials (Olson et al. 2000). Therefore, there is unmet need to improve DILI prediction, and several collaborative efforts have been initiated to better understand causes of DILI and its prevention, and this includes the Liver Toxicity Knowledge Base (LTKB) launched by the US Food and Drug Administration (FDA)’s National Center for Toxicological Research (Chen et al. 2013c).
Notably, the significant advances of in silico and in vitro approaches hold promise for the development of an improved testing strategy that permits prediction of human hepatotoxicity more reliably and at the same time avoids unnecessary animal testing (Thomas and Will 2012). In this regard, high-content screening (HCS) is a major breakthrough (Bleicher et al. 2003) for its ability to monitor multiple cellular endpoints simultaneously in live cells as to allude to the possible pathogenesis of toxicity. HCS is a facile methodology and is not limited to the quantification of single endpoint such as cell death determined in cytotoxicity assays (Gomez-Lechon et al. 2010). It is considered as a promising methodology in the drug discovery and early preclinical drug development phase. Several studies reported the utility of HCS for assessing the risk of liver liabilities caused by drugs or chemicals (O’Brien et al. 2004; Xu et al. 2008; Khetani et al. 2013). For example, Xu et al. (2008) used primary human hepatocytes and determined an approximately 50 % sensitivity and 95 % specificity for over 300 drugs/chemicals. Notwithstanding, the reported sensitivities are relatively low and thus will inevitably increase the risk of drug failure in the subsequent development program. Some efforts such as extending the culture duration of hepatocytes were proposed (Khetani et al. 2013); however, the throughput of drug testing decreased while the cost of in vitro screening increased.
To improve its predictive performance, an integration of in silico approaches with HCS methodologies has been proposed (Iskar et al. 2011). Indeed, in silico models can assist in the prediction of safety of new drug candidates and allow the rapid screening of literately unlimited number of chemicals. Thus, several studies reported the utility of in silico models for the prediction of human hepatotoxicity (Ekins et al. 2010; Greene et al. 2010; Chen et al. 2013b), and recently, Chen et al. reported for oral medications at high daily doses and lipophilicity a significant increased risk for clinical DILI as determined by the ‘rule-of-two’ (RO2, i.e., daily dose ≥100 mg/day & logP ≥ 3) (Chen et al. 2013a). While the RO2 model alone added value to the prediction of clinically relevant human hepatotoxicity (Kaplowitz 2013), its performance was still insufficient due to the limited sensitivity caused by a high rate of false negatives.
In the present study, we investigated the combined use of the RO2 model and a HCS testing strategy aimed at better identifying liabilities for liver injury induced by drugs or chemicals. For this purpose, a primary rat hepatocyte-based HCS assay was studied by investigating the negatives predicted from the RO2 model, thereby refining the results obtained from in silico methods alone. Furthermore, we implemented published data on drug-induced cytokine release (Cosgrove et al. 2009) into our testing strategy to improve its predictive performance. Our study demonstrates that the proposed testing strategy improves the accuracies of detecting risk for DILI by approximately 10 % and at the same time contributes to the reduction of experimental cost by assisting in the rational selection of candidates for HCS and subsequent animal studies.
Materials and methods
Drugs and DILI classification
Drugs were purchased from Sigma Chemicals (St. Louis, MO) or the United States Pharmacopeia (http://www.usp.org/).
Two classification methods for DILI risk in humans with a concordance of approximately 90 % have been reported (Chen et al. 2011). In one approach, drugs were classified by most-, less-, and no-DILI concern according to the DILI concern disclosed in the FDA-approved drug labels (Chen et al. 2011). In another independent approach, drugs were categorized into four hepatotoxic groups (Greene et al. 2010): NE (no evidence for hepatotoxicity in any species), WE (weak evidence for human hepatotoxicity with <10 case reports, but generally considered not to present a risk for liver injury in humans), HH (evidence for hepatotoxicity in humans), and AH (animal hepatotoxicity observed, not tested in humans). Using the two approaches in combination, a drug is defined as human hepatotoxicity positive, if it is classified as most-DILI-concern or HH, or as negative, if it is classified as no-DILI-concern or NE.
High-content screening assay based on primary rat hepatocytes
In cooperation with Cellumen Inc. (acquired by Cyprotex Inc. in 2010), the HCS assay measured the effects of drug treatment on cell loss, nuclear size, DNA damage, apoptosis, lysosomal mass, DNA fragmentation, mitochondrial membrane potential, and steatosis (as listed in Table 1) in primary rat hepatocytes by applying the cellular systems biology approach (CellCiphr® profile). Briefly, the primary hepatocytes isloated from male Sprague-Dawley rats were plated as a monolayer with cell viability in the range of 80–95 %. The cells are treated on the day of isolation to maximize metabolic activity. Using a twofold dilution series, 10-point titrations for each compound were tested in the cell culture for up to 48 h. After an initial screening of 200 compounds, we selected a total of 70 drugs with clear annotation based on FDA labels. The drugs were divided into two groups (test phases A and B). For test phase A, n = 38 drugs were studied at a maximum of 200 μM. In test phase B, n = 32 drugs were studied at a maximum concentration of 100 times Cmax (i.e., maximum human therapeutic serum concentration). The dose–response curves were constructed as twofold dilutions based on 10-point titrations at 1, 24, and 48 h.
Table 1.
The eight cellular endpoints measured in the high-content screening assay based on primary rat hepatocytes
| Endpoint | Description |
|---|---|
| Cell loss | Fraction cell loss relative to negative control wells |
| Nuclear size | Equivalent diameter of the nucleus in microns |
| DNA damage | Activation of GADD153 |
| Apoptosis | Release of cytochrome C from mitochondria |
| Lysosomal mass | Lysosomal signal per cell |
| DNA fragmentation | Nuclear texture |
| Mitochondrial membrane potential | Mitochondrial spot intensity |
| Steatosis | Accumulation of fat globules |
The endpoints were captured in a time- and concentration-dependent fashion at 1, 24, and 48 h after treatment of primary rat hepatocytes. The assay was performed in 384-well plates with extensive intra-plate and inter-plate quality controls (n = 10). An ArrayScan VTI HCS Reader in the high-resolution mode was used to capture the data after treatment, and the images collected from each well of the dose–response series were processed using Graph Pad Prism (Graph Pad Software Inc., La Jolla, CA). As an example in Fig. 1, a dose–response series was obtained from the measurements to estimate the drug treatment effects. Furthermore, the dose–response curves were fitted using a standard 4-parameter logistic model. A set of quality control metrics, such as the correlation coefficient and fitting degree, was used to automatically accept or reject curves. These metrics were developed based on the quality of curve fitting and the likelihood that the curve accurately represents a dose–response relationship. The reports were further manually reviewed after the automatic analysis. If the dose–response curve passed this quality control, the EC50 (i.e., concentration where 50 % of the measured endpoints has changed) was calculated from the curve to determine the drug-induced effect.
Fig. 1.
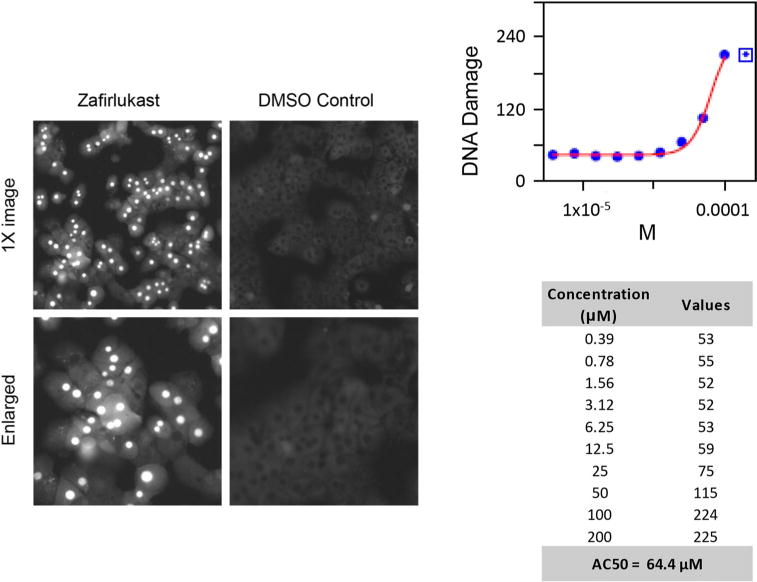
An illustration of a high-content screening assay and its measurement of DNA damage. The left side displays the images from the HCS assay, including the treatment with zafirlukast and the DMSO control. The right side shows 10 half-sequence doses and their dose–response curve. The EC50 of DNA damage was calculated from this dose–response curve
RO2 model for DILI prediction
A significant association with risk for DILI in humans was identified among 164 FDA-approved oral medications of lipophilic drugs (logP ≥ 3) given at high daily doses (≥100 mg/day) and was defined as the RO2 (Chen et al. 2013a). This rule was applied and verified using an independent set of 179 oral medications, drug pairs with similar chemical structures and molecular targets but different DILI potential, and in clinical case studies with complex co-medication regimes. The RO2 model yields 30–35 % sensitivities and 90–95 % specificities assessed by two large sets of drugs, respectively.
Integrated testing strategy by combining the HCS assay and the RO2 model
A hierarchical testing strategy was developed by integrating the RO2 model with the HCS assay to improve predictive power. Considering the relatively low sensitivity and high false-negative rate of the RO2 model, the HCS assay was applied to the negatives predicted from the RO2 model to further stratify candidate selection, thereby improving the sensitivity. The testing strategy is detailed in Fig. 2, and the prediction results of individual models are summarized in the Supplemental Table 1.
Fig. 2.
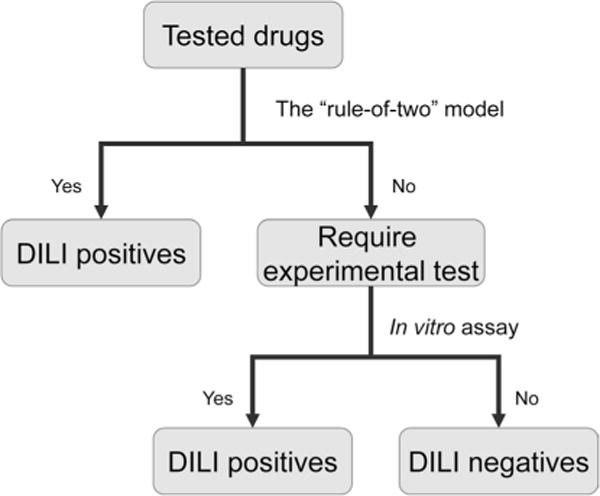
Flowchart of the new testing strategy integrating the in vitro assays with the RO2 model. Specifically, the in vitro assay was applied to the negatives predicted from the RO2 model to further stratify candidate selection and thereby improve the sensitivity. The drugs predicted to be positive by the RO2 model are not considered for further experimental test. The numbers of drugs requiring experimental tests are listed in Tables 4 and 5
Drug-cytokine in vitro model for DILI prediction
Drug-induced cytokine release is associated with aggravated hepatotoxicity and is observed with a variety of drugs. Notably, in the study of Cosgrove et al. (2009), human hepatocyte cultures were treated with a mix of individual drugs and different cytokines. Approximately 25 % sensitivity and 97 % specificity for DILI prediction were reported using a large compendium of drugs. The data from the in vitro assay of Cosgrove et al. (2009) were combined with the RO2 model using the proposed testing strategy for an improved prediction of DILI (Supplemental Table 2).
Data analysis
A harmless ratio defined as EC50/Cmax was employed to enhance the human relevance of the cellular responses observed in an HCS assay (Tolosa et al. 2012); a higher value represents a safer effect observed by an endpoint measured at a specific time point by the HCS assay. The threshold to define a positive test in an assay is of importance for appropriately assessing its predictive performance. The measurement of an assay at a concentration of 100 times Cmax has been widely adopted to evaluate the outcome of an in vitro assay (Dykens et al. 2008; Porceddu et al. 2012). Thus, a test was defined as positive when its harmless ratio was <100, otherwise it was considered as negative. Subsequently, the readout of the HCS assay was assigned as positive when at least one of the selected cellular parameters was positive; this so-called logical OR method has been widely adopted for in vitro testing (Xu et al. 2008; Khetani et al. 2013).
Sensitivity, specificity, and accuracy were used to measure a model’s predictive performance. Sensitivity was defined as the fraction of the human hepatotoxicity positive drugs that were defined as positives by an assay (i.e., true predicted positives/hepatotoxicity positives), and specificity was defined as the fraction of the human hepatotoxicity negative drugs that were defined as negatives by an assay (i.e., true predicted negatives/hepatotoxicity negatives).
Results
The testing strategy consisted of the combined use of HCS and in silico modeling. Using primary rat hepatocytes, we determined the effects of drug treatment on cell loss, nuclear size, DNA damage, apoptosis, lysosomal mass, DNA fragmentation, mitochondrial membrane potential, and steatosis. Figure 1 depicts an image for assaying DNA damage while Fig. 2 elaborates on the integrated testing strategies. In all, the predictive performances of the models were assessed by a total of 70 drugs annotated for their clinical relevance to cause liver injury and published data on inflammation-associated hepatotoxicity.
The HCS model based on primary rat hepatocytes
Initially, we assessed the responses of the endpoints measured by the HCS assay and their relevance for predicting clinical DILI. Drugs were grouped according to the section of drug labels for DILI concern, notably Box Warning, Warnings & Precautions, Adverse Reactions, and No Match. The percentages of the activated responses across the 8 cellular endpoints are illustrated in Fig. 3a. Apparently, more endpoints were responsive at the prolonged drug exposure, with steatosis, cell loss, and DNA damage as most frequent findings. Conversely, apoptosis, DNA fragmentation, nuclear size, lysosomal mass, and mitochondrial membrane potential were less frequently modulated. The average harmless ratios of the cellular endpoints decreased in the sequence of No Match > Adverse Reactions > Warnings & Precautions > Box Warning. Statistically significant correlations were identified between the measured harmless ratios and the risks for DILI (Fig. 3b). Specifically, both the Box Warning and the Warnings & Precautions drugs have significantly lower harmless ratios than those of the No Match drugs (P < 0.001), while the Adverse Reactions drugs do not have significantly different harmless ratios from the No Match drugs.
Fig. 3.
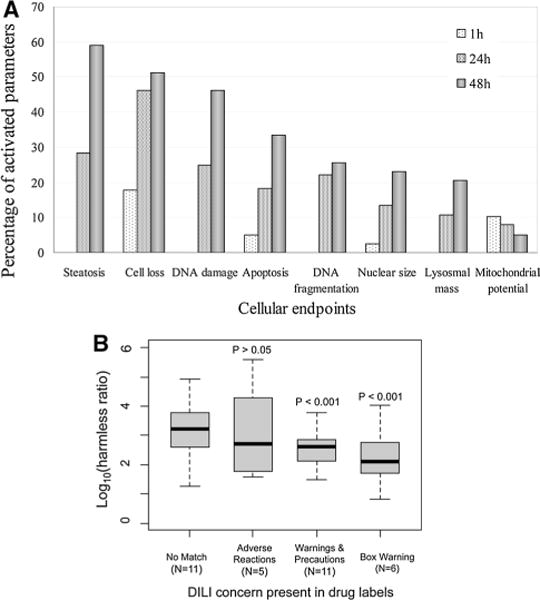
Overview of the measured cellular endpoints of the HCS assay. a The distribution of measured cellular endpoints. b The distribution of harmless ratio grouped by drug label sections, including Box Warning, Warnings and Precautions, Adverse Reactions, and No Match. Two-sided t-tests were applied to compare the harmless ratios of Box Warning, Warnings and Precautions, or Adverse Reactions groups versus the No Match group, and the derived p values were marked
In vitro assays using a single cellular parameter have shown approximately 5–10 % sensitivity and >90 % specificity for the prediction of human hepatotoxicity (Xu et al. 2004). In the present study, we selected the cellular parameters for the model development by a combination of the endpoint and measured time point unless their sensitivity was >5 % and specificity was 100 % when assessed by the 38 drugs (positive/negative = 22/17, Table 2).
Table 2.
High-content screening of 38 drugs was studied at a maximum concentration of 200 μM using a total of 9 selected cellular parameters
| Compounds | Human DILI | Cmax (μM) | 1-h Harmless ratio
|
24-h Harmless ratio
|
48-h Harmless ratio
|
HCS test | ||||||
|---|---|---|---|---|---|---|---|---|---|---|---|---|
| CLs | MtP | DND | Apt | DNF | DND | Apt | DNF | MtP | ||||
| Acitretin | Positive | 1.28 | – | 80 | 393 | 328 | – | 35 | 882 | – | 80 | Positive |
| Amiodarone | Positive | 0.85 | – | – | 157 | 35 | 52 | – | – | – | – | Positive |
| Chlorpromazine | Positive | 0.94 | 113 | – | 51 | – | 230 | – | – | – | – | Positive |
| Cyclosporine | Positive | 0.78 | – | – | 2 | – | – | 8 | 31 | 472 | – | Positive |
| Nefazodone | Positive | 0.93 | 95 | 90 | 59 | – | – | 47 | 57 | 59 | – | Positive |
| Nomifensine | Positive | 1.20 | – | – | 484 | 86 | 148 | 445 | 128 | 117 | – | Positive |
| Tamoxifen | Positive | 0.17 | 413 | – | 376 | – | 107 | 349 | 228 | 90 | – | Positive |
| Zafirlukast | Positive | 1.21 | 199 | 92 | 53 | 101 | 337 | 796 | 98 | 131 | – | Positive |
| Cisplatin | Positive | 0.02 | – | – | – | – | – | – | – | – | – | Negative |
| Naltrexone | Positive | 0.06 | – | – | – | – | – | 6,282 | – | – | – | Negative |
| Progesterone | Positive | 0.19 | – | – | – | – | 628 | – | – | – | – | Negative |
| Azathioprine | Positive | 0.34 | – | – | – | 591 | 479 | – | 600 | 409 | – | Negative |
| Busulfan | Positive | 0.28 | – | – | – | – | – | – | – | – | – | Negative |
| Clonidine | Positive | 0.00 | – | – | – | – | – | – | – | – | – | Negative |
| Cyclofenil | Positive | 0.21 | – | – | – | – | – | – | – | – | – | Negative |
| Flutamide | Positive | 0.36 | – | – | – | 539 | 798 | 856 | 307 | – | – | Negative |
| Mebendazole | Positive | 0.13 | – | – | – | – | – | – | – | – | – | Negative |
| Methotrexate | Positive | 0.77 | – | – | – | – | 853 | – | – | 750 | – | Negative |
| Moxisylyte | Positive | 0.16 | – | – | 2,984 | 635 | 1,403 | 1,118 | – | – | Negative | |
| Nifedipine | Positive | 0.27 | – | – | – | 3,017 | 631 | – | – | – | Negative | |
| Verapamil | Positive | 0.16 | – | – | – | – | – | 393 | – | – | – | Negative |
| Bambuterol | Negative | 0.03 | – | – | – | – | – | – | – | – | – | Negative |
| Biotin | Negative | 0.00 | – | – | – | – | – | – | – | – | – | Negative |
| Buspirone | Negative | 0.02 | – | – | 25,573 | – | – | 19,904 | – | – | – | Negative |
| Hydrocortisone | Negative | 0.84 | – | – | – | – | – | – | – | – | – | Negative |
| Isoproterenol | Negative | 0.95 | – | – | – | 1,553 | 1,553 | 693 | 558 | – | 276 | Negative |
| Loratadine | Negative | 0.05 | 3,828 | 4,020 | – | – | 2,259 | 898 | – | – | – | Negative |
| Oxyphenonium | Negative | 0.30 | – | – | 1,120 | 2,073 | – | 1,647 | – | – | – | Negative |
| Physostigmine | Negative | 0.01 | – | – | 77,786 | 43,918 | 69,939 | 24,368 | 55,896 | 58,650 | – | Negative |
| Pinacidil | Negative | 0.31 | – | – | – | – | – | – | – | – | – | Negative |
| Propranolol | Negative | 0.20 | – | – | 1,157 | 1,356 | 967 | 594 | 663 | 783 | – | Negative |
| Pyridoxine | Negative | 0.12 | – | – | – | – | – | – | – | – | – | Negative |
| Scopolamine | Negative | 0.01 | – | – | – | – | – | – | – | – | – | Negative |
| Cromoglicic acid | Negative | 0.02 | – | – | – | – | – | – | – | – | – | Negative |
| Cyanocobalamin | Negative | 0.27 | – | – | – | – | – | – | – | – | – | Negative |
| Caunorubicin | Negative | 0.38 | 257 | – | – | – | – | – | – | – | – | Negative |
| Flumazenil | Negative | 1.12 | – | – | – | – | – | – | – | – | – | Negative |
| Miconazole | Negative | 0.03 | 5,983 | – | – | 1,713 | 2,238 | 2,957 | 1,651 | 2,063 | – | Negative |
The classification of human DILI was determined by the Chen et al. and Greene et al. approaches (Greene et al. 2010; Chen et al. 2011). Specifically, a drug is defined as human hepatotoxicity positive if it is classified as most-DILI-concern or HH, or as negative if it is classified as no-DILI-concern or NE. Numbers in the table represent the harmless ratio (i.e., EC50/Cmax), and the bold/italicized numbers indicate a positive test defined by a harmless ratio of <100. A dash means no response detected. Abbreviation: Cell Loss (CLs); Mitochondrial membrane Potential (MtP); DNA damage (DND); Apoptosis (Apt); DNA fragmentation (DNF)
The selected parameters were used to construct a predictive model using the logical OR operator, in which a drug was assigned as positive when any one of the nine selected parameters suggested it to be positive (i.e., its harmless ratio was <100). Consequently, 8 of the 22 DILI positive drugs and none of the 17 DILI negative drugs were assigned as the predicted positives, resulting in an overall 38 % (8/21) sensitivity and 100 % (17/17) specificity. The drugs assigned as positive were acitretin, amiodarone, chlorpromazine, cyclosporine, nefazodone, nomifensine, tamoxifen, and zafirlukast.
An additional 32 drugs were used to verify the predictive model based on the HCS assay. As indicated in Table 3, 11 of the 28 DILI positive drugs were predicted as positive while all of the other drugs were considered negative, resulting in 39 % (11/28) sensitivity and 100 % (4/4) specificity. The drugs positively predicted were acetaminophen, carbamazepine, carboplatin, chlorpropamide, clofibrate, cyclophosphamide, hydroxyurea, ifosfamide, sulindac, tolbutamide, and valproic acid.
Table 3.
High-content screening of additional 32 drugs at concentrations of up to 100 times of human therapeutic Cmax
| Compounds | Human DILI | Cmax (μM) | 1-h Harmless Ratio
|
24-h Harmless Ratio
|
48-h Harmless ratio
|
HCS test | ||||||
|---|---|---|---|---|---|---|---|---|---|---|---|---|
| CLs | MtP | DND | Apt | DNF | DND | Apt | DNF | MtP | ||||
| Acetaminophen | Positive | 132 | – | 67 | 6 | 352 | 241 | 15 | 279 | 198 | 91 | Positive |
| Carbamazepine | Positive | 26 | – | – | 28 | – | – | – | – | – | – | Positive |
| Carboplatin | Positive | 108 | – | – | – | – | 19 | – | – | 19 | – | Positive |
| Chlorpropamide | Positive | 130 | – | – | – | 163 | 17 | 17 | 89 | – | – | Positive |
| Clofibrate | Positive | 408 | – | 70 | 50 | 248 | – | – | – | – | – | Positive |
| Cyclophosphamide | Positive | 264 | – | – | 19 | 28 | 34 | 3 | 5 | 33 | 26 | Positive |
| Hydroxyurea | Positive | 348 | – | – | – | – | – | – | – | – | 10 | Positive |
| Ifosfamide | Positive | 203 | – | – | 124 | 62 | 215 | 3 | 4 | – | – | Positive |
| Sulindac | Positive | 32 | – | – | 21 | 201 | 283 | 78 | 145 | 565 | 128 | Positive |
| Tolbutamide | Positive | 233 | – | – | 43 | 77 | – | 8 | 15 | – | – | Positive |
| Valproic acid | Positive | 540 | – | – | 12 | 17 | 66 | 11 | 16 | 74 | – | Positive |
| Spironolactone | Positive | 0.1 | – | – | – | – | 3,451 | – | – | – | 3,453 | Negative |
| Fenofibrate | Positive | 4.1 | – | 678 | – | – | – | 1,526 | – | – | – | Negative |
| Penicillin g | Positive | 8.1 | – | – | 5,084 | – | – | – | – | 11,762 | – | Negative |
| Allopurinol | Positive | 14 | – | – | – | – | – | – | – | – | – | Negative |
| Phenytoin | Positive | 22 | – | – | – | – | – | – | – | – | – | Negative |
| Captopril | Positive | 8.9 | – | – | – | – | – | – | – | – | – | Negative |
| Chlormezanone | Positive | 11 | 542 | – | – | – | 508 | – | – | – | – | Negative |
| Sulfamethoxazole | Positive | 217 | – | – | – | – | – | 311 | – | – | – | Negative |
| Propylthiouracil | Positive | 9 | – | – | 674 | – | – | 671 | – | – | – | Negative |
| Dacarbazine | Positive | 21 | – | – | – | – | – | – | – | – | – | Negative |
| Felbamate | Positive | 42 | – | – | – | – | – | – | – | – | – | Negative |
| Niacin | Positive | 146 | – | – | – | – | – | – | – | – | – | Negative |
| Stavudine | Positive | 3.5 | – | – | – | – | 575 | – | – | 436 | – | Negative |
| Zidovudine | Positive | 6.1 | – | – | – | – | – | – | – | – | – | Negative |
| Isoniazid | Positive | 77 | – | – | – | – | – | – | – | – | – | Negative |
| Indinavir | Positive | 19 | – | – | – | – | – | – | – | – | – | Negative |
| Phenacetin | Positive | 13 | – | – | 4,003 | – | – | 159 | – | – | – | Negative |
| Vitamin c | Negative | 134 | – | – | 895 | – | – | 568 | – | – | – | Negative |
| Theophylline | Negative | 85 | – | – | – | – | – | – | – | – | – | Negative |
| Aspirin | Negative | 6 | – | – | 808 | 2,106 | 3,748 | 330 | 1,121 | 1,800 | 1,617 | Negative |
| Citric acid | Negative | NA | – | – | – | – | – | – | – | – | – | Negative |
The bold/italicized numbers indicate a positive test defined by a harmless ratio of <100. For further details see the description in Table 2
The combined use of HCS with the RO2 model
The new testing strategy was applied to a set of 70 drugs (human hepatotoxicity positives/negatives = 49/21). As shown in Table 4 and Supplemental Table 1, the integrated model (the RO2 model and the HCS assay) increased the sensitivity by 16 % as compared to the HCS model alone (55 vs. 39 %), with a minor sacrifice on specificity from 100–95 %. Importantly, the integrated approach improved the overall accuracy by 10 % and reduced the drugs that would require HCS experimental tests by approximately 20 %, as compared to the findings of the HCS assay alone. In all, the accuracy of the integrated model was 67 % as compared to 57 % for the HCS assay alone, and the integrated model required only 56 HCS tests as compared to 70 tests when the HCS assay data were considered independently.
Table 4.
The predictive performances of the HCS model, the RO2 model, and their combination assessed by a set of 70 drugs with human DILI classification as listed in Tables 2 and 3
| Model | Test result | Human hepatotoxicity
|
Accuracy (%) | Sensitivity (%) | Specificity (%) | # Drugs requiring HCS test | |
|---|---|---|---|---|---|---|---|
| Positive (N = 49) | Negative (N = 21) | ||||||
| RO2-HCS | Positive | 27 | 1 | 67 | 55 | 95 | 56 |
| Negative | 22 | 20 | |||||
| HCS | Positive | 19 | 0 | 57 | 39 | 100 | 70 |
| Negative | 30 | 21 | |||||
| RO2 | Positive | 13 | 1 | 47 | 27 | 95 | N/A |
| Negative | 36 | 20 | |||||
The HCS model was derived from 9 selected cellular parameters measured in primary rat hepatocytes. Of the 70 drugs, 14 were predicted positive by the RO2 model, so only the remaining 56 drugs needed in vitro testing in the RO2-HCS-integrated testing strategy
Inflammation-associated drug hepatotoxicity
The published data of Cosgrove et al. (2009) were used to further evaluate the developed testing strategy. As indicated in Table 5 and Supplemental Table 2, the RO2-cytokine-integrated model increased sensitivity by 15 % and sacrificed 6 % of specificity as compared to the drug-cytokine in vitro assay alone. Notably, the integration of the RO2 model with the drug-cytokine assay increased prediction accuracy by 7 % when compared to the original published data of Cosgrove et al. (2009) (i.e., 62 vs. 55 %). Meanwhile, the integrated testing strategy required approximately 20 % less experimental testing as compared to the drug-cytokine in vitro assay alone (i.e., 71 vs. 87) with a negligible additional cost to calculate a drug’s lipophilicity. Consequently, an integrated testing strategy that involves the RO2 model is superior to predictions based on in vitro assays alone.
Table 5.
The predictive performances of the drug-cytokine in vitro model, the RO2 model, and their combination assessed by a set of 87 drugs as detailed in the supplemental Table 2
| Model | Test result | Human hepatotoxicity
|
Accuracy (%) | Sensitivity (%) | Specificity (%) | # Drugs requiring cytokines test | |
|---|---|---|---|---|---|---|---|
| Positive (N = 52) | Negative (N = 35) | ||||||
| RO2-cytokines | Positive | 22 | 3 | 62 | 42 | 91 | 71 |
| Negative | 30 | 32 | |||||
| Cytokines | Positive | 14 | 1 | 55 | 27 | 97 | 87 |
| Negative | 38 | 34 | |||||
| RO2 | Positive | 14 | 2 | 53 | 27 | 94 | N/A |
| Negative | 38 | 33 | |||||
The in vitro model published by Cosgrove et al. (2009) measured the drug-cytokine synergistic effects in primary human hepatocytes. Of the 87 drugs tested, 16 were predicted positive by the RO2 model, so only the remaining 71 drugs needed in vitro testing in the RO2-cytokines-integrated testing strategy
Discussion
Accurate prediction of adverse drug reactions at a reasonable cost is critical in preclinical safety testing (Schnackenberg et al. 2009; Will and Schroeter 2012). Thus, in vitro and in silico tests are expected to play a major role in twenty-first century toxicity testing (Andersen and Krewski 2009; Chen et al. 2012). Because animal studies are costly and frequently fail in predicting clinically relevant toxicities, the US FDA, as well as other regulatory authorities, have emphasized the importance of in vitro and in silico models to reduce unnecessary animal testing in an effort toward efficient replacement, reduction, and refinement of animal tests in regulatory science (Hamburg 2011). In vitro cytotoxicity assays are poorly predictive of human hepatotoxicity (Xu et al. 2008). Consequently, monitoring multiple and mechanistically relevant endpoints in HCS assays improves predictive performance (Khetani et al. 2013). Unfortunately, the use of human hepatocyte cell cultures to screen multiple endpoints for prolonged periods of time proved to be difficult (i.e., limited viability of cryopreserved human hepatocytes and the cost of pluripotent stem cell derived liver cells) (Khetani et al. 2013).
In the present study, an improved testing strategy was developed by combining the RO2 model with experimental data derived from primary rat hepatocytes HCS assays. Specifically, when the HCS assays were performed with only the negatives predicted by the RO2 model alone, drug safety prediction was significantly improved. The new testing strategy can also be applied to other in vitro assays as demonstrated by the published drug-cytokine data (Cosgrove et al. 2009). The testing strategy developed in this study is superior to that of the HCS assay alone, with improved prediction power at reduced cost. Specifically, the accuracy increased by approximately 10 %, and the number of drugs requiring experimental tests was reduced by approximately 20 % at a negligible additional cost to calculate a drug’s lipophilicity, as compared to the HCS assay alone. An improvement has been achieved by integrating the RO2 model, and data on cytokine induced hepatotoxicity.
HCS assays are a promising testing strategy for screening multiple toxicity endpoints in the drug discovery phase; however, the low sensitivity associated with HCS raises concern about selecting false negatives for future testing. Some technologies have been employed to improve the sensitivity of the assay. For instance, Khetani et al. (2013) employed a long-term drug dosing strategy based on a functionally stable model of primary human hepatocytes, which improved sensitivity but increased costs due to additional testing and decreased throughput. An important advantage of the new testing strategy proposed in this study is its improvement of predictive performance at a reduced screening cost.
Although in silico models provide a rapid return of results and do not require chemical substances (Muster et al. 2008), these models alone are insufficient for a reliable prediction of clinically relevant human hepatotoxicity. Liu et al. identified 13 side effects that collectively provided an indication for DILI and that were further translated via an in silico approach to develop a DILI prediction system (Liu et al. 2011). Recently, we developed a quantitative structure–activity relationship model with a Decision Forest classifier using the Mold2 chemical descriptors and reported prediction accuracies of 62–68 % as assessed by three independent validation datasets (Chen et al. 2013b).
Bioinformatics approaches to integrate heterogeneous data have significantly impacted views on how to handle complex biological problems (Shi et al. 2010; Iskar et al. 2011). Obviously, a single model derived from in silico or in vitro testing alone is insufficient for the prediction of a complicated endpoint like DILI; meanwhile, an appropriate integration can improve the predictive performance, mostly because models based on different systems capture a greater diversity of information (Chen et al. 2014) (Rusyn et al. 2012). For example, only 6 of 27 (22 %) positives predicted by the RO2 or HCS assay were common in this study, suggesting that these two models are complementary. Similar observations were found when the RO2 models were integrated with the cytokines assay, and DILI positive drugs that can cause hypersensitivity reactions, including fenofibrate, mebendazole, verapamil, and indinavir were predicted by the RO2 model, but not by the HCS assay. On the other hand, the HCS assay successfully distinguished drugs that caused lesions in liver, such as cyclophosphamide, ifosfamide, and carboplatin, which are not detected by the use of the RO2 model.
Recently, the integration of an in silico model and in vitro assays was reported (Zhu et al. 2013) utilizing a hybrid approach to combine the in vitro assays and chemical descriptors. However, the hybrid model did not significantly improve the prediction as compared to the in vitro assay alone. Specifically, the correct classification rate of the in vitro assay alone was 77 % while those of the hybrid approaches ranged from 68 to 73 % (Zhu et al. 2013). Similar observations were reported by Low et al. (Low et al. 2011), who found that the correct classification rate of the models based on toxicogenomic descriptors alone was 76 %, while those of the hybrid models combining chemical and toxicogenomic descriptors were in the range of 68–77 %. A drawback from the aforementioned hybrid approach might exist in directly pooling heterogeneous data sources for modeling purposes, as different data sources have different data structures that often require different modeling strategies to maximize the information. Thus, adaptors would need to be developed for data integration without infringing on data integrity (Chen et al. 2014).
The performance of HCS assays could be further improved by incorporating other liver relevant endpoints, such as reactive oxygen species, glutathione depletion, and inhibition of bile salt export pumps (Stepan et al. 2011; Thompson et al. 2012). These mechanistic endpoints are expected to supplement the prelethal endpoints employed in this study. Notably, drug-cytokine hepatotoxicity synergies were observed when drug-cytokine mixes were administrated to primary human hepatocytes (Cosgrove et al. 2009). Consequently, a cytokine-based in vitro model was developed with promising performance to predict inflammation-associated hepatotoxicity using a large set of drugs. In this study, we have demonstrated the successful integration of such data into the RO2 model to improve DILI prediction.
The outcome of the cellular endpoints in the HCS assay was demonstrated to significantly correlate with the risk for human DILI, especially when Cmax was taken into account. This concept has been widely accepted as a standard practice for in vitro assays used for clinical DILI prediction (Dykens et al. 2008; Xu et al. 2008; Khetani et al. 2013). While a drug’s Cmax is commonly determined in human safety and efficacy studies, such information is not available at the preclinical developmental stage; nonetheless, it might be predicted as reported elsewhere (Poulin et al. 2011). For example, a physiologically based pharmacokinetic modeling approach was demonstrated to predict Cmax using in silico and in vitro data with reasonable accuracy (67 % of drugs fall in an average-fold error of < twofold) (Jones et al. 2006).
Several caveats need to be considered in this study. First, only marketed drugs, which have acceptable safety margins and have received marketing approval, were investigated. Second, a threshold of 100 for the harmless ratio (i.e., EC50/Cmax) was set to detect positives in the HCS assay. Although this threshold has been widely applied in the industry (Dykens et al. 2008; Khetani et al. 2013) with a reasonable clinical rationale (Xu et al. 2008), it is an exaggerated concentration, which may suggest that rat hepatocyte cell culture is not sensitive enough to predict human DILI at clinically relevant doses. Furthermore, the Cmax data used in the present study were retrieved from human studies, while the HCS assays were designed for preclinical study where the Cmax data for the drug candidates are unknown. A recent publication (Jones et al. 2006) indicated that the Cmax may be predicted based on preclinical data with reasonable accuracy; however, the results from a recent study initialized by Pharmaceutical Research and Manufacturers of America (PhRMA) indicated that the pharmacokinetic models still suffer from a general underestimation of drug exposure (Poulin et al. 2011). Therefore, the utility of the predicted Cmax for the in vitro assay-based models requires further evaluation.
In conclusion, an improved testing strategy was developed to demonstrate that the in vitro assays combined with the RO2 model provided a means with a reasonable performance to predict a drug’s potential to cause liver injury in humans. The integrated method represents a modest improvement with about a 10 % increase in accuracy, and its further assessment in a larger pool of approved drugs is warranted. Once validated, the proposed testing strategy will be useful to prioritize drug candidates in the early drug discovery phase to reduce unnecessary animal testing.
Supplementary Material
Acknowledgments
Jürgen Borlak receives funding from the German Federal Ministry for Education and Research as part of the Virtual Liver Network initiative (Grant No. 031 6154). Jürgen Borlak also gratefully acknowledges a stipend from the US FDA Oak Ridge Institute for Science and Education (ORISE). We thank Robin Stingley, Donna Mendrick, Frederick Beland, Jie Zhang, and Yuping Wang for their comments and English editing.
Footnotes
Disclaimer: The views presented in this article do not necessarily reflect current or future opinion or policy of the US Food and Drug Administration. Any mention of commercial products is for clarification and not intended as endorsement.
Electronic supplementary material The online version of this article (doi:10.1007/s00204-014-1276-9) contains supplementary material, which is available to authorized users.
Contributor Information
Minjun Chen, Division of Bioinformatics and Biostatistics, National Center for Toxicological Research, US Food and Drug Administration, Jefferson, AR 72079, USA.
Chun-Wei Tung, Division of Bioinformatics and Biostatistics, National Center for Toxicological Research, US Food and Drug Administration, Jefferson, AR 72079, USA; School of Pharmacy, Kaohsiung Medical University, Kaohsiung, Taiwan.
Qiang Shi, Division of Systems Biology, National Center for Toxicological Research, US Food and Drug Administration, Jefferson, AR 72079, USA.
Lei Guo, Division of Biochemical Toxicology, National Center for Toxicological Research, US Food and Drug Administration, Jefferson, AR 72079, USA.
Leming Shi, School of Pharmacy, Fudan University, Shanghai, China.
Hong Fang, Office of Scientific Coordination, National Center for Toxicological Research, US Food and Drug Administration, Jefferson, AR 72079, USA.
Jürgen Borlak, Center of Pharmacology and Toxicology, Hannover Medical School, Hannover, Germany.
Weida Tong, Division of Bioinformatics and Biostatistics, National Center for Toxicological Research, US Food and Drug Administration, Jefferson, AR 72079, USA.
References
- Andersen ME, Krewski D. Toxicity testing in the 21st century: bringing the vision to life. Toxicol Sci. 2009;107:324–330. doi: 10.1093/toxsci/kfn255. [DOI] [PubMed] [Google Scholar]
- Bleicher KH, Bohm HJ, Muller K, Alanine AI. Hit and lead generation: beyond high-throughput screening. Nat Rev Drug Discov. 2003;2:369–378. doi: 10.1038/nrd1086. [DOI] [PubMed] [Google Scholar]
- Chen M, Vijay V, Shi Q, Liu Z, Fang H, Tong W. FDA-approved drug labeling for the study of drug-induced liver injury. Drug Discov Today. 2011;16:697–703. doi: 10.1016/j.drudis.2011.05.007. [DOI] [PubMed] [Google Scholar]
- Chen M, Zhang M, Borlak J, Tong W. A decade of toxicogenomic research and its contribution to toxicological science. Toxicol Sci. 2012;130:217–228. doi: 10.1093/toxsci/kfs223. [DOI] [PubMed] [Google Scholar]
- Chen M, Borlak J, Tong W. High lipophilicity and high daily dose of oral medications are associated with significant risk for drug-induced liver injury. Hepatology. 2013a;58:388–396. doi: 10.1002/hep.26208. [DOI] [PubMed] [Google Scholar]
- Chen M, Hong H, Fang H, Zhou G, Kelly R, Borlak J, Tong W. Quantitative structure-activity relationship models for predicting drug-induced liver injury based on FDA-approved drug labeling annotation and using a large collection of drugs. Toxicol Sci. 2013b;136:242–249. doi: 10.1093/toxsci/kft189. [DOI] [PubMed] [Google Scholar]
- Chen M, Zhang J, Wang Y, Liu Z, Kelly R, Zhou G, Fang H, Borlak J, Tong W. Liver toxicity knowledge base (LTKB)—a systems approach to a complex endpoint. Clin Pharmacol Ther. 2013c;95:409–412. doi: 10.1038/clpt.2013.16. [DOI] [PubMed] [Google Scholar]
- Chen M, Bisgin H, Tong L, Hong H, Fang H, Borlak J, Tong W. Toward predictive models for drug-induced liver injury in humans: are we there yet? Biomark Med. 2014;8:201–213. doi: 10.2217/bmm.13.146. [DOI] [PubMed] [Google Scholar]
- Cosgrove BD, King BM, Hasan MA, Alexopoulos LG, Farazi PA, Hendriks BS, Griffith LG, Sorger PK, Tidor B, Xu JJ, Lauffenburger DA. Synergistic drug-cytokine induction of hepatocellular death as an in vitro approach for the study of inflammation-associated idiosyncratic drug hepatotoxicity. Toxicol Appl Pharmacol. 2009;237:317–330. doi: 10.1016/j.taap.2009.04.002. [DOI] [PMC free article] [PubMed] [Google Scholar]
- Dykens JA, Jamieson JD, Marroquin LD, Nadanaciva S, Xu JJ, Dunn MC, Smith AR, Will Y. In vitro assessment of mitochondrial dysfunction and cytotoxicity of nefazodone, trazodone, and buspirone. Toxicol Sci. 2008;103:335–345. doi: 10.1093/toxsci/kfn056. [DOI] [PubMed] [Google Scholar]
- Ekins S, Williams AJ, Xu JJ. A predictive ligand-based bayesian model for human drug induced liver injury. Drug Metab Dispos. 2010;38:2302–2308. doi: 10.1124/dmd.110.035113. [DOI] [PubMed] [Google Scholar]
- Gomez-Lechon MJ, Lahoz A, Gombau L, Castell JV, Donato MT. In vitro evaluation of potential hepatotoxicity induced by drugs. Curr Pharm Des. 2010;16:1963–1977. doi: 10.2174/138161210791208910. [DOI] [PubMed] [Google Scholar]
- Greene N, Fisk L, Naven RT, Note RR, Patel ML, Pelletier DJ. Developing structure-activity relationships for the prediction of hepatotoxicity. Chem Res Toxicol. 2010;23:1215–1222. doi: 10.1021/tx1000865. [DOI] [PubMed] [Google Scholar]
- Hamburg MA. Advancing regulatory science. Science. 2011;331:987. doi: 10.1126/science.1204432. [DOI] [PubMed] [Google Scholar]
- Iskar M, Zeller G, Zhao X-M, van Noort V, Bork P. Drug discovery in the age of systems biology: the rise of computational approaches for data integration. Curr Opin Biotechnol. 2011;23:609–616. doi: 10.1016/j.copbio.2011.11.010. [DOI] [PubMed] [Google Scholar]
- Jones HM, Parrott N, Jorga K, Lave T. A novel strategy for physiologically based predictions of human pharmacokinetics. Clin Pharmacokinet. 2006;45:511–542. doi: 10.2165/00003088-200645050-00006. [DOI] [PubMed] [Google Scholar]
- Kaplowitz N. Idiosyncratic drug hepatotoxicity. Nat Rev Drug Discov. 2005;4:489–499. doi: 10.1038/nrd1750. [DOI] [PubMed] [Google Scholar]
- Kaplowitz N. Avoiding idiosyncratic DILI: two is better than one. Hepatology. 2013;58:15–17. doi: 10.1002/hep.26295. [DOI] [PubMed] [Google Scholar]
- Khetani SR, Kanchagar C, Ukairo O, Krzyzewski S, Moore A, Shi J, Aoyama S, Aleo M, Will Y. The use of micropatterned co-cultures to detect compounds that cause drug induced liver injury in humans. Toxicol Sci. 2013;132:107–117. doi: 10.1093/toxsci/kfs326. [DOI] [PubMed] [Google Scholar]
- Liu Z, Shi Q, Ding D, Kelly R, Fang H, Tong W. Translating clinical findings into knowledge in drug safety evaluation—drug induced liver injury prediction system (DILIps) PLoS Comput Biol. 2011;7:e1002310. doi: 10.1371/journal.pcbi.1002310. [DOI] [PMC free article] [PubMed] [Google Scholar]
- Low Y, Uehara T, Minowa Y, Yamada H, Ohno Y, Urushidani T, Sedykh A, Muratov EN, Kuz’min V, Fourches D, Zhu H, Rusyn I, Tropsha A. Predicting drug-induced hepatotoxicity using QSAR and toxicogenomics approaches. Chem Res Toxicol. 2011;24:1251–1262. doi: 10.1021/tx200148a. [DOI] [PMC free article] [PubMed] [Google Scholar]
- Muster W, Breidenbach A, Fischer H, Kirchner S, Muller L, Pahler A. Computational toxicology in drug development. Drug Discov Today. 2008;13:303–310. doi: 10.1016/j.drudis.2007.12.007. [DOI] [PubMed] [Google Scholar]
- O’Brien PJ, Chan K, Silber PM. Human and animal hepatocytes in vitro with extrapolation in vivo. Chem Biol Interact. 2004;150:97–114. doi: 10.1016/j.cbi.2004.09.003. [DOI] [PubMed] [Google Scholar]
- Olson H, Betton G, Robinson D, Thomas K, Monro A, Kolaja G, Lilly P, Sanders J, Sipes G, Bracken W, Dorato M, Van Deun K, Smith P, Berger B, Heller A. Concordance of the toxicity of pharmaceuticals in humans and in animals. Regul Toxicol Pharmacol. 2000;32:56–67. doi: 10.1006/rtph.2000.1399. [DOI] [PubMed] [Google Scholar]
- Porceddu M, Buron N, Roussel C, Labbe G, Fromenty B, Borgne-Sanchez A. Prediction of liver injury induced by chemicals in human with a multiparametric assay on isolated mouse liver mitochondria. Toxicol Sci. 2012;129:332–345. doi: 10.1093/toxsci/kfs197. [DOI] [PMC free article] [PubMed] [Google Scholar]
- Poulin P, Jones RD, Jones HM, Gibson CR, Rowland M, Chien JY, Ring BJ, Adkison KK, Ku MS, He H, Vuppugalla R, Marathe P, Fischer V, Dutta S, Sinha VK, Bjornsson T, Lave T, Yates JW. PHRMA CPCDC initiative on predictive models of human pharmacokinetics, part 5: prediction of plasma concentration-time profiles in human by using the physiologically-based pharmacokinetic modeling approach. J Pharm Sci. 2011;100:4127–4157. doi: 10.1002/jps.22550. [DOI] [PubMed] [Google Scholar]
- Rusyn I, Sedykh A, Low Y, Guyton KZ, Tropsha A. Predictive modeling of chemical hazard by integrating numerical descriptors of chemical structures and short-term toxicity assay data. Toxicol Sci. 2012;127:1–9. doi: 10.1093/toxsci/kfs095. [DOI] [PMC free article] [PubMed] [Google Scholar]
- Schnackenberg LK, Chen M, Sun J, Holland RD, Dragan Y, Tong W, Welsh W, Beger RD. Evaluations of the transsulfuration pathway in multiple liver toxicity studies. Toxicol Appl Pharmacol. 2009;235:25–32. doi: 10.1016/j.taap.2008.11.015. [DOI] [PubMed] [Google Scholar]
- Shi W, Bessarabova M, Dosymbekov D, Dezso Z, Nikolskaya T, Dudoladova M, Serebryiskaya T, Bugrim A, Guryanov A, Brennan RJ, Shah R, Dopazo J, Chen M, Deng Y, Shi T, Jurman G, Furlanello C, Thomas RS, Corton JC, Tong W, Shi L, Nikolsky Y. Functional analysis of multiple genomic signatures demonstrates that classification algorithms choose phenotype-related genes. Pharmacogen J. 2010;10:310–323. doi: 10.1038/tpj.2010.35. [DOI] [PMC free article] [PubMed] [Google Scholar]
- Stepan AF, Walker DP, Bauman J, Price DA, Baillie TA, Kalgutkar AS, Aleo MD. Structural alert/reactive metabolite concept as applied in medicinal chemistry to mitigate the risk of idiosyncratic drug toxicity: a perspective based on the critical examination of trends in the top 200 drugs marketed in the United States. Chem Res Toxicol. 2011;24:1345–1410. doi: 10.1021/tx200168d. [DOI] [PubMed] [Google Scholar]
- Thomas CE, Will Y. The impact of assay technology as applied to safety assessment in reducing compound attrition in drug discovery. Expert Opin Drug Discov. 2012;7:109–122. doi: 10.1517/17460441.2012.651122. [DOI] [PubMed] [Google Scholar]
- Thompson RA, Isin EM, Li Y, Weidolf L, Page K, Wilson I, Swallow S, Middleton B, Stahl S, Foster AJ. In vitro approach to assess the potential for risk of idiosyncratic adverse reactions caused by candidate drugs. Chem Res Toxicol. 2012;25:1616–1632. doi: 10.1021/tx300091x. [DOI] [PubMed] [Google Scholar]
- Tolosa L, Pinto S, Donato MT, Lahoz A, Castell JV, O’Connor JE, Gomez-Lechon MJ. Development of a multiparametric cell-based protocol to screen and classify the hepatotoxicity potential of drugs. Toxicol Sci. 2012;127:187–198. doi: 10.1093/toxsci/kfs083. [DOI] [PubMed] [Google Scholar]
- Will Y, Schroeter T. Deployment of in silico and in vitro safety assays in early-stage drug discovery. Future Med Chem. 2012;4:1211–1213. doi: 10.4155/fmc.12.71. [DOI] [PubMed] [Google Scholar]
- Xu JJ, Diaz D, O’Brien PJ. Applications of cytotoxicity assays and pre-lethal mechanistic assays for assessment of human hepatotoxicity potential. Chem Biol Interact. 2004;150:115–128. doi: 10.1016/j.cbi.2004.09.011. [DOI] [PubMed] [Google Scholar]
- Xu JJ, Henstock PV, Dunn MC, Smith AR, Chabot JR, de Graaf D. Cellular imaging predictions of clinical drug-induced liver injury. Toxicol Sci. 2008;105:97–105. doi: 10.1093/toxsci/kfn109. [DOI] [PubMed] [Google Scholar]
- Zhu X, Sedykh A, Liu S. Hybrid in silico models for drug-induced liver injury using chemical descriptors and in vitro cell-imaging information. J Appl Toxicol. 2013 doi: 10.1002/jat.2879. [DOI] [PubMed] [Google Scholar]
Associated Data
This section collects any data citations, data availability statements, or supplementary materials included in this article.