

Abstract
It is well-documented that well-being typically evinces precipitous decrements at the end of life. However, research has primarily taken a postdictive approach by knowing the outcome (date of death) and aligning in retrospect how well-being has changed for people with documented death events. In the present study, we made use of a predictive approach by examining whether and how levels of and changes in life satisfaction prospectively predict mortality hazards and delineate the role of contributing factors, including health, perceived control, and social orientation. To do so, we applied shared parameter growth-survival models to 20-year longitudinal data from 10,597 participants (n = 1,560 or 15% deceased; age at baseline: M = 44 years, SD = 17, range: 18–98 years) from the national German Socio-Economic Panel Study (SOEP). Our findings showed that lower levels and steeper declines of life satisfaction each uniquely predicted higher mortality risks. Results also reveal moderating effects of age and perceived control: Life satisfaction levels and changes had stronger predictive effects for mortality hazards among older adults. Perceived control is associated with lower mortality hazards; however, this effect is diminished for those who experience accelerated life satisfaction decline. Variance decomposition suggests that predictive effects of life satisfaction trajectories were partially unique (3–6%) and partially shared with physical health, perceived control, and social orientation (17–19 %). Our discussion focuses on the strengths and challenges of a predictive approach to link developmental changes (in life satisfaction) to mortality hazards and considers implications of our findings for healthy aging.
Keywords: mortality, life satisfaction, perceived control, longitudinal, German Socio-Economic Panel Study (SOEP)
Research on well-being in late life has drawn a picture of steep deteriorations in the last years of life, a phenomenon known as “terminal decline” (Berg, Hassing, Thorvaldsson, & Johansson, 2011; Carmel et al., 2013; Diehr et al., 2002; Hülür et al., 2015; Mroczek & Spiro, 2005; Palgi et al., 2010; Vogel et al., 2013, 2015; Schilling et al., 2013; for overview, see Hülür, Ram, & Gerstorf, 2016). These studies generally take a descriptive postdictive approach to studying late-life well-being by knowing the outcome (date of death) and aligning in retrospect how well-being has changed for people with documented death events. However, this does not necessarily mean that decline in well-being is predictive of increased mortality hazards and would distinguish people with high vs. low risks of dying. For example, there may be individuals who experienced comparably steep declines in well-being but stay alive.
In the present study, we study associations between well-being and mortality from a predictive perspective by examining whether and how levels of and changes in well-being prospectively predict mortality hazards in a large national sample and delineate the role of known correlates of mortality and well-being as factors contributing to the phenomenon. According to previous research, two different components of well-being can be differentiated (Diener, 1984): The cognitive–evaluative component refers to general evaluations of perceived quality of life, while the affective component reflects the experience of positive and negative affect. In the present study, we focused on life satisfaction, which relates to the cognitive-evaluative component. In contrast to the postdictive approach, where late-life change in life satisfaction is examined in individuals who have died (non-survivors), the predictive approach entails the estimation of mortality risks by studying all individuals, including survivors and non-survivors. To do so, we use 20-year annual longitudinal data obtained between 1995 and 2014 from a subsample of 10,597 participants (n = 1,560 deceased; 15%; age at baseline: M = 44 years, SD = 17, range: 18 – 98 years) from the nation-wide German Socio-Economic Panel Study (SOEP). Specifically, we examine (a) the predictive effects of levels of and changes in life satisfaction for all-cause mortality over a time span of 20 years, and (b) quantify the role that physical health, perceived control, and social orientation factors play for the mortality prediction effects of life satisfaction.
Well-being and Mortality
Well-being can be considered a summary measure of how well an individual perceives himself or herself doing in their lives. Well-being is known to be relatively stable throughout adulthood and old age (Charles, Reynolds, & Gatz, 2001; Kunzmann, Little, & Smith, 2000; Mroczek & Kolarz, 1998), but exhibits steep deteriorations in close proximity of death (for overviews, see Gerstorf & Ram, 2013, 2015). A number of previous studies point to lower levels of well-being as an important predictor of mortality hazards (Blazer & Hybels, 2004; Collins, Glei, & Goldman, 2009; Kimm et al., 2012; Kotter-Gruehn, Kleinspehn-Ammerlahn, Gerstorf, & Smith, 2009; Liu, Floud, Pirie, Green, Peto, & Beral, 2016; Maier & Smith, 1999; Niklasson et al., 2015; Xu & Roberts, 2010; for overviews, see Chida & Steptoe, 2008; Diener & Chan, 2011). These studies typically show that individuals who report higher levels of well-being, operationally defined as life satisfaction (Collins et al., 2009; Guven & Saloumidis, 2013; Kimm et al., 2012), morale (Niklasson et al., 2015), satisfaction with aging (Kotter-Gruehn et al., 2009; Maier & Smith, 1999), or positive affect (Blazer & Hybels, 2004; Xu & Roberts, 2010), are less likely to die during follow-up. However, relatively less is known about whether longitudinal declines in well-being are associated with mortality. For example, Boehm, Winning, Segerstrom, and Kubzansky (2015) reported that greater variability in life satisfaction over time is associated with a higher risk of mortality over a time span of nine years, especially when life satisfaction was low. Also, Zaninotto, Wardle, and Steptoe (2016) showed that participants who reported high well-being on more longitudinal occasions were less likely to die over a seven-year period than participants who reported high well-being on no or fewer occasions. It is less clear whether changes in life satisfaction are predictive of mortality.
Although previous research has shown that well-being declines with approaching death among by-now deceased individuals, it remains an open question whether declines in well-being are indicative of and can prospectively predict mortality hazards. We expected life satisfaction change to predict mortality hazards and examined its role in combination with other psychosocial characteristics to identify resilience factors for healthy aging.
The Role of Physical Health, Perceived Control, and Social Orientation
Well-being can be considered a self-assessment of how an individual is doing in multiple domains of functioning, including physical health, finances, and social relationships. Poor physical health is not only the typical cause of death, it often accompanied by reduced mobility, and a disengagement from valued activities prior to death, thereby contributing to diminishing well-being (Lyubomirsky & Layous, 2013). Poor health may be a “common cause” of declining well-being and mortality. Thus, eventual predictive effects of well-being for mortality hazards may be partially associated with individual differences in physical health. Higher socio-economic status is associated with both higher levels of well-being and lower risks of mortality (Anstey, Luszcz, Giles, & Andrew, 2001; Blanchflower & Oswald, 2004). Therefore, socio-economic status may also work as a “common cause” in associations between well-being and mortality. Also, having an active orientation towards social contacts may help individuals to maintain high levels of well-being by being socially active. Social orientation is associated both with late-life well-being (Gerstorf et al., 2016; Windsor, Gerstorf, & Luszcz, 2015) and reduced mortality risks (Antonucci, 2001; House, Landis, & Umberson, 1988). For example, Barger (2013) reported that social integration predicted lower risk for all-cause mortality over five years in a representative US sample. Thus, individual differences in social orientation may also in part explain why well-being predicts mortality hazards.
There are also important resilience factors that may protect individuals from the negative effects of declining well-being on mortality risks. For example, general perceptions of having control over life outcomes (perceived control) helps individuals deal with difficult life circumstances (Baltes, 1997; Heckhausen & Schulz, 1995; Krause & Stryker, 1984). Specifically, individuals with high perceived control (a) may be better equipped to overcome obstacles, for example, through mobilizing emotional and instrumental support, and (b) may be better able to use limited resources in challenging situations than individuals with low perceived control (Heckhausen, Wrosch, & Schulz, 2013). It is thus conceivable that perceived control may play a moderating role in the association between well-being change and mortality. Furthermore, being able to generate social support may also buffer potential associations between well-being change and mortality. Individuals with an active orientation toward social contacts may be able to draw on social resources to overcome obstacles. Thus, social orientation may have a moderating effect on associations between well-being change and mortality.
Advanced age may work as a risk factor in associations between well-being and mortality. According to the model of Strength and Vulnerability Integration (SAVI; Charles, 2010), older adults are more vulnerable to negative affect once it occurs, although they are better at avoiding negative affect in the first place. Therefore, it may be expected that associations of well-being level and change with mortality hazards would be stronger among older adults.
The Present Study
In the present study, we examined whether individual differences in level of and change in life satisfaction predict mortality hazards and targeted the role of socio-economic status (as indicated by education and income), physical health, and social orientation as “common causes” of well-being level/change and mortality. We also controlled for other socio-demographic characteristics related to well-being and mortality (gender, marital status, religious activity, see Anstey et al., 2001; Gebauer, Sedikides, & Neberich, 2012; Haring-Hidore, Stock, Okun, & Witter, 1985; Hu & Goldman, 1990; McCullough, Hoyt, Larson, Koenig, & Thoresen, 2000; Wurm, Tomasik, & Tesch-Roemer, 2008). We examined the role of age, perceived control over one’s life, and social participation as moderators of associations between well-being and mortality. Specifically, we expected that associations between life satisfaction and mortality hazards would be stronger in old age, a phase in life when people often have fewer resources available to recover from low levels of life satisfaction (Baltes, Lindenberger, & Staudinger, 2006; Charles, 2010; Charles & Luong, 2013). Also, we expected that those with higher levels of general perceived control and social orientation would be less likely to die even in the face of declining life satisfaction (Gerstorf et al., 2014). We used 20 years of longitudinal data from the SOEP to empirically test these hypotheses.
Method
To examine associations between levels of and longitudinal changes in life satisfaction and mortality hazards, we used data obtained annually over 20 years from 1995 to 2014 in the German Socio-Economic Panel Study (SOEP). Detailed descriptions of participants, variables, and procedures can be found in previous publications (Headey, Muffels, & Wagner, 2010; Hülür, Ram, & Gerstorf, 2015; Wagner, Frick, & Schupp, 2007). Select details relevant to the present study are given below.
Participants and Procedure
The SOEP is an ongoing longitudinal multi-cohort study that started in West Germany with a representative sample of households in 1984. Data are collected annually. Some measures were given to participants at every wave (e.g., life satisfaction), whereas others were given in select years (e.g., perceived control). We chose the year 1995 as the first wave included in the present study because this was the first wave in which data for all study variables were available, including perceived control and social orientation. We used up to 20 waves of longitudinal data from 1995 to 2014. Our analyses included data from all adult participants (i.e., 18 years old or older) from the 1995 assessment who had provided (a) information on life satisfaction, and (b) information on other study variables. This subsample included 10,597 participants (52% women) who were on average 44.4 years old at baseline (SD = 16.75, range: 18–98). Compared to participants at least 18 years old at the 1995 assessment who were excluded from our analyses due to missing data on some of the correlates, the participants in our sample were older (Cohen’s d = 0.26), more educated (d = 0.73), less religiously active (d = −0.30), had a higher household income (d = 0.10), had higher rates of disability (d = 0.11), had more hospital visits (d = 0.10), reported higher levels of control over their lives (d = 0.27), and had higher levels of social participation (d = 0.24). Differences in life satisfaction, gender distribution, marital/partner status, frequency of physician visits, and in social and family goals were not reliably different from 0 at p < .01.
Measures
Mortality
Mortality status and an individual’s year of death were obtained either (a) by interviews at the yearly assessments (i.e., from household members or neighbors) or (b) from city registries. We used the mortality update obtained in 2015. In total, 1,560 (15%) of the 10,597 participants from the 1995 assessment were deceased by 2015. These individuals died on average 9.1 years after (1995) baseline (SD = 5.00, range: 1–19). The average age at death was 74.6 years (SD = 13.34, range: 24–102).
Well-being: Life satisfaction
Level of and changes in well-being were derived from repeated assessments of life satisfaction indexed each year by individuals’ response to the question, “How satisfied are you with your life, all things considered?” (“Wie zufrieden sind Sie gegenwärtig, alles in allem, mit ihrem Leben?”) on a 0 (totally unsatisfied) to 10 (totally satisfied) scale. Further details of the life satisfaction item as used in the SOEP and its measurement properties can be found in Fujita and Diener (2005); Lucas (2007); and Schilling (2005).
Socio-demographic characteristics
Chronological age was calculated as the number of years since an individual’s birth. Gender was indicated by a binary variable (0 = men; 1 = women). Education was measured as the number of years spent in formal education. Religious activity was measured in 1995 as the frequency, from 1 (never) to 5 (daily), of attending religious events. Marital or partnership status was indicated by a binary variable (0 = separated, single, divorced, or widowed and not living with a partner; 1 = married or living with a partner). Household income was measured as the post-government income of the household the individual belonged to in 1995.
Health
To capture individual differences in physical health, we made use of the last available observation for a set of three physical health variables. We consider this approach a conservative test of the role of psychosocial characteristics because health constraints can be expected to increase late in life (Fauth et al., 2014) and so presumably contribute relatively more to between-person differences in life satisfaction than earlier health assessments. First, disability was assessed at each wave with a single item asking participants whether they had been officially certified as having a reduced capacity to work or being severely handicapped (for details, see Lucas, 2007). Thus, disability indicators were based on self-reports, but referred to official certifications. The binary variable distinguishes participants who had been disabled at their last wave (= 1) and those who were not (= 0). Second, hospital stay last year was indexed by responses to the question “Were you ever admitted to a hospital for at least one night in year X (e.g., 2002)?” The binary variable distinguishes participants who had been admitted to a hospital one or more times over the past year (= 1) with those who were not (= 0). Third, the frequency of physician visits was assessed with the question “Have you gone to a physician within the last three months? If yes, please state how often”. Responses were coded into five categories (0 = no physician visits; 1 = 1 to 4 visits, 2 = 5 to 9 visits, 3 = 10 to 14 visits, 4 = 15 to 19 visits, 5 = 20 or more visits). We acknowledge that visiting a physician also indicates health behavior and proper disease management (Wolinski et al., 2010). At the end of life, however, the frequency of physician visits is associated with increased mortality hazards (Onawola & Laveist, 1998; Ben-Ezra & Shmotkin, 2010).
Descriptive analyses revealed that 18% of participants (n = 1,950) reported being certified as having a disability, 16% (n = 1,705) reported having stayed at the hospital at least for one night in the last year. On average, participants reported having visited a physician between 1 and 4 times in the last three months (M = 1.06; SD = 0.96).
Perceived control
Perceived personal control was assessed in 1995 with three items “I determine most of what happens to me in life”, “My life is determined by my own behavior”, and “Most plans I make are successful” on a scale from 1 (completely disagree) to 4 (completely agree; see Gerstorf, Heckhausen et al., 2014). Item wording closely resembles established measures of personal mastery, as included in the Americans’ Changing Lives Study (ACL; House et al., 1990) and the Midlife in the United States Survey (MIDUS; Lachman & Weaver, 1998). Reliability of the three-item scale was satisfactory (Cronbach’s alpha = .68) and comparable to other reports (Lachman & Weaver, 1998, in the MIDUS: Cronbach’s alpha = .70 with four items; Infurna, Gerstorf, & Zarit, 2011, in the ACL: Cronbach’s alpha = .66 with six items).
Social orientation
Social orientation was indexed using an operational definition based on three variables (Gerstorf et al., 2016). Social goals were indicated by a composite score consisting of individuals’ ratings on a 1 (unimportant) to 4 (very important) scale of the importance of political/social participation and the importance of being there for others. Family goals were measured, also on a 1 (unimportant) to 4 (very important) scale, as the importance of marriage/partnership and the importance of children. Social participation was a composite score indicating the frequency of engagement in four activities: visiting cultural functions (e.g., concerts, theaters, lectures), active sport participation, honorary activities in clubs, organizations or social service, and participation in citizen initiatives, parties, community politics, each rated on a scale from 1 (never) to 4 (each week). Social and family goals were assessed in 1995. Level of social participation was obtained from 5,280 participants (50% of analysis sample) in 1995 and from 5,317 participants in 1994.
Data Analysis
We used a shared parameter growth-survival model (Chui et al., 2015; Ghisletta, 2008; Ghisletta, McArdle, & Lindenberger, 2006; Infurna et al., 2013; Infurna & Okun, 2015; Muniz-Terrera, Piccinin, Johansson, Matthews, & Hofer, 2011; Sabia et al., 2014; Sargent-Cox, Anstey, & Luscz, 2014) to examine links between trajectories of life satisfaction and mortality. A graphical illustration of the model can be found in Figure 1. This model is a combination of a growth curve model that estimates individual differences in life satisfaction at baseline and individual differences in linear and quadratic changes in life satisfaction along with a survival model where the individual differences in growth are treated as predictors of the mortality hazards (see Muthen, Asparouhov, Boye, Hackshaw, & Naegeli, 2009). Because linear and quadratic changes in life satisfaction were negatively correlated, the linear and quadratic slopes were defined as orthogonal factors by residualizing the quadratic slope component for the linear slope component (see Ghisletta et al., 2006). The growth model was specified as
| (1) |
where xit is person i’s life satisfaction at time t that follows a linear and quadratic growth model where x0i, xsi, and xsqi are individual-specific parameters representing level of life satisfaction at baseline, rate of linear change in life satisfaction per year, and rate quadratic change in life satisfaction per year, respectively. Individual-specific intercepts and slopes were modeled as
| (2) |
| (3) |
| (4) |
where μx0, μx1, and μx2 represent sample averages of baseline life satisfaction, rate of linear change, and rate of quadratic change, respectively, and r0i, r1i, and r2i represent individual deviations from these averages.
Figure 1.
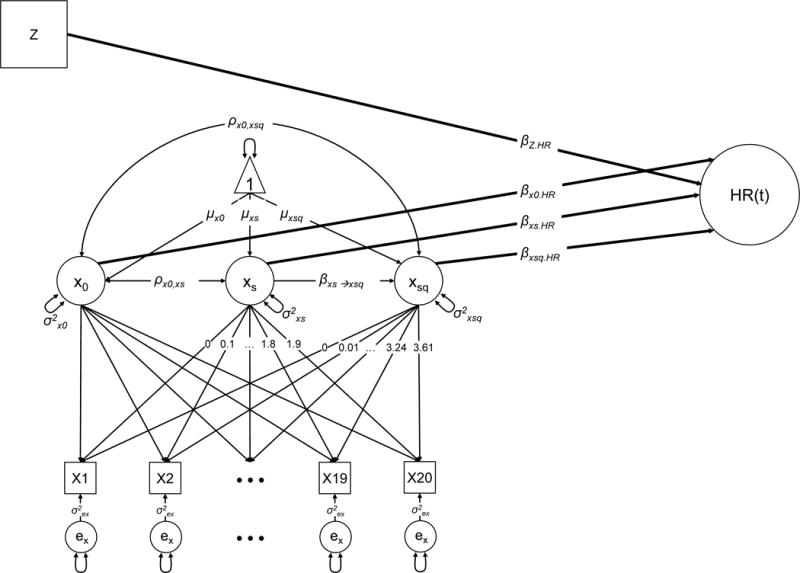
Graphical illustration of the statistical model used.
The survival model was specified as
| (5) |
where hi(t) is the hazard of individual i’s risk of dying at time t, h0(t) is the unrestricted non-parametric function when all covariates take the value 0; β1, β2, and β3 represent the effects of intercepts, linear, and quadratic slopes of life satisfaction, respectively; β4 to β9 represent the effects of socio-demographic variables; and β10, β11, and β12 represent the age-moderation of the effects of life satisfaction level, linear slope, and quadratic slopes, respectively, on the mortality hazard.
In Model 2, health variables (disability, hospital stays, and physician visits) were added as additional predictors of mortality. Model 3 included predictive effects of perceived control, as well as interactions between perceived control and levels and linear and quadratic slopes of life satisfaction, respectively. In Model 4, variables indicating social orientation (social goals, family goals, and social participation) were added as predictors of mortality. Furthermore, we modeled an interaction between social participation and levels and linear and quadratic slopes of life satisfaction, respectively.1
One of our aims was to quantify the extent to which the predictive effects of life satisfaction level and rates of change (linear and quadratic) were shared with and/or unique from relevant individual difference factors. To do so, we calculated the percentage of explained variance in each model in two steps. First, the probability of mortality was calculated for each individual based on model parameters and his or her values on observed variables (e.g., baseline age) and factor scores (e.g., level of life satisfaction, outputted with the MPlus software). Second, this estimated probability ranging from 0 to 1 was used to predict the actual mortality status in a logistic regression. Following procedures suggested by Nagelkerke (1991), the pseudo R-squared from this logistic regression was interpreted as percentage of explained variance. For each model (Model 1 to Model 4), we obtained total explained variance and explained variance without life satisfaction trajectory variables. Based on these two pseudo R-squared estimates, we calculated four components of explained variance: (1) unique explained variance by additional correlates in each model (calculated as the difference between the estimates of explained total variance in subsequent models; e.g., Model 1 vs. Model 2); (2) unique explained variance by all correlates (calculated as the sum of unique explained variances by additional correlates), (3) unique explained variance by life satisfaction trajectory (calculated as the difference between explained total variance and explained variance without life satisfaction trajectory) and, (4) shared explained variance (life satisfaction trajectory and correlates; calculated as the difference between explained total variance and the sum of unique explained variance by all correlates and unique explained variance by life satisfaction trajectory only).
Life satisfaction was scaled in the original 0 to 10 metric. All other correlates were z-standardized to facilitate interpretation. All models were fit using Mplus (Muthén & Muthén, 1998–2012), and maximum likelihood estimation with robust standard errors and missing data treated as missing at random. Given the relatively large sample size, statistical significance was evaluated at p < .01. Descriptive statistics and intercorrelations for study variables are given in Table 1.
Table 1.
Descriptive statistics and intercorrelations for study measures
| M | SD | (1) | (2) | (3) | (4) | (5) | (6) | (7) | (8) | (9) | (10) | (11) | (12) | (13) | (14) | (15) | |
|---|---|---|---|---|---|---|---|---|---|---|---|---|---|---|---|---|---|
| (1) Life satisfaction 1995 (0 – 10) | 6.88 | 1.80 | 1 | ||||||||||||||
| (2) Age 1995 (18 – 98) | 44.38 | 16.75 | −0.05* | 1 | |||||||||||||
| (3) Gender (0 = men; 1 = women) | 0.52 | 0.50 | −0.02 | 0.05* | 1 | ||||||||||||
| (4) Education (7 – 18 years) | 12.10 | 2.52 | 0.06* | −0.23* | −0.12* | 1 | |||||||||||
| (5) Religious activity (1 – 4) | 1.73 | 0.98 | 0.13* | 0.15* | 0.08* | −0.05* | 1 | ||||||||||
| (6) Spouse/partner (0 = no; 1 = yes) | 0.73 | 0.45 | 0.05* | 0.11* | −0.06* | −0.01 | 0.02 | 1 | |||||||||
| (7) Household income (z-score) | 0.00 | 1.00 | 0.14* | 0.15* | −0.08* | 0.27* | 0.07* | 0.17* | 1 | ||||||||
| (8) Disability (0, 1) | 0.18 | 0.39 | −0.12* | 0.27* | −0.03* | −0.11* | 0.02 | 0.04* | −0.04* | 1 | |||||||
| (9) Physician visits (0 – 5) | 1.06 | 0.96 | −0.12* | 0.27* | 0.08* | −0.08* | 0.06* | 0.01 | −0.06* | 0.31* | 1 | ||||||
| (10) Hospital visit (0, 1) | 0.16 | 0.37 | −0.07* | 0.22* | 0.01 | −0.08* | 0.03* | 0.01 | −0.06* | 0.23* | 0.31* | 1 | |||||
| (11) Perceived control (1 – 4) | 2.80 | 0.47 | 0.26* | −0.16* | −0.12* | 0.32* | −0.06* | 0.06* | 0.21* | −0.11* | −0.09* | −0.08* | 1 | ||||
| (12) Social goals (1 – 4) | 2.51 | 0.50 | 0.11* | −0.12* | 0.03* | 0.18* | 0.09* | 0.01 | 0.09* | −0.05* | −0.04* | −0.02 | 0.15* | 1 | |||
| (13) Family goals (1 – 4) | 3.42 | 0.67 | 0.11* | −0.05* | 0.04* | 0.03* | 0.07* | 0.46* | 0.10* | −0.03* | −0.03* | −0.02 | 0.06* | 0.23* | 1 | ||
| (14) Social participation (1–4) | 1.50 | 0.53 | 0.15* | −0.18* | −0.09* | 0.22* | 0.10* | −0.09* | 0.17* | −0.07* | −0.05* | −0.05* | 0.20* | 0.20* | −0.02 | 1 | |
| (15) Mortality (0 = no; 1 = yes) | 0.15 | 0.35 | −0.08* | 0.52* | −0.02 | −0.16* | 0.05* | −0.07* | −0.16* | 0.23* | 0.29* | 0.23* | −0.15* | −0.12* | −0.12* | −0.14* | 1 |
Note. n = 10,597 (deceased: n = 1,560). M = mean; SD = standard deviation.
p < .01.
Results
Findings from the shared parameter growth curve model examining level and change in life satisfaction and correlates as predictors of mortality hazards are presented in Table 2 (unstandardized parameter estimates) and Table 3 (hazard ratios). As can be observed from Table 2, at the beginning of our study, the average rating for life satisfaction was μx0 = 6.923 scale points (Model 1) on a scale from 0 to 10. On average, life satisfaction declined slightly across the period of observation by about 0.6 of a point per decade (Model 1: μxs = −0.597). The decline in life satisfaction was decelerated. That is, the decline was steeper at the beginning of the time series and leveled off toward the end of the time series (Model 1: μxsq = 0.209).2 Importantly, reliable individual differences were found for each model parameter of interest, including the intercept (Model 1: s2x0 = 1.929) and the rates of linear change (Model 1: s2xs = 3.941) and quadratic change (Model 1: s2xsq = 0.151).
Table 2.
Shared Parameter Growth and Survival Models: Level and Change in Life Satisfaction and Correlates as Predictors of Mortality
| Model 1 |
Model 2 |
Model 3 |
Model 4 |
|||||
|---|---|---|---|---|---|---|---|---|
| Est. | SE | Est. | SE | Est. | SE | Est. | SE | |
| Growth Model | ||||||||
| Fixed effects | ||||||||
| Itc. (x0) | 6.923* | 0.016 | 6.924* | 0.016 | 6.924* | 0.016 | 6.924* | 0.016 |
| Time (xs) | −0.597* | 0.032 | −0.596* | 0.032 | −0.596 | 0.032 | −0.596* | 0.032 |
| Time2 (xsq) | 0.209* | 0.018 | 0.213* | 0.018 | 0.214* | 0.018 | 0.213* | 0.018 |
| Random effects | ||||||||
| Var. x0 | 1.929* | 0.041 | 1.929* | 0.041 | 1.929* | 0.041 | 1.929* | 0.041 |
| Var. xs | 3.941* | 0.165 | 3.947* | 0.165 | 3.947* | 0.165 | 3.948* | 0.165 |
| Var. xsq (residual) | 0.151* | 0.007 | 0.151* | 0.007 | 0.151* | 0.007 | 0.151* | 0.007 |
| Cov. x0, xs | −0.815* | 0.064 | −0.817* | 0.065 | −0.816* | 0.064 | −0.817* | 0.064 |
| Cov. x0, xsq | −0.168* | 0.011 | −0.169* | 0.011 | −0.171* | 0.011 | −0.171* | 0.011 |
| Regr. xs → xsq | −0.449* | 0.006 | −0.450* | 0.006 | −0.449* | 0.006 | −0.449* | 0.006 |
| Residual, σ2e | 1.375* | 0.014 | 1.375* | 0.014 | 1.375* | 0.014 | 1.375* | 0.014 |
| Survival Model | ||||||||
| Socio-demographic | ||||||||
| Age | 1.701* | 0.043 | 1.600* | 0.044 | 1.587* | 0.043 | 1.548* | 0.043 |
| Women | −0.311* | 0.029 | −0.301* | 0.030 | −0.306* | 0.030 | −0.303* | 0.030 |
| Education | −0.166* | 0.036 | −0.158* | 0.036 | −0.136* | 0.037 | −0.104* | 0.037 |
| Religion | −0.040 | 0.025 | −0.062 | 0.025 | −0.063 | 0.025 | −0.042 | 0.025 |
| Marital/partner status | −0.083* | 0.029 | −0.102* | 0.029 | −0.107* | 0.029 | −0.082 | 0.032 |
| Household income | −0.002 | 0.032 | −0.036 | 0.034 | −0.030 | 0.034 | −0.023 | 0.034 |
| Physical health | ||||||||
| Disability | – | – | 0.059 | 0.023 | 0.057 | 0.023 | 0.065* | 0.023 |
| Physician visits | – | – | 0.286* | 0.023 | 0.289* | 0.023 | 0.292* | 0.023 |
| Hospital visit | 0.117* | 0.022 | 0.114* | 0.022 | 0.116* | 0.022 | ||
| Perceived control | ||||||||
| Perc. Control | – | – | – | – | −0.100* | 0.032 | −0.077 | 0.033 |
| Social orientation | ||||||||
| Social goals | – | – | – | – | – | – | −0.031 | 0.028 |
| Family goals | – | – | – | – | – | – | −0.062 | 0.028 |
| Social participation | – | – | – | – | – | – | −0.171* | 0.041 |
| Itc. (x0) | −0.415* | 0.034 | −0.308* | 0.036 | −0.288* | 0.037 | −0.269* | 0.038 |
| Age × x0 | 0.136* | 0.024 | 0.134* | 0.025 | 0.134* | 0.026 | 0.130* | 0.026 |
| Perc. control × x0 | – | – | – | – | −0.010 | 0.020 | −0.008 | 0.021 |
| Social part. × x0 | – | – | – | – | – | – | −0.021 | 0.036 |
| xs | −0.257* | 0.031 | −0.236* | 0.032 | −0.242* | 0.032 | −0.239* | 0.033 |
| Age × xs | 0.094* | 0.021 | 0.108* | 0.021 | 0.110* | 0.022 | 0.106* | 0.022 |
| Perc. control × xs | – | – | – | – | −0.006 | 0.018 | 0.001 | 0.018 |
| Soc. part. × xs | – | – | – | – | – | – | −0.031 | 0.037 |
| xsq | −1.421* | 0.170 | −0.968* | 0.179 | −0.956* | 0.174 | −0.921* | 0.192 |
| Age × xsq | 1.091* | 0.123 | 1.093* | 0.118 | 1.000* | 0.125 | 0.944* | 0.129 |
| Perc. control × xsq | – | – | – | – | −0.365* | 0.108 | −0.345* | 0.108 |
| Soc. part. × xsq | – | – | – | – | – | – | −0.136 | 0.250 |
| # free parameters | 22 | 25 | 29 | 35 | ||||
| AIC | 475,804 | 475,579 | 475,567 | 475,547 | ||||
| Δ AIC/# free parameters | – | 225/3 | 12/4 | 20/6 | ||||
Note. Unstandardized estimates and standard errors are presented. Life satisfaction ratings are in the original metric on a scale from 0 to 10. All correlates are scaled in z-score units (M = 0; SD = 1), change scaled per decade. n = 10,597 (deceased: n = 1,560). Itc. (x0) = intercept. xs = linear rate of change. xsq = quadratic rate of change. Religion = religious activities. Soc. part. = social participation. Perc. control = perceived control. AIC = Akaike Information Criterion, a relative model fit statistic.
p < .01.
Table 3.
Shared Parameter Growth and Survival Models: Mortality Hazards Associated with Level and Change in Life Satisfaction and Correlates
| Model 1 |
Model 2 |
Model 3 |
Model 4 |
|||||
|---|---|---|---|---|---|---|---|---|
| Predictor | HR | 99% CI | HR | 99% CI | HR | 99% CI | HR | 99% CI |
| Socio-demographic | ||||||||
| Age | 5.479* | 4.904–6.123 | 4.953* | 4.424–5.546 | 4.889* | 4.371–5.468 | 4.702* | 4.204–5.265 |
| Women | 0.733* | 0.679–0.791 | 0.740* | 0.686–0.799 | 0.736* | 0.682–0.795 | 0.739* | 0.684–0.798 |
| Education | 0.847* | 0.773–0.929 | 0.854* | 0.779–0.937 | 0.873* | 0.795–0.959 | 0.901* | 0.820–0.991 |
| Religion | 0.961 | 0.901–1.023 | 0.940 | 0.882–1.002 | 0.939 | 0.881–1.001 | 0.959 | 0.899–1.023 |
| Marital/partner status | 0.920* | 0.854–0.991 | 0.903* | 0.837–0.973 | 0.899* | 0.833–0.969 | 0.921 | 0.848–1.001 |
| Household income | 0.998 | 0.919–1.084 | 0.965 | 0.884–1.051 | 0.970 | 0.890–1.059 | 0.977 | 0.895–1.066 |
| Physical health | ||||||||
| Disability | – | – | 1.061 | 0.999–1.125 | 1.059 | 0.998–1.124 | 1.067* | 1.005–1.132 |
| Physician visits | – | – | 1.331* | 1.255–1.412 | 1.335* | 1.259–1.416 | 1.339* | 1.262–1.420 |
| Hospital visits | 1.124* | 1.063–1.189 | 1.121* | 1.060–1.186 | 1.123* | 1.061–1.188 | ||
| Perceived control | ||||||||
| Perc. control | – | – | – | – | 0.905* | 0.832–0.983 | 0.926 | 0.851–1.007 |
| Social orientation | ||||||||
| Social goals | – | – | – | – | – | – | 0.969 | 0.903–1.042 |
| Family goals | – | – | – | – | – | – | 0.940 | 0.874–1.010 |
| Social participation | – | – | – | – | – | – | 0.843* | 0.759–0.936 |
| Itc. (x0) | 0.660* | 0.605–0.721 | 0.735* | 0.670–0.807 | 0.750* | 0.682–0.824 | 0.764* | 0.693–0.843 |
| Age × x0 | 1.146* | 1.077–1.220 | 1.143* | 1.073–1.219 | 1.143* | 1.069–1.221 | 1.139* | 1.065–1.218 |
| Perc. control × x0 | – | – | – | – | 0.990 | 0.940–1.043 | 0.992 | 0.941–1.046 |
| Soc. part × x0 | – | – | – | – | – | – | 0.979 | 0.894–1.074 |
| xs | 0.773* | 0.714–0.837 | 0.790* | 0.728–0.856 | 0.785* | 0.724–0.852 | 0.787* | 0.723–0.856 |
| Age × xs | 1.099* | 1.041–1.161 | 1.114* | 1.055–1.177 | 1.116* | 1.054–1.181 | 1.112* | 1.050–1.177 |
| Perc. control × xs | – | – | – | – | 0.994 | 0.949–1.040 | 1.001 | 0.956–1.048 |
| Soc. part. × xs | – | – | – | – | – | – | 0.969 | 0.882–1.066 |
| xsq | 0.241* | 0.156–0.374 | 0.380* | 0.239–0.602 | 0.384* | 0.245–0.602 | 0.398* | 0.243–0.652 |
| Age × xsq | 2.977* | 2.168–4.084 | 2.983* | 2.199–4.043 | 2.718* | 1.970–3.755 | 2.570* | 1.842–3.589 |
| Perc. control × xsq | – | – | – | – | 0.694* | 0.526–0.917 | 0.708* | 0.536–0.935 |
| Soc. part. × xsq | – | – | – | – | – | – | 0.873 | 0.458–1.662 |
Note. HR = Hazard ratio. CI = 99% Confidence interval. Life satisfaction ratings are in the original metric on a scale from 0 to 10. All correlates are scaled in z-score units (M = 0; SD = 1), change scaled per decade. n = 10,597 (deceased: n = 1,560). Itc. (x0) = intercept. xs = linear rate of change. xsq = quadratic rate of change. Religion = religious activities. Soc. part. = social participation. Perc. control = perceived control.
p < .01.
The negative covariance between intercept and linear slope parameters indicated that those who had higher levels of life satisfaction at baseline experienced steeper linear decline over time (Model 1: covariance [intercept, rs] = −0.815). The negative covariance between intercept and quadratic slope parameters indicated that the linear decline in life satisfaction was more accelerated for those with higher levels of life satisfaction at baseline (Model 1: covariance [intercept, rsq] = −0.168). The negative association between linear and quadratic slope parameters indicated that for those who experienced steeper linear life satisfaction declines, the decline in life satisfaction was more decelerated (Model 1: regression coefficient xsqi on xsi = −0.449).
The simultaneous mortality prediction revealed the expected effects in that being younger (Model 1: β = 1.701 in Table 2 or HR = 5.479 as exponential of β in Table 3), being a woman (Model 1: HR = 0.733), having a higher education (model 1: HR = 0.847), and living with a spouse or partner (Model 1: HR = 0.920) were each associated with lower mortality hazards. Higher frequency of physician visits (Model 2: HR = 1.331) and hospital stays (Model 2: HR = 1.124) were in turn each associated with higher mortality hazards. Perceived control (Model 3: HR = 0.905) predicted lower mortality hazards over and above socio-demographic characteristics and physical health. Of the social orientation variables, social participation (Model 4: HR = 0.843) predicted lower mortality hazards, while social and family goals were not associated with mortality hazards (Model 3: HR = 0.969 and HR = 0.940, respectively).
Most important for our research questions, analyses revealed that levels of as well as linear and quadratic rates of change in life satisfaction were each uniquely predictive of mortality hazards, both at the zero-order level and after relevant correlates were taken into account. From the zero-order Model 1 in Table 2 it can be obtained that being one scale point higher in life satisfaction was associated with an effect of β = −0.415, which amounts to a hazard ratio of HR = 0.660 (exponential of β). Thus, being one scale point higher in life satisfaction was associated with a 34.0% reduction in mortality hazards. The standard deviation of the life satisfaction intercept at the beginning of the study amounted to 1.389 scale points (Var = 1.929). Translating the effect of life satisfaction intercept into standard deviation units, being one standard deviation (1.389 scale points) above sample average was associated with an effect of −0.576 (β × SD), which translates into a hazard ratio of HR = 0.562, i.e. 43.8% lower mortality hazards. By the end of the follow-up period, 15% of the participants in the baseline sample had died (see Table 1), that is, over 20 years, the average survival probability was 85% in our study. For a person with one standard deviation higher life satisfaction at baseline, the survival probability was 91.2% (.85 to the power of .562; see Yan, Sun, Boivin, Kwon, & Li, 2016). Similarly, experiencing one scale point less linear decline in life satisfaction than the average sample was associated with a 22.7% reduction in mortality hazards. This amounted to 40.0% reduction in mortality hazards, and a survival probability of 90.7% for one standard deviation less decline. Finally, experiencing one scale point less life satisfaction decline in the concave curvature than the average sample was associated with a 75.9% reduction in mortality hazards. Translating this effect into standard deviation units, one standard deviation unit less quadratic decline was associated with a 42.4% reduction in mortality hazards, and with a survival probability of 91,1%.
The predictive effects of life satisfaction levels (in Table 3, Model 1: HR = 1.146) and linear (Model 1: HR = 1.099) and quadratic changes (Model 1: HR = 2.977) differed by age. To gain a better understanding of these interaction effects, associations with mortality hazards are shown in Figure 2. It can be obtained that the predictive effects were stronger for older participants. For example, Panel A of Figure 2 shows that the difference in hazard ratio between low vs. high levels of life satisfaction was larger for older (baseline age 1 SD above sample average) as compared to younger (baseline age 1 SD below sample average) or average-aged participants (baseline age at sample average, 44 years). The interactions of perceived control with level of (Model 3: HR = 0.990) and with linear change in (Model 3: HR = 0.994) life satisfaction were both not reliably different from 0, indicating that the predictive effects of perceived control for mortality risks were similar at all levels of life satisfaction at baseline and irrespective of the rates of linear change in life satisfaction over the follow-up period (centered at baseline). The interaction of perceived control with the quadratic rate of change in life satisfaction though reliably predicted mortality risks (Model 3: HR = 0.694). To better understand these interactions, differential associations are plotted in Figure 3. It can be obtained that participants with higher levels of perceived control (1 SD above sample average) were less likely to die at all baseline levels and rates of linear change in life satisfaction (Panels A and B, Figure 3). The predictive effects of perceived control for mortality were diminished for individuals with negative rates of quadratic change, indicating accelerated life satisfaction decline (Panel C, Figure 3). After controlling for social orientation, the predictive effect of perceived control was no longer reliably different from 0 (Model 4: HR = 0.926) but the moderating effects for associations of mortality with the quadratic slope component remained reliably different from 0 (Model 4: HR = 0.708). Social participation did not moderate the associations between levels of (Model 4: HR = 0.979) and linear (model 4: HR = 0.969) and quadratic (Model 4: HR = 0.873) change in life satisfaction and mortality.
Figure 2.
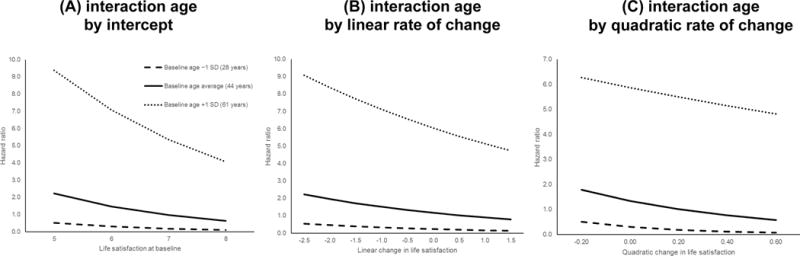
Illustrating the age by level (Panel A), linear slope (Panel B), and quadratic slope (Panel C) of life satisfaction interaction in the prediction of mortality hazards by plotting the predictive effects of life satisfaction level for mortality separately for three different values of age taken from the first observation. As can be obtained, for older SOEP participants, more differentiated hazard ratios emerged between those who reported low or high levels of life satisfaction at baseline, and between those who experienced less or more linear or quadratic decline. The values displayed on the x-axis correspond to −/+ 1 SD around the sample average for the level of, and linear and quadratic change in life satisfaction, respectively. Coefficients obtained from Model 1.
Figure 3.
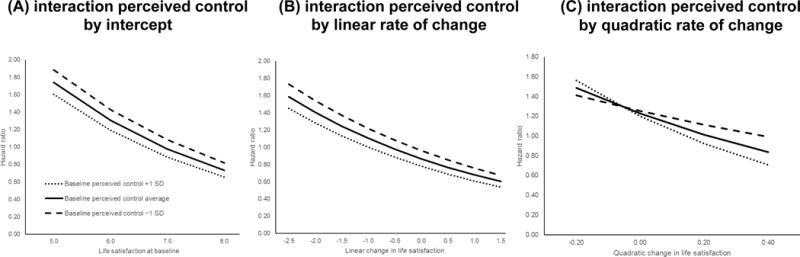
Illustrating the perceived control by level (Panel A), linear slope (Panel B), and quadratic slope (Panel C) of life satisfaction interaction in the prediction of mortality hazards by plotting the predictive effects of life satisfaction level for mortality separately for three different values of perceived control at baseline. It can be obtained that mortality risk was lower for individuals with higher levels of perceived control at all levels of baseline life satisfaction (Panel A) and linear change in life satisfaction (Panel B). For individuals experiencing accelerated life satisfaction decline, the effect of perceived control on mortality hazards was diminished. The values displayed on the x-axis correspond to −/+ 1 SD around the sample average for the level of, and linear and quadratic change in life satisfaction, respectively. Coefficients obtained from Model 3.
One major goal of this study was to reveal whether the predictive effects of life satisfaction trajectories were unique and/or shared with physical health, perceived control, and social orientation. Table 4 shows unique and shared explained variance by trajectories of life satisfaction and correlates. It can be obtained that levels of and changes in life satisfaction explained 22.2% of the variance in mortality hazards before including any other predictors (Model 0). In models including predictors related to socio-demographic characteristics, physical health, perceived control, and social orientation (Models 1 to 4), the unique contribution of life satisfaction trajectories ranged from 3.0 to 5.5% and the explained variance shared with other predictors ranged from 16.7 to 19.2%. This indicates that about 14% to 25% of the total predictive effects of life satisfaction trajectories are unique and 75% to 86% are shared with socio-demographic characteristics, physical health, perceived control, and social orientation. The proportion of variance explained by correlates (without life satisfaction trajectory) ranged between 43.4% (Model 1) and 48.1% (Model 4). Across the series of models, about 59 to 62% of these predictive effects were unique and 38 to 41% were shared with levels of and changes in life satisfaction.
Table 4.
Variance decomposition: Unique and shared effects of life satisfaction trajectory and correlates in explaining mortality
| Model | Explained total variance | Explained variance by correlates (without life satisfaction trajectory) | Unique explained variance by additional correlates | Unique explained variance by all correlates | Unique explained variance by life satisfaction trajectory | Shared explained variance by life satisfaction trajectory and correlates |
|---|---|---|---|---|---|---|
| Model 0 | 22.2% | – | – | – | 22.2% | – |
| Model 1 | 48.9% | 43.4% | 26.7% | 26.7% | 5.5% | 16.7% |
| Model 2 | 50.4% | 47.4% | 1.5% | 28.2% | 3.0% | 19.2% |
| Model 3 | 50.8% | 47.6% | 0.4% | 28.6% | 3.2% | 19.0% |
| Model 4 | 51.1% | 48.1% | 0.3% | 28.9% | 3.0% | 19.2% |
Discussion
In the present study, we examined the predictive effects of levels of and changes in life satisfaction for mortality hazards. Using 20-year longitudinal data from the nation-wide German Socio-Economic Panel Study (SOEP), we found that lower levels and steeper declines of life satisfaction were each uniquely predictive of higher mortality risks, independent of socio-demographic variables, physical health, perceived control, and social orientation. Results also revealed moderating effects of age and perceived control, with stronger predictive effects of both life satisfaction levels and changes for mortality hazards among older relative to younger adults, and stronger predictive effects of quadratic life satisfaction declines among those who perceive more control over their lives. Variance decomposition suggests that the predictive effects of life satisfaction trajectories are both unique (3 to 6%) and shared with health, perceived control, and social orientation (17–19%). We highlight strengths and challenges of a predictive approach to link developmental changes (in life satisfaction) to mortality hazards, discuss potential mechanisms underlying our findings, and consider implications for healthy aging.
Well-Being and Mortality
Our findings provide further evidence that levels of well-being predict mortality hazards and add to existing research by demonstrating that declines of life satisfaction provide additional and unique predictive effects for mortality hazards as well. As outlined in the introduction, socio-economic status, physical health, and social orientation may be “common causes” of well-being level/change and mortality. Partly in line with this reasoning, the predictive effects of levels of and changes in life satisfaction could partially be explained by this set of variables (75 to 86 % of the total effect). However, some predictive effects of life satisfaction trajectories were unique (14 to 25 % of the total effect) after controlling for individual differences in socio-demographic characteristics, physical health, perceived control, and social orientation. From this, we conclude that in terms of prediction accuracy for mortality hazards, levels of and changes in mortality are partially holding the same information as the other correlates. One interpretation is that life satisfaction judgments are fairly good summaries of how individuals are doing in different domains of life. However, because levels of and changes in life satisfaction hold the same information as the other correlates, the added value for mortality prediction is limited. Adding to the picture, around 3 to 6% unique variance explained in mortality hazards by a single-item over and above the important other correlates can be considered notable.
In contrast to a previous study by Liu and colleagues (2016), controlling for health did not fully account for the effects of well-being on mortality. In the study by Liu and colleagues (2016), health was indicated by a subjective health rating, which measures satisfaction with health rather than objective health status (Baltes & Smith, 2003; Idler, 1993) and may be expected to show a considerable degree of overlap with well-being compared to other indicators of health.
The Role of Health, Perceived Control, and Social Orientation
Our findings on associations of how socio-demographic characteristics, perceived control, and social orientation are associated with mortality hazards are in line with previous research. Younger participants, women, those with higher levels of education, and participants living with a spouse or partner had lower risk of mortality (Anstey et al., 2001; Frisch & Simonsen, 2013; Mathers, Sadana, Salomon, Murray, & Lopez, 2001). The effect of living with a spouse or partner was no longer significant after controlling for social orientation.
Our findings uniquely add to the terminal decline literature by showing that not only does well-being often severely decline at the end of life, but also that individual differences in such decrements help predict who is going to survive. Past research on terminal decline of well-being has focused on identifying typical changes in well-being that occur at the end of life and individual differences in how the last years of life are experienced. These studies have generated important insights about which factors are associated with steeper or less pronounced terminal decline in well-being (e.g., social resources: Windsor et al., 2015; for an overview, see Hülür et al., 2016). These insights can be used to develop tailored interventions to improve quality of life at the end of life. However, this does not mean that a steep decline in well-being necessarily indicates approaching death. Because studies of terminal decline focus on the experiences and behaviors in the last years of life in individuals with documented death events, these studies are not in a position to rule out that there are people who experience similar declines in well-being but survive. This is the gap that the present research sought to fill. Taking a predictive approach to well-being and mortality, we found that lower levels of and more severe linear and quadratic declines of life satisfaction indeed predicted mortality independent of one another in an adult lifespan sample. Furthermore, our predictive approach also enabled us to identify, disentangle, and quantify the shared and unique contributions of socio-demographic, physical health, and psychosocial factors that buffer or increase mortality risks at low levels and steeper declines of life satisfaction. Over and above physical health factors, chronological age and perceived control emerged as moderating factors.
To begin with, older age was found to operate as a vulnerability factor: Mortality associations with levels and changes in life satisfaction were stronger among older adults, with lower levels of and declines in life satisfaction being particularly detrimental in the prediction of mortality hazards at older ages. This finding suggests that mechanisms leading to declining life satisfaction in old age may be less modifiable as compared to living circumstances leading to a lower life satisfaction at younger ages. This finding is also in line with predictions of SAVI (Charles, 2010), which proposes that older adults are more vulnerable to negative affect change, especially if it occurs due to chronic life circumstances such as pervasive health declines or caregiving burden.
Second, those with higher levels of perceived control over their lives had lower risk of mortality at all levels of life satisfaction and linear change in life satisfaction. However, at negative rates of quadratic change in life satisfaction, indicating accelerated decline, the effect of perceived control on mortality was diminished. This finding suggests that the positive effect of perceiving control over one’s life outcomes may reach its limits at times when quality of life is declining especially rapidly: Participants with higher levels of perceived control may be more effective in utilizing their resources on average (Heckhausen et al., 2013; see Gerstorf et al., 2014), for example by engaging in goal pursuit and optimizing one’s chances to reach attainable goals. However, when life circumstances are especially difficult, perceived control may not bring an additional advantage, because chances for goal attainment may be rather low (Heckhausen, Wrosch, & Schulz, 2010; Heckhausen et al., 2013).
Finally, in line with previous research (House et al. (1988); Sugisawa, Liang, & Liu, 1994), social participation was associated with lower mortality risk. Those who are more socially active may have a lower mortality risk because they are better socially integrated and can rely on support from others. Over and above this general effect, social participation did not buffer the association between declining life satisfaction and mortality. Social orientation variables related to social and family goals did not predict mortality.
Limitations and Outlook
To put our findings in perspective, we note several limitations of our study. First, although a 20-year follow-up interval is comparable or relatively longer than in typical studies focusing on mortality predictions, an even longer time interval would be desirable to thoroughly examine how mortality-related processes unfold. For example, only a small subsample in our study experienced mortality (15%). Second, our study involved a single measure of the cognitive-evaluative component of well-being (see Diener, 1984), namely life satisfaction, focusing on general evaluation of one’s living circumstances (this single measure of well-being is the only one which is available for all waves in the SOEP). It is an open question whether similar findings can be obtained for indicators of well-being that tap into affective components. Because earlier research has shown that levels of affective well-being are predictive of mortality hazards (Blazer & Hybels, 2004; Xu & Roberts, 2010) and because affective well-being also declines late in life (Palgi et al., 2010), we expect declines of affective well-being to be predictive of mortality as well. We also note that our socio-demographic, physical health, and psychological factors could explain some but not all of the predictive effects of levels of and changes in life satisfaction for mortality hazards. As noted in earlier work, it is quite possible that associations between well-being and mortality are partially based on biological factors (see Boehm & Kubzansky, 2012, Chida & Steptoe, 2008) to the extent that subclinical levels of disease are reflected in compromised well-being but not yet reflected in clinical diagnoses. To illustrate, higher well-being is associated with better cardiovascular fitness and less cardiovascular mortality. Regarding the mechanisms through which perceived control and social orientation may be associated with mortality, studies which specifically address the pursuit of, disengagement from, and adjustment of goals for everyday life and functioning, as well as the degree of support-seeking and acceptance of others’ help would be highly informative. Future research would thus benefit from more mechanism-oriented study designs that specifically target the potentially contributing behaviors and physiological factors.
We also note as a limitation that socio-demographic factors (e.g., income, marital status), health, perceived control, and social orientation were each modeled as time-invariant between-person difference characteristics in order not to overcomplicate the models. However, this possibly led us to neglect the role of changes in these variables, which are also potential “common causes” for associations between life satisfaction trajectories and mortality. For example, had annual longitudinal data for social participation been available, we would have been able to examine whether sustained social participation over time serves as a resilience factor in the association between life satisfaction trajectories and mortality.
Also, our study was based on a national adult lifespan sample (baseline age: 18 to 98 years) from Germany. Previous research has shown that levels of well-being predict mortality across cultures and geographical locations (e.g., United States: Xu & Roberts, 2010; South Korea: Kimm et al., 2012). Future research should also examine whether change in well-being predicts mortality in other populations and regions across the world. As a final limitation, we acknowledge that our study involved an adult lifespan sample and thus only a small proportion of the population studied was very old at baseline. Because very old individuals are a particularly vulnerable population segment (Baltes & Smith, 2003; Charles & Luong, 2013), future research should focus on associations between well-being and mortality in this age group.
Conclusions
Taken together, our findings demonstrate that people who are less satisfied with their lives and those who experience declines in life satisfaction are more likely to die (earlier). These associations are to a large extent explained by physical health, perceived control, and social orientation. Age is identified as a vulnerability factor: For older adults, levels of and changes in life satisfaction are better predictors of mortality than for younger adults. Life satisfaction uniquely predicts mortality after accounting for socio-demographic factors, physical health, perceived control, and social orientation: To be satisfied with life may be a protective factor by itself. More research is needed to better understand the mechanisms that link trajectories of well-being to mortality hazards and healthy aging.
Acknowledgments
The authors gratefully acknowledge the support provided by the German Research Foundation (DFG, GE 1896/3-1, GE 1896/6-1) the National Institute on Aging Grants RC1-AG035645, R21-AG032379, and R21-AG033109, the Max Planck Society and the Max Planck Institute for Human Development, Berlin; and the Penn State Children, Youth, and Families Consortium. Christiane Hoppmann gratefully acknowledges the support of the Michael Smith Foundation for Health Research and the Canada Research Chairs program. Frank J. Infurna gratefully acknowledges the support provided by the National Institute on Aging Grant R01-AG048844. The content is solely the responsibility of the authors and does not necessarily represent the official views of the funding agencies.
Footnotes
In Table 4, we report the moderating role of social participation for associations between life satisfaction change and mortality. Social participation was the only social orientation variable that reliably predicted mortality. Moderating effects of family goals and social goals were not included in order not to overly complicate the model. Follow-up analyses showed that neither family goals nor social goals significantly moderated associations between linear and quadratic changes in life satisfaction and mortality.
At first sight, the finding that decline in life satisfaction levels off at the end of the time series is not in line with previous research on late-life well-being, where accelerated declines are typically observed at the end of life (see Hülür et al., 2016). We note, however, that our current approach differs in several important ways. Specifically, in contrast to typical studies of terminal decline, which examine trajectories of late-life well-being among deceased participants, we examined changes in life satisfaction (a) over a time-in-study metric as opposed to a time-to-death metric and (b) both in surviving and deceased participants. Life satisfaction trajectories of deceased participants (n = 1,560) were characterized by accelerated decline toward the end of the time series (intercept: 6.572, linear slope: −0.726, quadratic slope: −0.329) corroborating earlier reports.
References
- Anstey KJ, Luszcz MA, Giles LC, Andrews GR. Demographic, health, cognitive, and sensory variables as predictors of mortality in very old adults. Psychology and Aging. 2001;16:3–11. doi: 10.1037/0882-7974.16.1.3. [DOI] [PubMed] [Google Scholar]
- Antonucci TC. Social relations: An examination of social networks, social support, and sense of control. In: Birren JE, Schaie KW, editors. Handbook of the psychology of aging. San Diego, CA: Academic Press; 2001. pp. 427–453. [Google Scholar]
- Baltes PB. On the incomplete architecture of human ontogeny: Selection, optimization, and compensation as foundation of developmental theory. American Psychologist. 1997;52:366–380. doi: 10.1037/0003-066X.52.4.366. [DOI] [PubMed] [Google Scholar]
- Baltes PB, Lindenberger U, Staudinger UM. Life-span theory in developmental psychology. In: Lerner RM, editor. Handbook of child psychology: Vol 1. Theoretical models of human development. 6th. New York, NY: Wiley; 2006. pp. 569–664. [Google Scholar]
- Baltes PB, Smith J. New frontiers in the future of aging: From successful aging of the young old to the dilemmas of the fourth age. Gerontology. 2003;49:123–135. doi: 10.1159/000067946. [DOI] [PubMed] [Google Scholar]
- Barger SD. Social integration, social support and mortality in the US National Health Interview Survey. Psychosomatic Medicine. 2013;75:510–517. doi: 10.1097/PSY.0b013e318292ad99. [DOI] [PubMed] [Google Scholar]
- Ben-Ezra M, Shmotkin D. Physical versus mental predictors of mortality among the old-old in Israel: The CALAS Study. Research on Aging. 2010;32:595–617. doi: 10.1177/0164027510374283. [DOI] [Google Scholar]
- Berg AI, Hassing LB, Thorvadsson V, Johansson B. Personality and personal control make a difference for life satisfaction in the oldest-old: Findings in a longitudinal population-based study of individuals 80 and older. European Journal of Ageing. 2011;8:13–20. doi: 10.1007/s10433-011-0181-9. [DOI] [PMC free article] [PubMed] [Google Scholar]
- Blanchflower DG, Oswald AJ. Well-being over time in Britain and the USA. Journal of Public Economics. 2004;88:1359–1386. doi: 10.1016/S0047-2727(02)00168-8. [DOI] [Google Scholar]
- Blazer DG, Hybels CF. What symptoms of depression predict mortality in community-dwelling elders? Journal of the American Geriatrics Society. 2004;52:2052–2056. doi: 10.1111/j.1532-5415.2004.52564.x. [DOI] [PubMed] [Google Scholar]
- Boehm JK, Kubzansky LD. The heart’s content: The association between positive psychological well-being and cardiovascular health. Psychological Bulletin. 2012;138:655–691. doi: 10.1037/a0027448. [DOI] [PubMed] [Google Scholar]
- Boehm JK, Winning A, Segerstrom S, Kubzansky LD. Variability modifies life satisfaction’s association with mortality risk in older adults. Psychological Science. 2015;26:1063–1070. doi: 10.1177/0956797615581491. [DOI] [PMC free article] [PubMed] [Google Scholar]
- Carmel S, Shrira A, Shmotkin D. The will to live and death-related decline in life satisfaction. Psychology and Aging. 2013;28:1115–1123. doi: 10.1037/a0034649. [DOI] [PubMed] [Google Scholar]
- Charles ST. Strength and Vulnerability Integration: A model of emotional well-being across adulthood. Psychological Bulletin. 2010;136:1068–1091. doi: 10.1037/a0021232. [DOI] [PMC free article] [PubMed] [Google Scholar]
- Charles ST, Luong G. The theoretical model of strength and vulnerability integration. Current Directions in Psychological Science. 2013;22:443–448. doi: 10.1177/0963721413497013. [DOI] [Google Scholar]
- Charles ST, Reynolds CA, Gatz M. Age-related differences and change in positive and negative affect over 23 years. Journal of Personality and Social Psychology. 2001;80:136–151. doi: 10.1037/0022-3514.80.1.136. [DOI] [PubMed] [Google Scholar]
- Chida Y, Steptoe A. Positive psychological well-being and mortality: A quantitative review of prospective observational studies. Psychosomatic Medicine. 2008;70:741–756. doi: 10.1097/PSY.0b013e31818105ba. [DOI] [PubMed] [Google Scholar]
- Chui H, Gerstorf D, Hoppmann CA, Luszcz MA. Trajectories of depressive symptoms in old age: Integrating age-, pathology-, and mortality-related changes. Psychology and Aging. 2015;30:940–951. doi: 10.1037/pag0000054. [DOI] [PubMed] [Google Scholar]
- Collins AL, Glei DA, Goldman N. The role of life satisfaction and depressive symptoms in all-cause mortality. Psychology and Aging. 2009;24:696–702. doi: 10.1037/a0016777. [DOI] [PMC free article] [PubMed] [Google Scholar]
- Diehr P, Williamson J, Burke GL, Psaty BM. The aging and dying processes and the health of older adults. Journal of Clinical Epidemiology. 2002;55:269–278. doi: 10.1016/S0895-4356(01)00462-0. [DOI] [PubMed] [Google Scholar]
- Diener E. Subjective well-being. Psychological Bulletin. 1984;95:542–575. doi: 10.1037/0033-2909.95.3.542. [DOI] [PubMed] [Google Scholar]
- Diener E, Chan MY. Happy people live longer: Subjective well-being contributes to health and longevity. Applied Psychology: Health and Well-Being. 2011;3:1–43. doi: 10.1111/j.1758-0854.2010.01045.x. [DOI] [Google Scholar]
- Fauth EB, Gerstorf D, Ram N, Malmberg B. Comparing changes in late-life depressive symptoms across aging, disablement, and mortality processes. Developmental Psychology. 2014;50:1584–1593. doi: 10.1037/a0035475. [DOI] [PMC free article] [PubMed] [Google Scholar]
- Frisch M, Simonsen J. Marriage, cohabitation and mortality in Denmark: national cohort study of 6.5 million persons followed for up to three decades (1982–2011) International Journal of Epidemiology. 2013;42:559–578. doi: 10.1093/ije/dyt024. [DOI] [PubMed] [Google Scholar]
- Fujita F, Diener E. Life satisfaction set point: Stability and change. Journal of Personality and Social Psychology. 2005;88:158–164. doi: 10.1037/0022-3514.88.1.158. [DOI] [PubMed] [Google Scholar]
- Gebauer JE, Sedikides C, Neberich W. Religiosity, social self-esteem, and psychological adjustment: On the cross-cultural specificity of the psychological benefits of religiosity. Psychological Science. 2012;23:158–160. doi: 10.1177/0956797611427045. [DOI] [PubMed] [Google Scholar]
- Gerstorf D, Heckhausen J, Ram N, Infurna FJ, Schupp J, Wagner GG. Perceived personal control buffers terminal decline in well-being. Psychology and Aging. 2014;29:612–625. doi: 10.1037/a0037227. [DOI] [PMC free article] [PubMed] [Google Scholar]
- Gerstorf D, Hoppmann CA, Löckenhoff CE, Infurna FJ, Schupp J, Wagner GG, Ram N. Terminal decline in well-being: The role of social orientation. Psychology and Aging. 2016;31:149–165. doi: 10.1037/pag0000072. [DOI] [PMC free article] [PubMed] [Google Scholar]
- Gerstorf D, Ram N. Inquiry into terminal decline: Five objectives for future study. The Gerontologist. 2013;53:727–737. doi: 10.1093/geront/gnt046. [DOI] [PMC free article] [PubMed] [Google Scholar]
- Gerstorf D, Ram N. A framework for studying mechanisms underlying terminal decline in well-being. International Journal of Behavioral Development. 2015;39:210–220. doi: 10.1177/0165025414565408. [DOI] [Google Scholar]
- Ghisletta P. Application of a joint multivariate longitudinal–survival analysis to examine the terminal decline hypothesis in the Swiss Interdisciplinary Longitudinal Study on the Oldest Old. The Journals of Gerontology, Series B: Psychological Sciences. 2008;63B:P185–P192. doi: 10.1093/geronb/63.3.P185. [DOI] [PubMed] [Google Scholar]
- Ghisletta P, McArdle JJ, Lindenberger U. Longitudinal cognition-survival relations in old and very old age: 13-year data from the Berlin Aging Study. European Psychologist. 2006;11:204–223. doi: 10.1027/1016-9040.11.3.204. [DOI] [Google Scholar]
- Guven C, Saloumidis R. Life satisfaction and longevity: Longitudinal evidence from the German Socio-Economic Panel. German Economic Review. 2013;15:453–472. doi: 10.1111/geer.12024. [DOI] [Google Scholar]
- Haring-Hidore M, Stock WA, Okun MA, Witter RA. Marital status and subjective well-being: A research synthesis. Journal of Marriage and Family. 1985;4:947–953. [Google Scholar]
- Headey B, Muffels R, Wagner GG. Long-running German panel survey shows that personal and economic choices, not just genes, matter for happiness. PNAS: Proceedings of the National Academy of Sciences of the United States of America. 2010;107:17922–17926. doi: 10.1073/pnas.1008612107. [DOI] [PMC free article] [PubMed] [Google Scholar]
- Heckhausen J, Schulz R. A life-span theory of control. Psychological Review. 1995;102:284–304. doi: 10.1037/0033-295X.102.2.284. [DOI] [PubMed] [Google Scholar]
- Heckhausen J, Wrosch C, Schulz R. A motivational theory of life-span development. Psychological Review. 2010;117:32–60. doi: 10.1037/a0017668. [DOI] [PMC free article] [PubMed] [Google Scholar]
- Heckhausen J, Wrosch C, Schulz R. A lines-of-defense model for managing health threats: A review. Gerontology. 2013;59:438–447. doi: 10.1159/000351269. [DOI] [PMC free article] [PubMed] [Google Scholar]
- House JS, Kessler RC, Herzog AR. Age, socioeconomic status, and health. Milbank Quarterly. 1990;68:383–411. doi: 10.2307/3350111. [DOI] [PubMed] [Google Scholar]
- House JS, Landis KR, Umberson D. Social relationships and health. Science. 1988;241:540–545. doi: 10.1126/science.3399889. [DOI] [PubMed] [Google Scholar]
- Hu YR, Goldman N. Mortality differentials by marital status: An international comparison. Demography. 1990;27:233–250. [PubMed] [Google Scholar]
- Hülür G, Ram N, Gerstorf D. Historical improvements in well-being do not hold in late life: Studies of birth-year and death-year cohorts. Developmental Psychology. 2015;51:998–1012. doi: 10.1037/a0039349. [DOI] [PMC free article] [PubMed] [Google Scholar]
- Hülür G, Ram N, Gerstorf D. Terminal decline of function. In: Bengtson VL, Settersten RA Jr, editors. Handbook of Theories of Aging. 3rd. New York, NY: Springer; 2016. pp. 277–300. [Google Scholar]
- Idler EL. Age differences in self-assessments of health: Age changes, cohort differences, or survivorship? Journals of Gerontology: Series B: Psychological Sciences and Social Sciences. 1993;48:P289–P300. doi: 10.1093/geronj/48.6.S289. [DOI] [PubMed] [Google Scholar]
- Infurna FJ, Gerstorf D, Zarit SH. Examining dynamic links between mastery and health: Longitudinal evidence for differential effects in midlife and old age. Developmental Psychology. 2011;47:9–18. doi: 10.1037/a0021022. [DOI] [PMC free article] [PubMed] [Google Scholar]
- Infurna FJ, Okun MA. Antecedents and outcomes of level and rates of change in perceived control: The moderating role of age. Developmental Psychology. 2015;51:1420–1437. doi: 10.1037/a0039530. [DOI] [PubMed] [Google Scholar]
- Infurna FJ, Ram N, Gerstorf D. Level and change in perceived control predict 19-year mortality: Findings from the Americans’ Changing Lives Study. Developmental Psychology. 2013;49:1833–1847. doi: 10.1037/a0031041. [DOI] [PubMed] [Google Scholar]
- Kimm H, Sull JW, Gombojav B, Yi SW, Ohrr H. Life satisfaction and mortality in elderly people: The Kangwha Cohort Study. BMC Public Health. 2012;12:54. doi: 10.1186/1471-2458-12-54. [DOI] [PMC free article] [PubMed] [Google Scholar]
- Kotter-Grühn D, Kleinspehn-Ammerlahn A, Gerstorf D, Smith J. Self-perceptions of aging predict mortality and change with approaching death: 16-year longitudinal results from the Berlin Aging Study. Psychology and Aging. 2009;24:654–667. doi: 10.1037/a0016510. [DOI] [PubMed] [Google Scholar]
- Krause N, Stryker S. Stress and well-being: The buffering role of locus of control beliefs. Social Science and Medicine. 1984;18:783–790. doi: 10.1016/0277-9536(84)90105-9. [DOI] [PubMed] [Google Scholar]
- Kunzmann U, Little TD, Smith J. Is age-related stability of well-being a paradox? Cross-sectional and longitudinal evidence from the Berlin Aging Study. Psychology and Aging. 2000;15:511–526. doi: 10.1037/0882-7974.15.3.511. [DOI] [PubMed] [Google Scholar]
- Lachman ME, Weaver SL. The sense of control as a moderator of social class differences in health and well-being. Journal of Personality and Social Psychology. 1998;74:763–773. doi: 10.1037/0022-3514.74.3.763. [DOI] [PubMed] [Google Scholar]
- Liu B, Floud S, Pirie K, Green J, Peto R, Beral V. Does happiness itself directly affect mortality? The prospective UK Million Women Study. Lancet. 2016;387:874–81. doi: 10.1016/S0140-6736(15)01087-9. [DOI] [PMC free article] [PubMed] [Google Scholar]
- Lucas RE. Long-term disability is associated with lasting changes in subjective well-being: Evidence from two nationally representative longitudinal studies. Journal of Personality and Social Psychology. 2007;92:717–730. doi: 10.1037/0022-3514.92.4.717. [DOI] [PubMed] [Google Scholar]
- Lyubomirsky S, Layous K. How do simple positive activities increase well-being? Current Directions in Psychological Science. 2013;22:57–62. doi: 10.1177/0963721412469809. [DOI] [Google Scholar]
- Maier H, Smith J. Psychological predictors of mortality in old age. Journal of Gerontology: Psychological Sciences. 1999;54B:P44–P54. doi: 10.1093/geronb/54b.1.p44. [DOI] [PubMed] [Google Scholar]
- Mathers CD, Sadana R, Salomon JA, Murray CJL, Lopez AD. Healthy life expectancy in 191 countries, 1999. The Lancet. 2001;357:1685–1691. doi: 10.1016/S0140-6736(00)04824-8. [DOI] [PubMed] [Google Scholar]
- McCullough ME, Hoyt WT, Larson DB, Koenig HG, Thoresen CE. Religious involvement and mortality: A meta-analytic review. Health Psychology. 2000;19:211–222. doi: 10.1037//0278-6133.19.3.211. [DOI] [PubMed] [Google Scholar]
- Mroczek DK, Kolarz CM. The effect of age on positive and negative affect: A developmental perspective on happiness. Journal of Personality and Social Psychology. 1998;75:1333–1349. doi: 10.1037/0022-3514.75.5.1333. [DOI] [PubMed] [Google Scholar]
- Mroczek DK, Spiro A., III Change in life satisfaction during adulthood: Findings from the Veterans Affairs Normative Aging Study. Journal of Personality and Social Psychology. 2005;88:189–202. doi: 10.1037/0022-3514.88.1.189. [DOI] [PubMed] [Google Scholar]
- Muniz-Terrera G, Piccinin AM, Johansson B, Matthews F, Hofer SM. Joint modeling of longitudinal change and survival: An investigation of the association between change in memory scores and death. GeroPsych: The Journal of Gerontopsychology and Geriatric Psychiatry. 2011;24:177–185. doi: 10.1024/1662-9647/a000047. [DOI] [PMC free article] [PubMed] [Google Scholar]
- Muthen B, Asparouhov T, Boye M, Hackshaw M, Naegeli A. Applications of continuous-time survival in latent variable models for the analysis of oncology randomized clinical trial data using Mplus. Los Angeles, CA: Muthen & Muthen; 2009. (Technical Report). Retrieved from http://www.statmodel.com/download/lily-FinalReportV6.pdf. [Google Scholar]
- Muthén LK, Muthén BO. Mplus user’s guide. 7th. Los Angeles, CA: Muthén & Muthén; 1998–2012. [Google Scholar]
- Nagelkerke N. A note on a general definition of the coefficient of determination. Biometrika. 1991;78:691–692. doi: 10.2307/2337038. [DOI] [Google Scholar]
- Niklasson J, Hörnsten C, Conradsson M, Nyqvist F, Olofsson B, Lövheim H, Gustafson Y. High morale is associated with increased survival in the very old. Age and Ageing. 2015;44:630–636. doi: 10.1093/ageing/afv021. [DOI] [PubMed] [Google Scholar]
- Onawola RST, Laveist TA. Subjective health status as a determinant of mortality among African-American elders. Journal of the National Medical Association. 1998;90:754–758. [PMC free article] [PubMed] [Google Scholar]
- Palgi Y, Shrira A, Ben-Ezra M, Spalter T, Shmotkin D, Kave G. Delineating terminal change in subjective well-being and subjective health. Journals of Gerontology. Series B, Psychological Sciences and Social Sciences. 2010;65B:61–64. doi: 10.1093/geronb/gbp095. [DOI] [PMC free article] [PubMed] [Google Scholar]
- Sabia S, Dumurgier J, Tavernier B, Head J, Tzourio C, Elbaz A. Change in fast walking speed preceding death: Results from a prospective longitudinal cohort study. Journals of Gerontology: Medical Sciences. 2014;69:354–356. doi: 10.1093/gerona/glt114. [DOI] [PMC free article] [PubMed] [Google Scholar]
- Sargent-Cox KA, Anstey KJ, Luszcz MA. Longitudinal change of self-perceptions of aging and mortality. The Journals of Gerontology Series B: Psychological Sciences and Social Sciences. 2014;69:168–173. doi: 10.1093/geronb/gbt005. [DOI] [PMC free article] [PubMed] [Google Scholar]
- Schilling OK. Cohort- and age-related decline in elder’s life satisfaction: Is there really a paradox? European Journal of Ageing. 2005;2:254–263. doi: 10.1007/s10433-005-0016-7. [DOI] [PMC free article] [PubMed] [Google Scholar]
- Schilling OK, Wahl HW, Wiegering S. Affective development in advanced old age: Analyses of terminal change in positive and negative affect. Developmental Psychology. 2013;49:1011–1020. doi: 10.1037/a0028775. [DOI] [PubMed] [Google Scholar]
- Sugisawa H, Liang J, Liu X. Social networks, social support, and mortality among older people in Japan. Journal of Gerontology. 1994;49:3–13. doi: 10.1093/geronj/49.1.S3. [DOI] [PubMed] [Google Scholar]
- Vogel N, Gerstorf D, Ram N, Goebel J, Wagner GG. Terminal decline in well-being differs between residents in East Germany and West Germany. International Journal of Behavioral Development. 2015 doi: 10.1177/0165025415602561. [DOI] [Google Scholar]
- Vogel N, Schilling OK, Wahl HW, Beekman ATF, Penninx BWJH. Time-to-death–related change in positive and negative affect among older adults approaching the end of life. Psychology and Aging. 2013;28:128–141. doi: 10.1037/a0030471. [DOI] [PubMed] [Google Scholar]
- Wagner GG, Frick JR, Schupp J. The German Socio-Economic Panel Study (SOEP)—Scope, evolution and enhancements. Schmollers Jahrbuch. 2007;127:139–169. [Google Scholar]
- Windsor TD, Gerstorf D, Luszcz MA. Social resource correlates of levels and time-to-death related changes in late-life affect. Psychology and Aging. 2015;30:136–148. doi: 10.1037/a0038757. [DOI] [PMC free article] [PubMed] [Google Scholar]
- Wolinsky F, Bentler SE, Liu L, Geweke JF, Cook EA, Wallace RB. Continuity of care with a primary care physician and mortality in older adults. The Journals of Gerontology, Series A: Medical Sciences. 2010;65A:421–428. doi: 10.1093/gerona/glp188. [DOI] [PMC free article] [PubMed] [Google Scholar]
- Wurm S, Tomasik MJ, Tesch-Römer C. Serious health events and their impact on changes in subjective health and life satisfaction: The role of age and a positive view on ageing. European Journal of Ageing. 2008;5:117–127. doi: 10.1007/s10433-008-0077-5. [DOI] [PMC free article] [PubMed] [Google Scholar]
- Xu J, Roberts RE. The power of positive emotions: It’s a matter of life or death—subjective well-being and longevity over 28 years in a general population. Health Psychology. 2010;29:9–19. doi: 10.1037/a0016767. [DOI] [PubMed] [Google Scholar]
- Yan L, Sun Y, Boivin MR, Kwon PO, Li Y. Revealing facts and avoiding biases: A review of several common biases in statistical analyses of epidemiological data. Frontiers in Public Health. 2016;4:207. doi: 10.3389/fpubh.2016.00207. [DOI] [PMC free article] [PubMed] [Google Scholar]
- Zaninotto P, Wardle J, Steptoe A. Sustained enjoyment of life and mortality at higher ages: Analysis of the English Longitudinal Study of Ageing. BMJ. 2016;355:i6267. doi: 10.1136/bmj.i6267. [DOI] [PMC free article] [PubMed] [Google Scholar]