Figure 1.
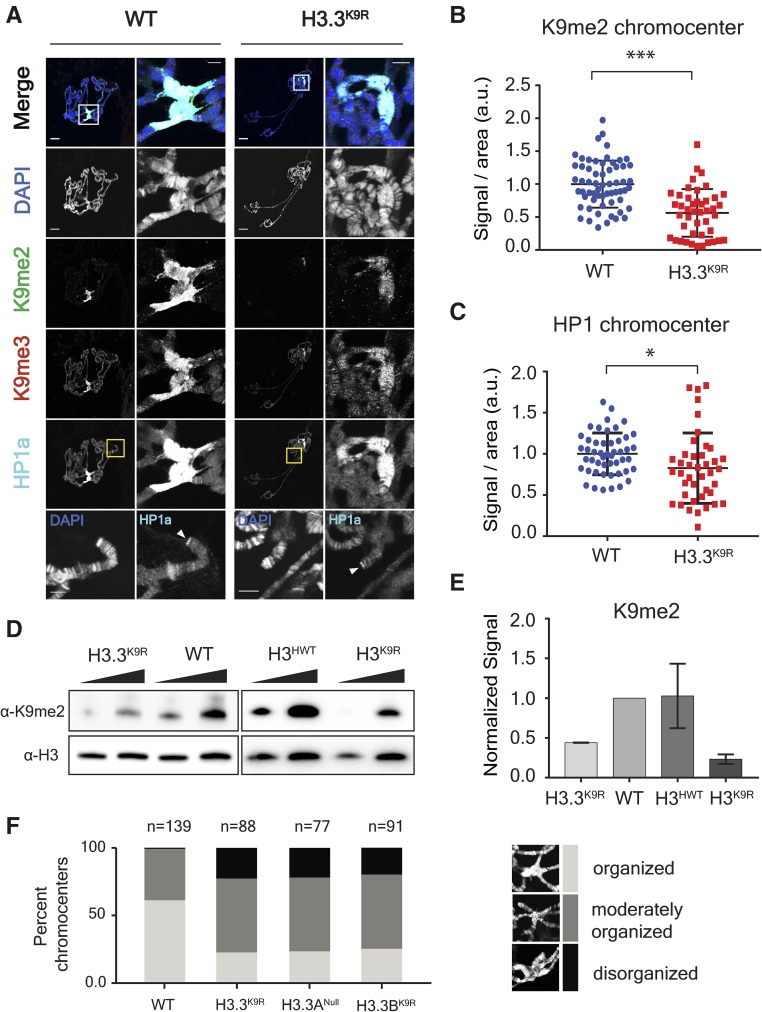
K9me2/me3 and HP1a signal is decreased in H3.3K9R mutants. (A) Third instar larval salivary gland polytene chromosome spreads from wild-type (left) and H3.3K9R mutants (right) stained with anti-K9me2, anti-K9me3, anti-HP1a, and DAPI to mark DNA. Right panel for each genotype shows enlarged chromocenter indicated by white boxes. Bottom panel shows magnified view of telomere indicated by yellow boxes. Bars, 20 μm (whole polytene) and 5 microns (chromocenter/telomere). (B and C) Immunofluorescent signal of K9me2 (B) or HP1a (C) at chromocenters in wild-type (WT) and H3.3K9R mutants (a.u., arbitrary units). Values were normalized to area of the chromocenter and set relative to the average WT value from matched slides (see File S2). Significance was determined using the Student’s t-test (* P < 0.05, ** P < 0.005, and *** P < 0.0005). (D) Western blot of K9me2 from salivary glands with H3 used as loading control. (E) K9me2 signal was quantified by densitometry and normalized to corresponding H3 loading control band. Normalized values were set relative to WT normalized signal. Error bars represent SEM from two independent biological replicates (see Materials and Methods). (F) Quantification of chromocenter organization from WT, H3.3K9R, H3.3ANull, and H3.3BK9R mutants.

