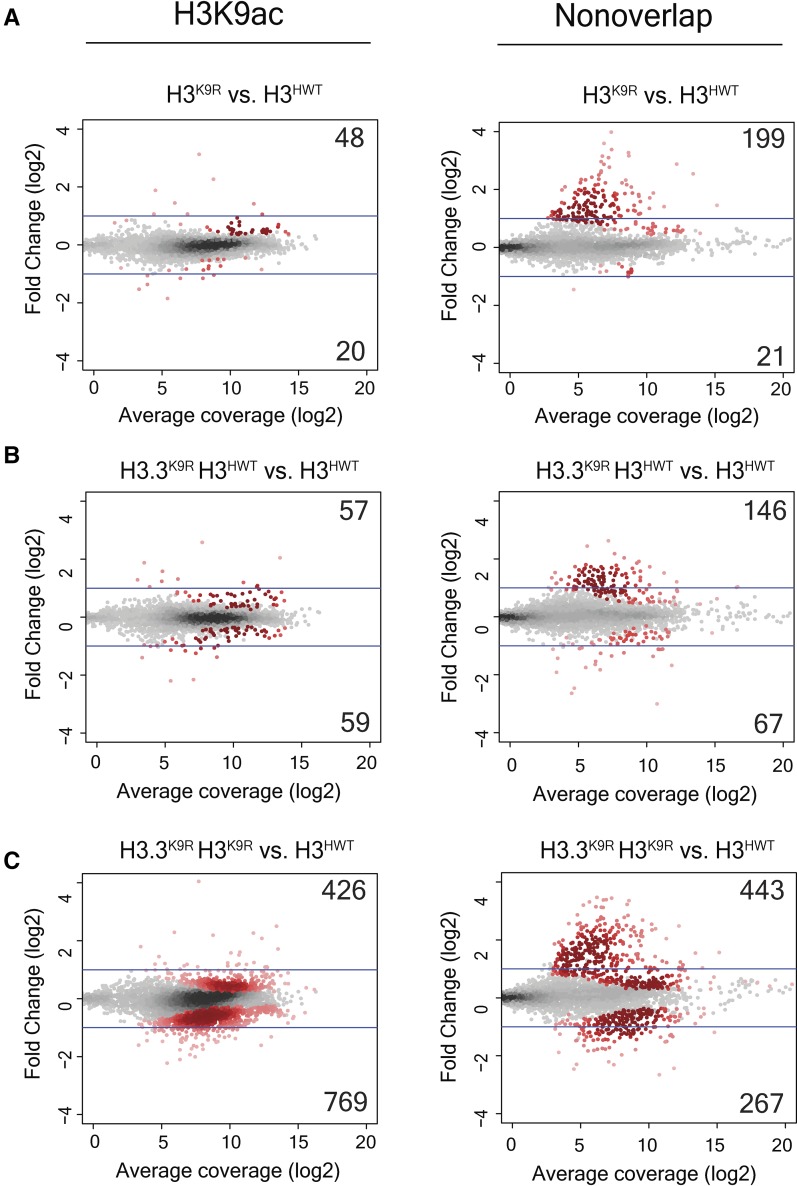
Figure 8.
K9ac-associated transcripts are altered in H3.3K9R H3K9R double mutants. MA (M (log ratio) A (mean average)) plot showing fold change of normalized RNA signal in H3K9R (A), H3.3K9R H3HWT (B), and H3.3K9R H3K9R (C) mutants vs. H3HWT at all transcripts from merged transcriptome. Average coverage on x-axis represents the mean expression level of a transcript. Transcripts that overlap a K9ac peak called from chromatin immunoprecipitation sequencing data (GSM1363590; Pérez-Lluch et al. 2015) are shown in the left panel, while those that do not are shown in the right panel. Significance (shown in red) was determined using DESeq2 (Love et al. 2014) and an adjusted P-value cutoff of 0.05.

