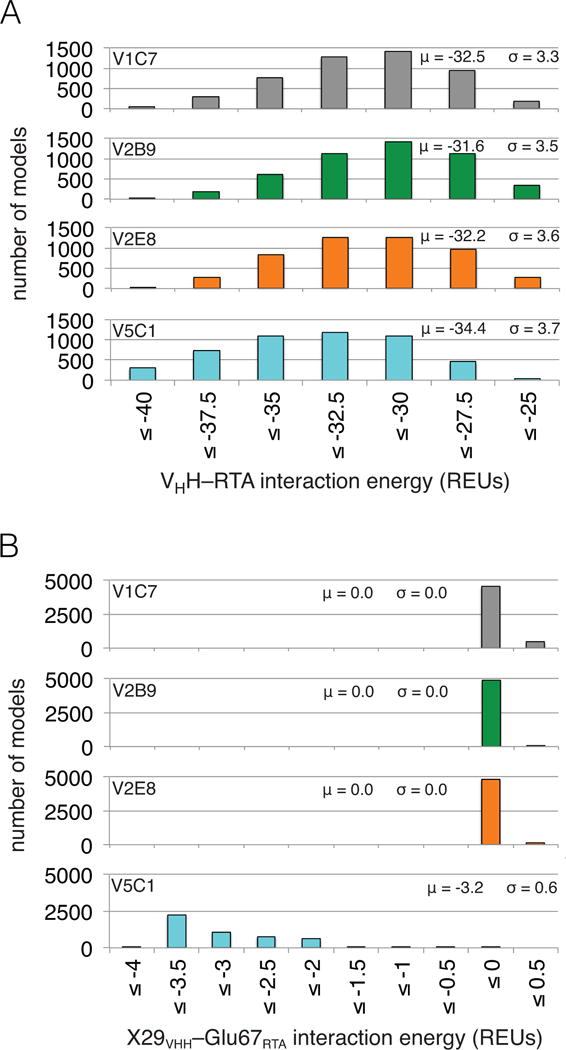
Figure 4. Computational modeling predicts V5C1 to have the highest RTA binding affinity due to Gly29Arg substitution.

(Panel A) Distributions of VHH–RTA interaction energy over ensembles of 5,000 computational models (μ: average; σ: standard deviation). The V5C1 models have lower interaction energies than the models of any other VHH, by an average margin of 1.9 REUs or more. (Panel B) Distributions of X29VHH–Glu67RTA interaction energy (X = Gly for V1C7, V2B9, and V2E8; X = Arg for V5C1) over the ensembles of models. While the Arg29V5C1–Glu67RTA interaction is favorable (−3.2 REUs on average), the Gly29VHH–Glu67RTA interaction is essentially absent (0.0 REUs on average).
