

SUMMARY
Microglia play critical roles in tissue homeostasis and can also modulate neuronal function and synaptic connectivity. In contrast to astrocytes and oligodendrocytes, which arise from multiple progenitor pools, microglia arise from yolk sac progenitors and are widely considered to be equivalent throughout the CNS. However, little is known about basic properties of deep brain microglia, such as those within the basal ganglia (BG). Here, we show that microglial anatomical features, lysosome content, membrane properties, and transcriptomes differ significantly across BG nuclei. Region-specific phenotypes of BG microglia emerged during the second postnatal week and were re-established following genetic or pharmacological microglial ablation and repopulation in the adult, indicating that local cues play an ongoing role in shaping microglial diversity. These findings demonstrate that microglia in the healthy brain exhibit a spectrum of distinct functional states and provide a critical foundation for defining microglial contributions to BG circuit function.
Keywords: microglia, nucleus accumbens, ventral tegmental area, substantia nigra, density, morphology, electrophysiology, RNA sequencing, heterogeneity, development
eTOC BLURB
De Biase et. al show that microglia in different basal ganglia nuclei exhibit region-specific phenotypes, with distinct anatomical features, lysosome content, membrane properties and transcriptomes. Local regulatory cues guide establishment and maintenance of this regional specialization.
INTRODUCTION
Microglia are small, stellate-shaped glial cells that play central roles in tissue homeostasis and respond to numerous CNS insults with rapid changes in cell morphology, phagocytotic activity, and release of cytotoxic and neuroprotective signaling factors (Hanisch and Kettenmann, 2007; Ransohoff and Perry, 2009). In addition, recent findings indicate that microglia can modulate neuronal membrane properties and synaptic connectivity through release of soluble signaling factors (Ferrini et al., 2013; Parkhurst et al., 2013; Lewitus et al., 2016) or physical interaction with synaptic elements (Tremblay et al., 2010; Schafer et al., 2012; Hong et al., 2016; Sipe et al., 2016). The ubiquitous distribution of microglia and their involvement in immune surveillance has supported a general assumption that these cells are equivalent throughout the CNS. Developmental origins of microglia also appear more homogenous than other glial cell populations; neuroectoderm-derived astrocytes and oligodendrocyte lineage cells arise from multiple progenitor pools along the dorsal ventral axis that confer distinct functional attributes to their progeny (Bayraktar et al., 2015; Bergles and Richardson, 2016; Crawford et al., 2016). In contrast, microglia are derived from yolk sac primitive macrophage progenitors that invade and colonize the developing CNS (Ginhoux and Prinz, 2015). Nonetheless, gene expression analyses and immunohistochemical studies suggest the presence of heterogeneity within the mature microglial population (Lawson et al., 1990; de Haas et al., 2008; Sharaf et al., 2013; Yang et al., 2013; Grabert et al., 2016). Limited information is available about deep brain microglia, such as those that populate the basal ganglia (BG), and dorsal-ventral differences in phenotype analogous to those observed in other glial cell populations have not been reported (Ginhoux et al., 2013; Zuchero and Barres, 2015; Reemst et al., 2016).
The BG are functionally intertwined, deep brain nuclei that play critical roles in regulating movement, motivation, reinforcement, and key forms of learning (Graybiel, 2008; Nelson and Kreitzer, 2014). BG input nuclei, the dorsal and ventral striatum (nucleus accumbens, NAc), integrate information about sensory cues with information about expectations and value conveyed by dopaminergic neurons residing within the ventral tegmental area (VTA) and substantia nigra pars compacta (SNc). Efferent striatal projections then directly, or indirectly, alter activity within major BG output nuclei, such as the substantia nigra pars reticulata (SNr), to regulate behavior. BG neurons exhibit particularly resilient changes in synaptic strength following exposure to drugs of abuse (Kauer and Malenka, 2007), and BG nuclei show susceptibility to multiple degenerative conditions (Huntington’s disease, Parkinson’s disease, neurodegeneration with brain iron accumulation, and Fahr disease), to toxic poisoning (carbon monoxide, methanol, and cyanide) and to focal inflammatory conditions (neuro-Behcet disease, flavivirus infection, toxoplasmosis, and HIV-infection) (Albin, 2000; Berger and Arendt, 2000; Hegde et al., 2011; Mufaddel and Al-Hassani, 2014). Prominent alterations in BG microglia have been documented during injury and disease (Joers et al., 2016). However, little is known about the basal features of these cells, their contributions to physiological BG functioning, and whether differences between BG microglia and more extensively studied hippocampal and cortical counterparts influence susceptibility to pathological perturbations.
RESULTS
BG microglial density and process branching vary significantly and microglial cell numbers correlate with local abundance of astrocytes
To begin defining basic properties of BG microglia, cell density was examined in transgenic mice expressing EGFP under control of the endogenous fractalkine receptor promoter (CX3CR1EGFP/+ mice). In young adult (postnatal day 58–60) CX3CR1EGFP/+ mice, microglial density varied significantly across the BG from a low of 262 ± 10 cells/mm2 in the VTA to a high of 723 ± 12 cells/mm2 in the adjacent SNr (Fig. 1A–D). Only NAc displayed microglial density (380 ± 7 cells/mm2) comparable to that in cortex and hippocampus (Lawson et al., 1990).
Figure 1. Microglial density varies significantly across basal ganglia (BG) nuclei and correlates with local abundance of astrocytes.

A – Coronal brain sections from P60 CX3CR1EGFP/+ mouse immunostained for tyrosine hydroxylase (TH), which labels dopamine neuron somas and projections. Yellow boxes indicate location of analyzed images. NAc = nucleus accumbens, VTA = ventral tegmental area, SNc = substantia nigra pars compacta, SNr = substantia nigra pars reticulata. B, C –Overlap between microglial marker Iba1 and EGFP in CX3CR1EGFP/+ mice; image from NAc. D – Distribution and density of EGFP+ BG microglia. ANOVA, F(3,17) = 508, P < 0.00001. N = 4–6 mice per region. E – Distribution and density of BG oligodendrocyte precursor cells (OPCs) immunostained for NG2. ANOVA F(3,20) = 0.14, P = 0.93 (n.s.). N = 6 mice per region. F – Distribution and density of BG neurons immunostained for NeuN. ANOVA F(3,8) = 108.8, P < 0.00001. N = 3 mice per region. G – Distribution and density of BG astrocytes in Aldh1l1-EGFP mice. ANOVA F(3,8) = 38.4, P = 0.00005. N = 3 mice per region. H – Left, ratio of EGFP+ microglia to NG2+ OPCs (ANOVA F(3,20) = 41.5, P < 0.00001); Middle, ratio of EGFP+ microglia to NeuN+ neurons (ANOVA F(3,8) = 33.9, P = 0.00007); Right, ratio of Iba1+ microglia to EGFP+ astrocytes (ANOVA F(3,8) = 1.7, P = 0.25, n.s.). Dashed yellow lines indicate SNc boundary. All mice were age P58–60. # P < 0.05 vs. NAc, ● P < 0.05 vs. VTA, † P < 0.05 vs. SNc, ¥ P < 0.05 vs. SNr, * P < 0.002 all individual comparisons.
We then examined numerical relationships between microglia and other major BG cell populations. Density of oligodendrocyte precursor cells (OPCs, NG2+ cells) was comparable across BG nuclei (Fig. 1E), suggesting that independent factors regulate abundance of BG microglia and OPCs. The density of neurons and astrocytes varied significantly across BG nuclei (Fig. 1F,G), and regional variation in BG astrocyte density closely resembled that of microglia. Indeed, while the ratio of microglia to OPCs and microglia to neurons varied significantly across BG nuclei, the ratio of microglia to astrocytes was consistent (Fig. 1H), suggesting that similar, undefined factors regulate density of these cells within the BG.
Microglia possess highly-ramified processes that continually survey the surrounding brain tissue (Davalos et al., 2005; Nimmerjahn et al., 2005; Tremblay et al., 2010). To further define basic properties of BG microglia, cell morphology was examined in high-magnification images from young adult CX3CR1EGFP/+ mice. NAc and SNr microglia exhibited complex process structure, while VTA and SNc microglia were sparsely branched and displayed significantly reduced tissue coverage (Fig. 2A,B and Fig. S1A). Three-dimensional reconstruction of individual cells revealed that NAc microglia possess greater total process length and number of branch points than other BG microglia (Fig. 3C–E and Fig. S1B). Although NAc and SNr microglia exhibited a similar degree of process complexity as measured by 3D Scholl analysis, NAc microglial processes extended further from the cell soma (Fig. 3F,G).
Figure 2. Microglia in distinct BG nuclei exhibit unique branching structure.
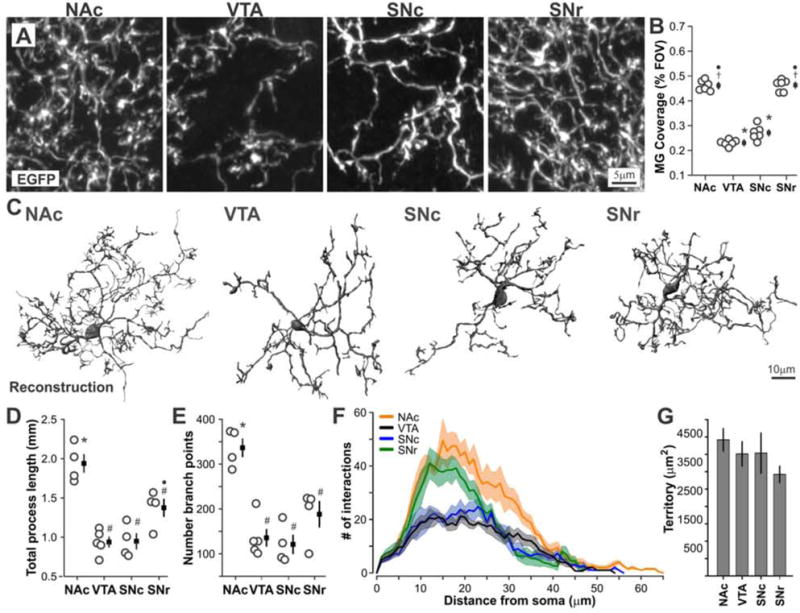
A – Confocal images of BG microglial branching structure. B – Microglial tissue coverage (% field of view occupied by microglial processes and somas). ANOVA F(3,20) = 184.6, P < 0.00001. N = 6 mice per region. See also Fig. S1A. C – 3D reconstruction of individual microglia (raw images in Fig. S1B). D – Total process length of reconstructed cells. ANOVA F(3,13) = 21.7, P = 0.00003. N = 4–5 cells per region, each cell from different mouse. E – Number of branch points. ANOVA F(3,13) = 17.7, P < 0.00008. F – 3D Scholl analysis showing mean ± standard error (shaded) for all reconstructed cells. G – Approximate territory of reconstructed cells. ANOVA F(3,13) = 1.05, P = 0.40 (n.s.). All mice were age P58–60. # P < 0.05 vs. NAc, ● P < 0.05 vs. VTA, † P < 0.05 vs. SNc, ¥ P < 0.05 vs. SNr. * P < 0.05 all individual comparisons.
Figure 3. VTA microglia exhibit reduced and SNr microglia exhibit elevated lysosome content relative to other BG microglia.
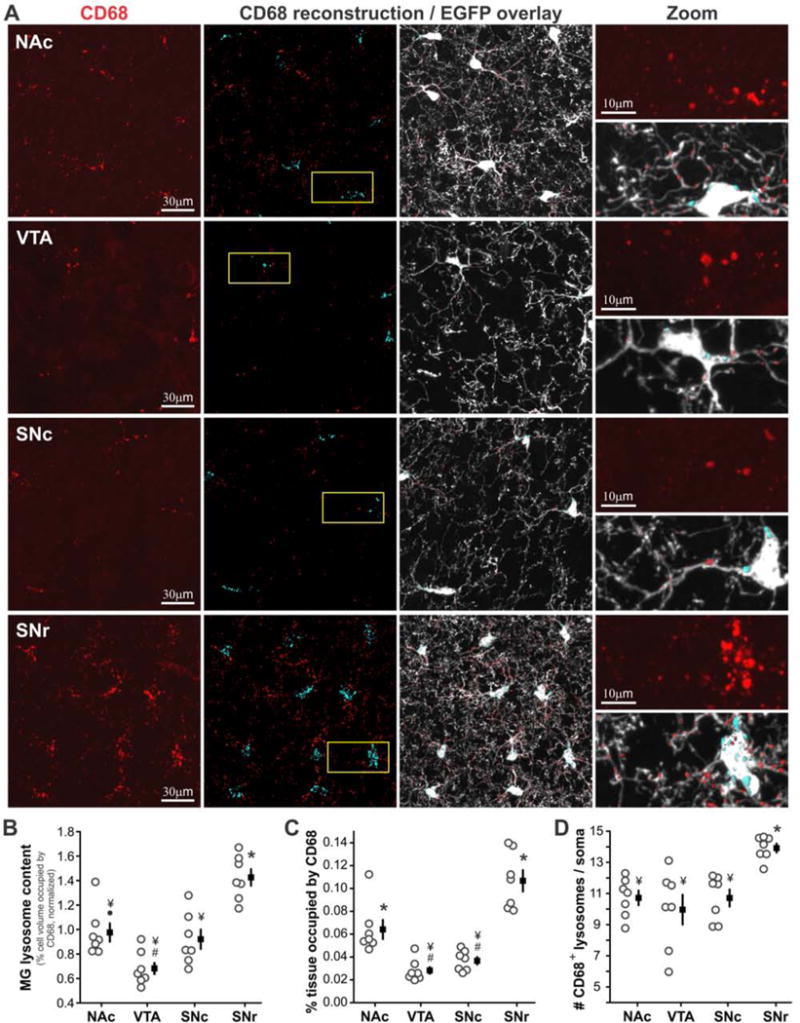
A – Left panel – immunostaining for microglial lysosome membrane protein CD68. Middle panels – 3D reconstruction of CD68+ lysosomes alone and with EGFP overlay; cyan = somatic and red = cell process lysosomes. Right panel – higher magnification of regions identified by yellow boxes. B – Percent volume of microglial cells occupied by CD68+ lysosomes; normalized to BG-wide average as shown in Fig. S1C. ANOVA F(3,24) = 19.8, P < 0.00001. C – Overall tissue content of CD68+ lysosomes. ANOVA F(3,24) = 27.4, P < 0.00001. D – Average number of CD68+ lysosomes per microglial soma. ANOVA F(3,24) = 8.1, P = 0.0007. N = 7 mice per region. All mice were age P58–60. # P < 0.05 vs. NAc, ● P < 0.05 vs. VTA, † P < 0.05 vs. SNc, ¥ P < 0.05 vs. SNr, * P < 0.02 all individual comparisons. See also Fig. S1 C–F.
Microglial lysosome content and distribution varies across BG nuclei
Following pathological insults, microglia undergo shifts in functional state that include altered proliferation, process branching, and phagocytotic activity (Hanisch and Kettenmann, 2007; Ransohoff and Perry, 2009). The anatomical findings described above suggest that BG microglia exhibit regional variation in functional state even in the absence of pathology. To explore this possibility, we examined the abundance and distribution of microglial lysosomes (Fig. 3A). Three-dimensional reconstruction of EGFP+ microglia and CD68+ lysosomes from confocal images revealed that lysosomes occupy a significantly higher percent volume of SNr microglia as compared to nearby VTA microglia (Fig. S1C). When normalization was applied to account for subtle mouse-to-mouse differences in overall CD68 abundance, microglial lysosome content differed significantly across all BG nuclei except NAc vs. SNc and VTA vs. SNc (Fig. 3B). These regional differences in microglial lysosome content are accentuated by variation in microglial density, resulting in pronounced differences in total tissue content of microglial lysosomes (Fig. 3C). SNr microglia also exhibited significantly more somatic lysosomes than other BG microglia, despite having a similar soma volume (Fig. 3A,D and Fig. S1E,F). Together, these observations suggest that microglia in distinct BG nuclei differ in their phagocytotic activity or metabolic state (Appelqvist et al., 2013).
SNr microglia exhibit unique membrane properties compared to VTA and SNc microglia
Shifts in microglial proliferation, motility, and release of inflammatory signaling factors following pathological insults, or during early postnatal development, are associated with alterations in electrophysiological properties of these cells (Boucsein et al., 2000; Lyons et al., 2000; Avignone et al., 2008; Kettenmann et al., 2011; Arnoux et al., 2013). To further define variation in BG microglial functional states, we performed whole cell patch clamp recordings of BG microglia in the immediately adjacent VTA, SNc, and SNr, where the most significant differences in cell density, process complexity, and lysosome content were observed. VTA and SNc microglia exhibited resting potentials similar to those reported for cortical microglia (Boucsein et al., 2000; Boucsein et al., 2003)(Fig. S2A). In contrast, SNr microglia displayed significantly more hyperpolarized resting potentials and larger membrane capacitance (Fig. S2A,B).
To test for voltage-activated conductances, responses to hyperpolarizing and depolarizing current injection were recorded. While VTA and SNc microglia responded with passive alterations in membrane potential, the majority of SNr microglia (17 of 28 cells, 61%) showed evidence of voltage-activated conductances upon depolarization beyond −25 ± 1 mV (Fig. 4A). Similarly, when cells were held at −70 mV and stepped to holding potentials ranging from −120 to 10 mV, VTA and SNc microglia exhibited passive responses and the majority of SNr microglia (24 of 37 cells, 65%) displayed voltage-activated currents upon stepping to depolarized potentials beyond −19 ± 2 mV (Fig. 4B). Accordingly, SNr microglia have a non-linear current-voltage relationship as compared to VTA and SNc microglia, which is accentuated when SNr microglia are subdivided into cells that did or did not exhibit voltage-activated currents (Fig. 4C). These currents resemble delayed rectifier potassium currents observed in early postnatal or injury-responsive microglia (Boucsein et al., 2000; Lyons et al., 2000; Avignone et al., 2008; Arnoux et al., 2013). Indeed, SNr voltage-activated conductances were inactivated if cells were held at −20 mV (Fig. 4D and Fig. S2D) and were sensitive to bath application of TEA and 4-AP (Fig. 4E–F), indicating that these currents are mediated by voltage-gated potassium (Kv) channels.
Figure 4. Microglia in adjacent BG nuclei exhibit distinct membrane properties.
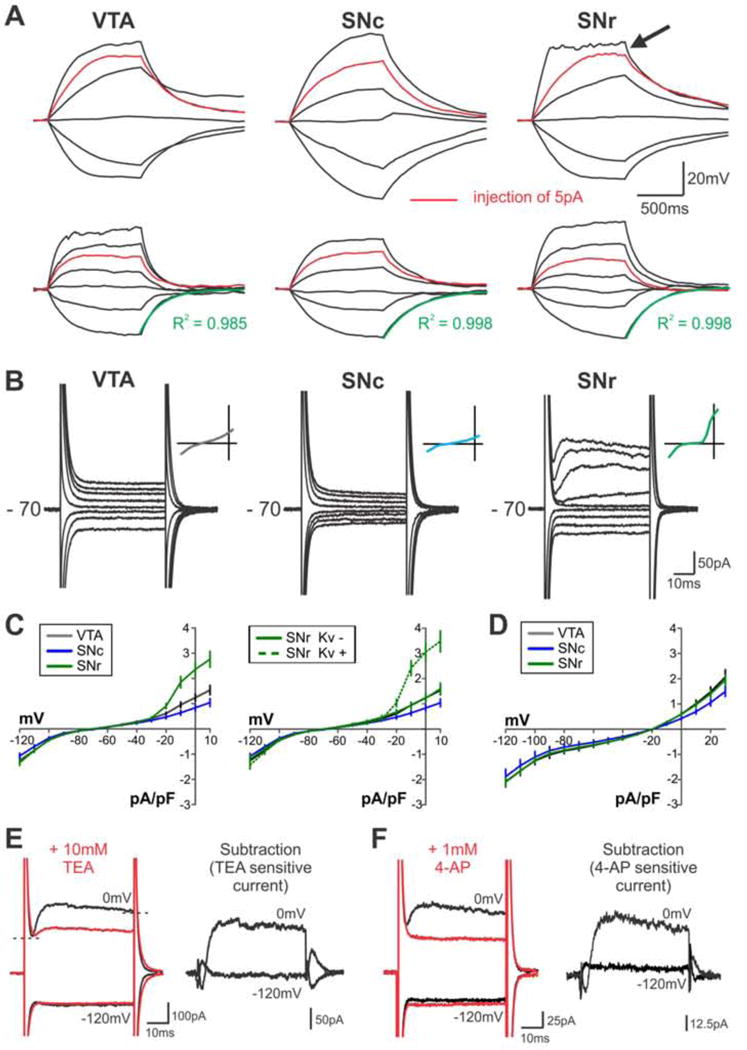
A – Responses of 2 representative microglia per region to hyperpolarizing and depolarizing current injection. Black arrow highlights evidence of voltage-activated conductances. Green overlay = single exponential fit to calculate tau decay/input resistance (see Fig. S2C). B – Responses of representative BG microglia stepped to holding potentials from −120 mV to +10 mV. Initial holding potential = −70 mV. Inset shows current-voltage (I–V) relationship. C – Average I–V curves from all recorded cells (VTA, N = 33 cells; SNc, N = 15 cells; SNr, N = 37 cells); initial holding potential −70 mV. Right panel shows I–V curves when SNr microglia are split into cells displaying (Kv +) or lacking (Kv -) voltage-activated conductances. 3/33 VTA microglia (9%), 0/15 SNc microglia (0%), and 24/37 SNr microglia (65%) were Kv+. D – Average I–V curves from all recorded microglia; initial holding potential −20 mV. E,F – Reduction of voltage-activated conductances recorded from representative SNr microglia (black traces) by bath application of 10 mM TEA or 1 mM 4-AP (red traces) (TEA: t(6) = 2.5, P = 0.03, N = 7 cells; 4-AP: t(4) = 2.9, P = 0.03, N = 5 cells; paired T-test, one-tailed); initial holding potential −70 mV. TEA- and 4-AP sensitive currents (response before – response after antagonist application) shown at right. Brain slices for all recordings prepared from mice age P35–45. See also Fig. S2.
These data represent the first report of regional heterogeneity in membrane properties of microglia and support the conclusion that functional states of microglia in distinct BG nuclei differ from one another and from cortical and hippocampal counterparts. No correlation was observed between recorded membrane properties and the amount of time elapsed since brain slice preparation (Fig. S2F–H). In addition, microglia filled with biocytin during recording exhibited ramified morphology comparable to that reported previously (Boucsein et al., 2000; Boucsein et al., 2003) (Fig. S2I), arguing that these observations reflect intrinsic membrane properties of BG microglia.
VTA microglial transcriptome differs prominently from that of other BG and Ctx microglia
As a final approach to define basic properties of BG microglia, and to determine the degree to which these cells differ from one another and from cortical counterparts, we developed a novel microglial purification and RNA sequencing workflow and generated whole transcriptome data from NAc, VTA, substantia nigra (SN; containing predominantly SNr), and cortex (Ctx) microglia of individual, young adult CX3CR1EGFP/+ mice (Fig. 5A, Fig. S3, and Table S1).
Figure 5. Generation of whole transcriptome RNAseq data from microglia of distinct BG nuclei.
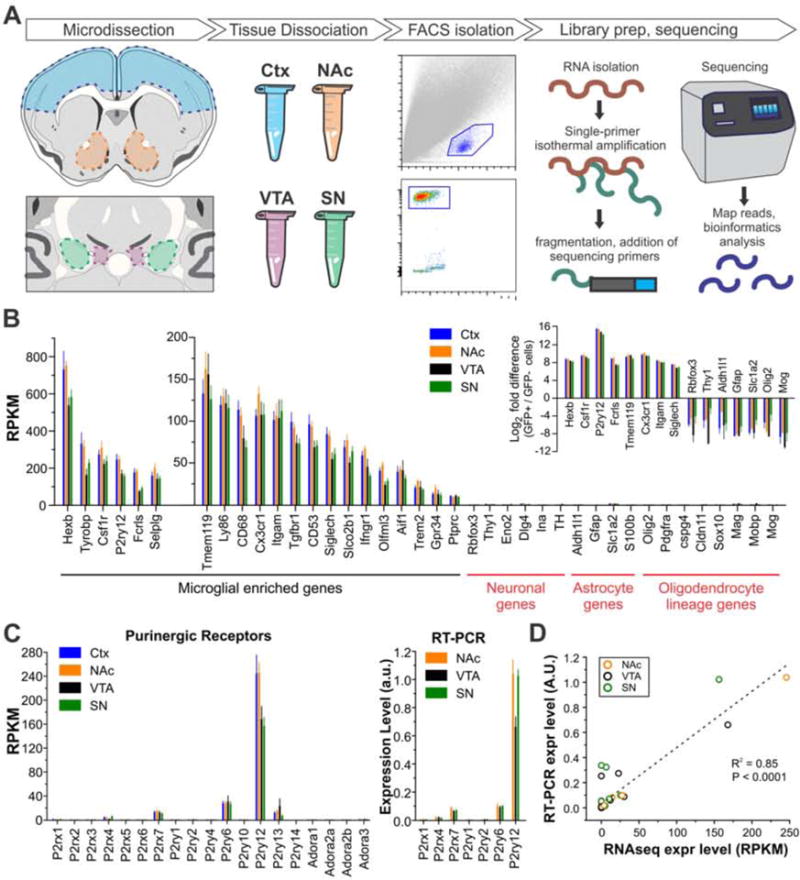
A – Diagram illustrating RNAseq workflow. B – Expression levels for microglial-, neuron-, astrocyte-, and oligodendrocyte lineage-enriched genes. Inset shows fold change of cell-specific genes in EGFP+ compared to EGFP− cells. N = 6 – 8 samples per group; each sample represents data of microglia isolated from the BG nucleus of an individual mouse. C – Left, expression of ionotropic and metabotropic purinergic receptors as assessed by RNAseq; Right, expression of purinergic receptor subset as assessed by RT-PCR. D – Comparison of gene expression levels measured by RNAseq (mean RPKM, N = 6–8 samples per region) with levels measured by RT-PCR in samples prepared from an independent cohort of mice (average expression value, N = 5 samples per region; each sample represents data from microglia isolated from the BG nucleus of an individual mouse). Linear regression R2 = 0.85, P < 0.0001. Data from individual target genes shown in Fig. 5C and Fig. S4 A,B. N = 17 target genes. See also Figs. S3–4.
In our dataset, well-known and recently identified microglial-enriched genes (Chiu et al., 2013; Hickman et al., 2013; Butovsky et al., 2014; Zhang et al., 2014) were expressed at high levels in microglia from all analyzed regions (Fig. 5B). In contrast, neuron-specific, astrocyte-specific, and oligodendrocyte lineage-specific genes were not expressed above the level of noise. RT-PCR analysis of genes coding for purinergic receptors, inflammatory signaling and trophic factors, and voltage-gated potassium channels in microglia isolated from independent cohorts of animals indicated strong agreement between levels of gene expression reported by RNAseq and by RT-PCR (R2 = 0.85, Fig. 5C,D and Fig. S4A,B). In addition, gene expression patterns from our Ctx microglia showed a high degree of overlap with previously published RNAseq data from cortical microglia (Zhang et al., 2014)(Fig. S4C).
To quantify regional differences in BG microglial transcriptome, we first calculated the amount of overlap in which genes are expressed by microglia from each region (Fig. 6A). Ctx and NAc microglia showed the greatest degree of overlap in expressed genes (84.3%), while VTA microglia consistently showed the lowest degree of overlap with all other groups (56.4 – 60.0%). Similar results were obtained regardless of specific filtering criteria used to define expressed genes (Fig. 6A and Fig. S5). Statistical analysis to identify differentially expressed genes also revealed similar trends, with comparisons between Ctx and NAc microglia showing small numbers of significantly up- or down-regulated genes (0.4 % of expressed genes; Fig. 6B and Fig. S6A,B) and comparisons between VTA microglia and all other microglia yielding large numbers of significantly up- and down-regulated genes (14.0% – 18.3% of expressed genes; Fig. 6B and Fig. S6A,B).
Figure 6. BG and Ctx microglia show substantial variation in expression of genes associated with multiple functional families.
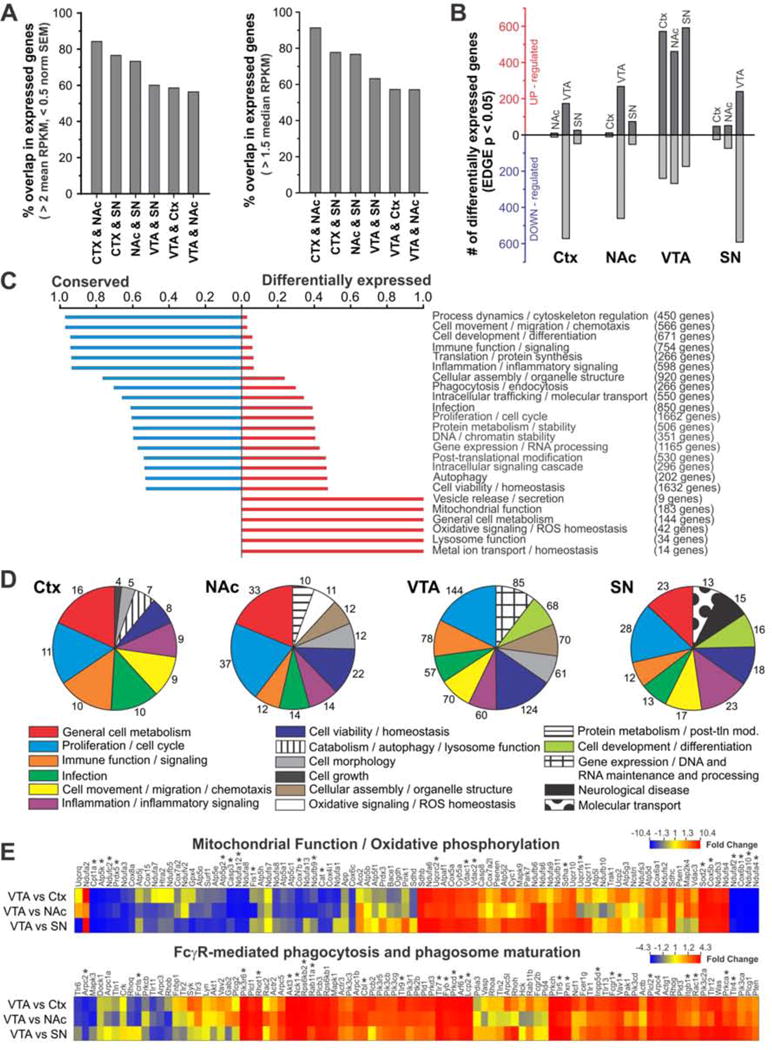
A – Degree of overlap in expressed genes in pairwise comparisons of BG and Ctx microglia using mean RPKM (left) or median RPKM (right) threshold for expression. B – Number of significantly up- and down-regulated genes in pairwise comparisons of BG and Ctx microglia. (EDGE P-value < 0.05; mean RPKM > 2 and norm. SEM < 0.5 in the more highly-expressing region). C – Degree to which genes in particular functional families are “conserved” (expressed by microglia in all regions) or “differentially expressed” (not expressed by microglia in all regions). D –Pie charts showing top 10 functional families in lists of genes that are significantly up-regulated in microglia in that region compared to microglia from at least one other region. Number of genes implicated in each functional family shown at perimeter. E – Key canonical signaling pathways altered in VTA microglia. Heat maps show all detected microglial genes involved in mitochondrial function/oxidative phosphorylation (top), and Fcγ-receptor mediated phagocytosis/phagosome maturation (bottom). Color scale represents fold change for pairwise comparisons listed at left. * Genes found to be significantly up-or down-regulated in VTA microglia compared to microglia from at least one other region. See also Figs. S5–6.
To broadly classify similarities and differences in Ctx and BG microglial gene expression, Ingenuity Pathway Assist (IPA) was used to functionally annotate genes that were expressed by microglia in all four regions (2664 “conserved” genes, 48% of total) and genes that were not expressed by microglia from all four regions (2942 “differentially expressed” genes, 52% of total, Table S2). Comparative analysis of these lists allowed calculation of the degree to which genes associated with particular functional families are conserved or differentially expressed (Fig. 6C). IPA was also used to functionally annotate genes that were significantly up-regulated in microglia from each region, relative to microglia from at least one other region, and these results were displayed as pie charts showing the top 10 functional families in each list (Fig. 6D and Table S3). Together, these analyses showed that genes associated with classical microglial cell processes such as process dynamics/cytoskeletal regulation, inflammation/inflammatory signaling, and immune function/homeostasis tended to be conserved across regions. In contrast, genes involved in mitochondrial function, general cell metabolism, oxidative signaling/ROS homeostasis, and lysosome function were differentially expressed, including notable low expression levels of cell metabolism genes in VTA microglia.
As the VTA microglial transcriptome differed most prominently from that of other BG and Ctx microglia, we carried out further analysis with IPA to identify canonical signaling pathways associated with genes that were significantly up- or down-regulated in VTA microglia. This analysis indicated that numerous genes associated with glycolysis/gluconeogenesis and mitochondrial function/oxidative phosphorylation were down-regulated in VTA microglia. Instead, genes associated with Fcγ-receptor mediated phagocytosis/phagosome maturation, growth factor signaling, and ubiquitination were up-regulated in VTA microglia. Heat maps showing all microglial expressed genes associated with mitochondrial function/oxidative phosphorylation and Fcγ-receptor mediated phagocytosis/phagosome maturation highlight these overall trends toward down-regulation and up-regulation, respectively, in VTA microglia (Fig. 6E). In addition, unsupervised clustering of all microglial samples using genes associated with these canonical pathways is largely capable of clustering VTA samples together, suggesting that the differences in these functional pathways represent prominent distinguishing features of VTA microglia (Fig. S6C,D).
Regional differences in BG microglial phenotype emerge during the second postnatal week
The results described above indicate that microglia in distinct BG nuclei display a surprising degree of variation in anatomical structure and functional state. In pathological contexts, both cell-extrinsic environmental cues as well as epigenetic modifications can shape the reactive responses exhibited by microglia (Ransohoff and Perry, 2009; Garden, 2013). However, the regulatory factors that determine basal microglial phenotype are largely unknown. To determine whether microglia already exhibit regional specialization as they colonize the BG, we examined cell density and branching structure during early postnatal periods in CX3CR1EGFP/+ mice. At P6, EGFP+ cells were present throughout all analyzed nuclei, with no obvious differences in abundance or pattern of tissue distribution (Fig. 7A). In contrast, at P12, regional differences in microglial abundance were readily apparent. Quantitative analysis confirmed that BG microglial density was uniform at P6 (205–259 cells/mm2) and varied significantly at P12, with the same pattern of relative abundance as observed in young adult mice (Fig 7A). At P6, nearly 100% of Iba1+ cells were EGFP+, and at P8, EGFP+Ki67+ cells could be observed (Fig. 7B,C), indicating that increased microglial abundance at P12 is most likely due to cell proliferation and not the presence of immature, EGFP-negative microglia that subsequently begin to express EGFP.
Figure 7. Region specific phenotypes of BG microglia emerge during the second postnatal week.
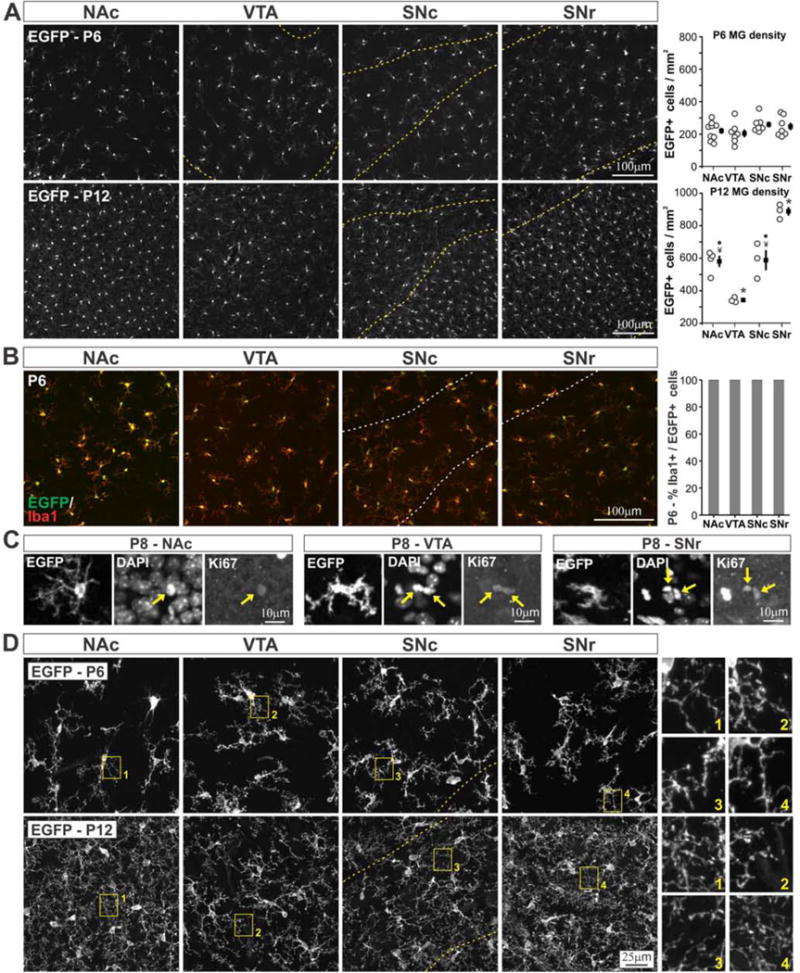
A – Distribution and density of BG microglia at postnatal day 6 (P6) (top, ANOVA F(3,26) = 1.3, P = 0.29, n.s., N = 7–9 mice per region) and P12 (bottom, ANOVA F(3,9) = 31.8, P = 0.00005, N = 3–4 mice per region). Yellow dashed lines indicate boundaries of VTA, SNc, and SNr. ● P < 0.02 vs. VTA, ¥ P < 0.02 vs. SNr, * P < 0.02 all individual comparisons. B – Visualization and quantification of overlap in EGFP and Iba1 expression in P6 BG microglia. White dashed lines indicate boundaries of SNc and SNr. C – Example Ki67+ microglia in NAc, VTA, and SNr of P8 CX3CR1EGFP/+ mice. Yellow arrows indicate DAPI+Ki67+ nuclei corresponding to highlighted EGFP+ microglia. D – High magnification images of BG microglial branching structure in P6 (top) and P12 (bottom) CX3CR1EGFP/+ mice. Yellow boxes highlight regions shown enlarged at right. Dashed yellow lines indicate SNc boundary.
Similar developmental shifts were observed in the fine branching structure of BG microglia. At P6, cell-to-cell variation in soma size, degree of process branching, process thickness, and presence of phagocytotic cups was evident. However, there were no obvious differences in cell structure and branching across BG nuclei (Fig. 7D). By P12, ramification of microglia had increased in all analyzed regions, but VTA and SNc microglia still exhibited comparatively sparse branching, while NAc and SNr microglia displayed heightened branching complexity, consistent with observations in young adult mice (Fig. 7D).
Regional differences in BG microglial phenotype are reestablished following microglial ablation and repopulation in adult mice
In order to establish and maintain BG microglial phenotypes, regulatory cues present during early postnatal development could induce epigenetic modifications that “program” microglia to maintain a particular phenotype. Alternatively, microglial phenotype could be maintained through continual, ongoing input from local cues that are present from early postnatal periods onward. To determine whether local regulatory cues capable of specifying BG microglial phenotype are still present in the adult, we investigated BG microglial features following pharmacological or genetic microglial ablation and repopulation in adult mice.
Microglia could be effectively eliminated from the BG by treating young adult mice with colony stimulating factor receptor 1 (CSF1R) antagonist PLEX5622 (Plexxikon, Inc.) for 2 weeks (PLEX ablated mice, Fig. 8A and Fig. S7A). In mice treated with PLEX5622 for 1 week, EGFP+Iba1+ cells exhibiting membrane blebbing, condensed chromatin, and immunoreactivity for cleaved caspase 3 could be observed (Fig. 8B and Fig. S7B,C), indicating that elimination of EGFP+Iba1+ cells was due to programmed cell death of microglia as previously reported (Elmore et al., 2014). In mice that were given a 21-day repopulation period following cessation of PLEX5622 treatment (PLEX ablated/repopulated mice), EGFP+Iba1+ cells were once again abundant throughout analyzed BG nuclei, similar to repopulation dynamics reported in other brain regions (Elmore et al., 2015). Regional differences in microglial cell abundance and branching were apparent upon visual inspection (Fig. 8A,C and Fig. S7D) and quantification confirmed that repopulated microglia in each BG nucleus exhibited cell densities and tissue coverage closely in line with those of their counterparts in control mice (Fig. 8D,E).
Figure 8. Microglia re-establish region specific phenotypes after ablation and repopulation.
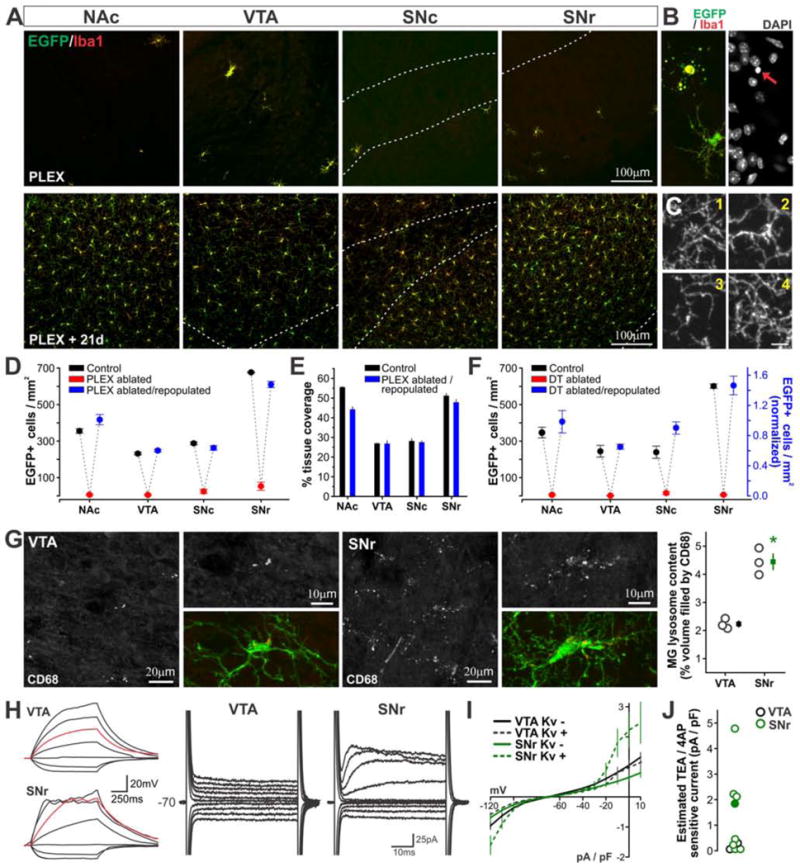
A – Microglial distribution in brain sections from CX3CR1EGFP/+ mice after 2 weeks treatment with CSF1R antagonist PLEX5622 (top panel, PLEX) or 2 weeks of PLEX5622 treatment followed by a 21-day repopulation period (bottom panel, PLEX +21d). Dashed white lines indicate boundaries of VTA, SNc, and SNr. B – Example dying microglial cell in brain sections from CX3CR1EGFP/+ mice after 1 week of PLEX5622 treatment. Red arrow highlights cell’s pyknotic nucleus. C – High magnification images of microglial branching structure in brain sections from PLEX ablated/repopulated mice. 1 – NAc, 2 – VTA, 3 – SNc, 4 – SNr. Scale = 5 μm. D – Microglial density in Control (N = 3 mice), PLEX ablated (N = 4 mice), and PLEX ablated/repopulated mice (N = 3 mice). 2-way ANOVA; main effect of treatment, F(2,28) = 1035, P < 0.00001; main effect of brain region, F(3,28) = 261, P <0.00001; treatment x brain region interaction, F(6,28) = 56, P <0.00001. E – Microglial tissue coverage in Control and PLEX ablated/repopulated mice. 2-way ANOVA; main effect of brain region, F(3,16) = 275, P < 0.00001; main effect of treatment F(1,16) = 25, P = 0.0002; treatment x brain region interaction, F(3,16) = 11, P = 0.0004. F – Microglial density after genetic microglial ablation and repopulation using 4HT-treated CX3CR1CreER-iresEYFP;Rosa fs-DT/fs-DT mice. 2-way ANOVA (performed using raw density values for DT ablated/repopulated mice, Fig. S8F); main effect of treatment, F(2,42) = 119, P < 0.00001; main effect of brain region, F(3,42) = 11, P = 0.00002; treatment x brain region interaction, F(6,42) = 5, P = 0.002. N = 2 control mice, 4–9 ablated mice, 4 DT ablated/repopulated mice. G – Lysosome content of VTA and SNr microglia in brain sections from PLEX ablated/repopulated mice. * P < 0.002 VTA vs. SNr. N = 3 mice. H – Response of representative VTA and SNr microglia to hyperpolarizing and depolarizing current injection (left; red trace = injection of 5pA) or stepping to holding potentials from −120 mV to +10 mV (right). I – Average I–V curves from all recorded cells. 2/9 VTA microglia (22%) and 8/13 SNr microglia (62%) displayed voltage-activated conductances (Kv+). J – Magnitude of Kv currents estimated as in Fig. S2E. Filled circle corresponds to SNr cell shown in H. See also Figs. S7–8.
Similar results were obtained using genetic approaches to ablate BG microglia. Mice expressing inducible Cre-recombinase within microglia (CX3CR1CreER-ires-EYFP/+ mice) were bred to mice expressing “flox-stop” diphtheria toxin (Rosafs-DT/fs-DT mice). In agreement with published studies using this ablation strategy (Parkhurst et al., 2013), 4-hydroxytamoxifen (4HT) treatment in young adult, double transgenic offspring resulted in robust elimination of BG microglia (DT ablated mice, Fig. S8A–C). When 4HT-treated mice were examined at 6 weeks post-ablation (DT ablated/repopulated mice), EYFP+Iba1+ cells were abundant throughout the BG, and regional differences in microglial density and branching complexity were evident (Fig. S8D,E). With this model of genetic microglial ablation and repopulation, greater mouse-to-mouse variability was observed, with some mice showing increased density of repopulated microglia across all BG nuclei relative to control mice (Fig. S8F). However, normalization to a BG-wide density average to account for this variation highlighted that microglial density in DT ablated/repopulated mice followed the same relative pattern across regions as that observed in control mice (Fig. 8F).
Together, these data indicate that local regulatory mechanisms capable of shaping anatomical properties of BG microglia are still present in the adult. To determine whether these regulatory cues can direct specialization of additional BG microglial features, we analyzed lysosome content and membrane properties of VTA and SNr microglia. In PLEX ablated/repopulated mice, CD68-based immunostaining and quantification revealed that repopulated SNr microglia possessed a significantly higher lysosome content than repopulated VTA microglia, consistent with observations in naïve mice (Fig. 8G). In acute brain slices from PLEX ablated/repopulated mice, whole cell patch clamp recordings revealed that a majority of repopulated VTA microglia responded passively to injection of current and stepping to different holding potentials (Fig. 8H–J). Instead, the majority of repopulated SNr microglia (8 of 13 cells, 62%) exhibited evidence of Kv channel activation, consistent with findings in naïve mice.
DISCUSSION
Evidence for diverse functional states of BG microglia
Although variation in microglial phenotype has been extensively studied in the context of pathology, much less is known about microglial heterogeneity in the healthy CNS. In particular, studies using multiple, diverse technical approaches are needed to define the nature and full extent of this heterogeneity.
Our findings demonstrate that, under basal conditions, microglia show greater than 2-fold variation in density and branching complexity across BG nuclei. These regional differences in microglial anatomy are tightly regulated; the stark shift from low density, sparsely-branched VTA/SNc microglia to high density, complex SNr microglia indicates that microglial phenotype is specified to within 10’s of microns. Spatial constraints imposed by tissue architecture do not account for these differences, as shown by the relatively uniform density and branching complexity of OPCs across BG nuclei. Following pathological insults, changes in microglial morphology are accompanied by numerous additional alterations in functional state (Hanisch and Kettenmann, 2007; Ransohoff and Perry, 2009). A fundamental unanswered question is whether regional differences in baseline anatomical features of microglia are accompanied by underlying differences in functional status. Our data indicate that this is indeed the case.
Microglial lysosomes have been analyzed as a marker of phagocytosis and reactivity. However, new findings indicate that lysosomes also play critical roles in supporting cell metabolism, membrane homeostasis, cholesterol signaling, and antigen processing and presentation (Appelqvist et al., 2013; Ferguson, 2015). We found greater than 2-fold variation in BG microglial lysosome content, supporting the conclusion that microglial functional status varies across BG nuclei. The ability of individual lysosomes to process substrates and influence diverse aspects of cell function depends on abundance of lysosomal membrane proteins and matrix proteases, which can vary across cell types and subcellular locations (Brix, 2005; Gowrishankar et al., 2015; Johnson et al., 2016). Analysis of additional lysosomal membrane and matrix proteins will be needed to determine whether regional differences in BG microglial lysosome content are accompanied by differences in lysosome “maturational state.”
Electrophysiological studies of microglia in situ indicate that their membrane properties are correlated with key aspects of functional status such as morphology, motility and cytokine release (Boucsein et al., 2003; Avignone et al., 2008; Arnoux et al., 2013) and that microglia from uninjured cortex and hippocampus do not express voltage-activated conductances. We found that SNr microglia have more hyperpolarized Vrest compared to SNc and VTA microglia, and we detected Kv currents in 65% of SNr microglia but only 3% of VTA and 0% of SNc microglia. Although the precise functional roles of microglial Vrest and voltage-activated conductances have not been defined, these observations provide further direct evidence that SNr microglial functional state differs from that of microglia in immediately adjacent BG nuclei, as well as higher brain structures. The observation that not all SNr microglia express Kv channels indicates that cell-to-cell heterogeneity accompanies the regional differences in microglial phenotype that we describe.
As a final means to evaluate regional differences in BG microglial functional state, we developed a novel workflow for transcriptome sequencing of microglia isolated from distinct BG nuclei. We found many genes expressed at similar levels by BG and Ctx microglia, consistent with the idea that all microglia share a core set of molecular markers and functional duties. However, we also found substantial differences between the transcriptome of midbrain microglia and their cortical counterparts, supporting the conclusion that these cells exhibit region-specific phenotypes and functional states. VTA microglia showed the largest differences in gene expression, implicating multiple functional families, including mitochondrial function, glycolysis, and gluconeogenesis.
Use of multiple technical approaches to interrogate microglial phenotype allows a more complete definition of the nature and extent of microglial heterogeneity, as each approach has distinct advantages and limitations. Analyses of microglial anatomy, lysosome content, and membrane properties provide detailed information about key, specific features of these cells. Instead, whole transcriptome RNAseq analysis offers a more holistic measure of phenotypic variation, indicating which cell populations are most distinct, and illuminating general functional trends of these differences. When combined, these approaches complement one another. For example, direct assessment of functional channels via electrophysiology revealed regional differences in microglial Kv expression that were not detected by RNAseq (Fig. 4 and Fig. S4). (This result is unsurprising given the exquisite sensitivity of electrophysiology, the high input resistance of microglia that could allow a few channels to mediate detectable currents, and the limited sensitivity for detecting the lowest abundance transcripts when performing RNAseq from minimal starting material). Yet, RNAseq analysis revealed that VTA microglia differ more dramatically from NAc and Ctx microglia than their Kv-expressing SN counterparts. Similarly, high-resolution imaging of CD68 immunostaining indicated that SNr microglia have elevated lysosome content (Fig. 3). However, more muted regional differences in expression of genes for lysosome membrane and matrix proteins revealed by RNAseq (Fig. S4) suggests that elevated lysosome content cannot immediately be equated with increased degradative capacity and that functional “maturation” of SNr microglial lysosomes may also differ. Together, these multiple levels of analysis highlight different dimensions of microglial heterogeneity and point the way for follow-up studies targeting specific aspects of phenotypic specialization.
Implications of variable microglial phenotype for BG neuron and circuit function
VTA and SNc microglia exhibit lower cell density, sparse branching, and reduced lysosome content relative to other microglia. VTA microglia (and presumably SNc microglia) show low expression of genes involved in oxidative phosphorylation, glycolysis, and gluconeogenesis, suggesting a comparatively depressed cell metabolism. These observations raise the possibility of more limited microglial tissue surveillance and contribution to tissue homeostasis in these brain regions.
Prominent differences in microglial density may result in variable exposure of BG neurons to microglial-derived inflammatory and trophic signaling factors, which have been shown to impact formation and elimination of dendritic spines (Parkhurst et al., 2013), influence AMPA receptor trafficking (Pribiag and Stellwagen, 2014), and play key roles in responses to pathological insults (Ransohoff and Perry, 2009). Indeed, regional differences in microglial abundance have been proposed to contribute to neuronal susceptibility to Parkinsonian degeneration via elevated inflammatory signaling. However, previous immunohistochemical studies of microglia did not distinguish between SNc/SNr (Lawson et al., 1990; Sharaf et al., 2013; Yang et al., 2013); the vast majority of SN dopamine neurons reside within the SNc (Bjorklund and Dunnett, 2007), adjacent to, not within, a zone of high microglial cell density. This observation suggests that reduced microglial capacity to support tissue homeostasis and lower levels of microglial-derived trophic factors within the VTA/SNc could also contribute to neuronal susceptibility.
Although dopaminergic neurons throughout the midbrain degenerate during Parkinson’s disease, death of SNc dopamine neurons is more pronounced (Gonzalez-Hernandez et al., 2010). Numerous factors, including microglia-neuron interactions, have been proposed to contribute to this differential susceptibility (Long-Smith et al., 2009). We did observe significant differences in density and tissue coverage between SNc and VTA microglia, but these differences were minimal compared to the differences between these microglia and NAc, Ctx, and SNr counterparts. In addition, we did not find significant differences in the lysosome content or membrane properties of VTA and SNc microglia. These observations suggest that baseline differences in the phenotype of SNc and VTA microglia are unlikely to be dominant contributors to initial disease susceptibility of SNc and VTA dopamine neurons.
SNr microglia, in some respects, exhibit a phenotype closer to that of injury-responsive microglia than their BG and cortical counterparts. SNr microglia showed elevated lysosome content, frequent expression of Kv channels, and a perplexingly high cell density. Yet, the SNr boasts relatively few neurons and a small complement of glutamatergic synapses, begging the question of why this nucleus contains so many resident microglia (and astrocytes). The observation that microglia repopulate this nucleus at a similar high density following ablation argues that elevated SNr microglial density is not simply a remnant of functional roles carried out by these cells during development. One distinguishing feature of SNr neurons is their high-frequency, tonic action potential firing (Zhou and Lee, 2011), suggesting that patterns of in vivo neuronal activity could play a role in influencing baseline microglial phenotype.
Establishment of microglial regional specialization
Elegant lineage tracing studies have demonstrated that primitive macrophage progenitors from the yolk sack invade the developing neuroectoderm and give rise to resident CNS microglia (Ginhoux and Prinz, 2015). Throughout late embryogenesis and early postnatal periods, these progenitors and their progeny exhibit a predominantly amoeboid morphology and are clustered in “hotspots” near the pial surface, the subventricular zone, the subplate, and in the developing hippocampus and white matter tracts, where they are believed to contribute to axon outgrowth, development of the vasculature, and regulation of neural progenitor and neuron viability (Reemst et al., 2016). Little is known about the subsequent transition from these immature phenotypes to the highly branched morphologies and tiled distributions of adult microglia. Recent whole transcriptome RNAseq analysis of yolk sac progenitors and immature microglia highlight the degree to which the cells change during this interval, showing dramatic differences in microglial gene expression between early postnatal periods (P3–9) and adulthood (2 months) (Matcovitch-Natan et al., 2016).
In the BG, we found that by P6, microglia were dispersed relatively evenly throughout analyzed nuclei at lower densities than those observed in the adult. At this stage, most cells were not amoeboid, but exhibited limited process branching that did not differ notably across regions. These observations suggest that microglial maturation does not progress in a wave-like fashion outward from late embryonic/early postnatal microglial “hotspots,” but, rather, that immature microglia disperse themselves at low density throughout the parenchyma and then proliferate and ramify in situ to attain a mature tissue distribution and morphology.
Although BG microglia appeared homogeneous at P6, by P12, they exhibited clear regional specialization, with cell density and branching patterns closely mirroring those observed in the adult. This observation suggests that the switch from relatively undifferentiated, immature phenotypes to mature, region-specific microglial phenotypes begins at roughly the same time across all BG nuclei. A potential mechanism for this type of synchronized shift in microglial maturation could be the acquisition of receptors or additional cellular machinery that allow microglia to begin responding to local regulatory cues already present in the BG. During the second postnatal week, onset of basic locomotion, novel sensory input from ear and eye opening, and changes in GABA polarity (Wills et al., 2014; Marin, 2016) are likely to alter BG circuit activity and these processes could also contribute to initiating and shaping this stage of microglial maturation.
Maintenance of diverse microglial phenotypes
In adult mice, we find that region-specific phenotypes of BG microglia reemerge following pharmacological or genetic microglial ablation and repopulation. Regional differences in microglial anatomical features, lysosome content, and electrophysiological membrane properties are all reestablished, indicating that local cues capable of programming diverse features of microglial phenotype continue to be active in the mature CNS. Although these findings argue that local, cell-extrinsic regulatory mechanisms play a key role in maintaining regional differences in baseline microglial phenotypes, they do not exclude the possibility that other mechanisms, such as epigenetic programming, can contribute to shaping microglial attributes.
Although nearly 100% of BG microglia are eliminated using both pharmacological and genetic ablation approaches, there are rare surviving cells. Do these survivors retain their region-specific identity and could they repopulate their nucleus of residence with equivalent counterparts in the absence of external cues? Several observations indicate that this possibility is highly unlikely. First, the tight spatial regulation of distinct microglial phenotypes across the SNc/SNr boundary is reestablished following microglial ablation and repopulation. Microglia that survive the ablation are too sparsely distributed to reestablish such a precise and stereotyped spatial boundary in the absence of external regulatory cues. Second, during early phases of repopulation, microglia exhibit similar density and morphology across BG nuclei (data not shown), and then in later phases of repopulation acquire region-specific morphological attributes. This progression resembles the emergence of regional specialization observed during development and argues that local cues within each nucleus direct “maturation” of repopulating cells. Finally, following ablation and repopulation, the proportion of SNr microglia expressing Kv channels is comparable to that observed in control mice. If rare surviving cells alone determined the attributes of repopulated SNr microglia, one might expect all repopulated SNr microglia to possess or lack Kv depending on whether their survivor progenitor possessed or lacked Kv.
What would be key characteristics of local, cell-extrinsic cues that could instruct microglial phenotype? Our data indicate that such cues would need to be in place throughout the BG by the second postnatal week of development and remain present and active throughout adulthood. The tight regulation of distinct microglial phenotypes across the SNc/SNr border indicates that regulatory cues would need to have a short radius of action, rather than being broadly diffusible. Given the numerous facets of microglial phenotype that vary across BG nuclei, it is likely that multiple regulatory factors act in concert to inform microglial phenotype. Our finding that microglial density is closely correlated with the local abundance of astrocytes, together with increasing reports of microglial-astrocyte signaling (Pascual et al., 2012; Liddelow et al., 2017), suggest that BG astrocytes are well positioned to participate in shaping baseline microglial phenotypes.
STAR METHODS
CONTACT FOR REAGENT AND RESOURCE SHARING
Further information and requests for resources and reagents should be directed to and will be fulfilled by the Lead Contact, Antonello Bonci (antonello.bonci@nih.gov). PLX5622 was provided by Plexxikon Inc. under a Materials Transfer Agreement established between NIDA and Plekkixon.
EXPERIMENTAL MODEL AND SUBJECT DETAILS
In all experiments, both male and female mice were used, and the number of males and females in each analysis group was balanced. No significant effect of sex was observed in data analyses (data not shown). Mice were housed in normal light dark (lights on 7am, lights off 7pm) cycle and had ad libidum access to food and water. Mice were group housed 2–5 to a cage and mice had no prior history of drug administration, surgery, or behavioral testing. All experiments were performed in strict accordance with protocols approved by the Animal Care and Use Committee at NIDA.
CX3CR1EGFP/+ mice
CX3CR1EGFP/EGFP breeders were originally obtained from Jackson labs (Stock # 005582). In these mice, EGFP is knocked in to the CX3CR1 locus. All mice used for experiments were heterozygous (CX3CR1EGFP/+). The RD8 mutation, which results in retinal degeneration (Mattapallil et al., 2012), was bred out of our colony and all mice used for experiments were RD8 free. These mice were maintained on a C57Bl/6 background. EGFP expression in the BG of these mice was specific to microglial cells and 98 ± 1% of Iba1+ microglia were EGFP+ (Fig. 1B,C). Mice used for experiments were between ages postnatal day 6 (P6) – P90.
ALDH1L1-EGFP mice
ALDH1L1-EGFP breeders were obtained from Mutant Mouse Resource and Research Centers (MMRRC; Stock #011015-UCD) and were originally generated by Gensat. In these BAC transgenic mice, EGFP expression is driven by the astrocyte specific aldehyde dehydrogenase 1 family member L1 promoter. All mice used for experiments were heterozygous for the transgene. These mice were maintained on a FVB background. Mice used for experiments were between ages P58 – P60.
CX3CR1CreER-IresEYFP/+ ;Rosafs-DTA/fs-DTA mice
CX3CR1CreER-IresEYFP/+ mice were obtained from Wen Biao Gan (NYU) and are now available at Jackson Labs (Stock# 021160). In these mice, inducible cre recombinase (CreER) and EYFP are knocked into the CX3CR1 locus. These mice were bred to Rosafs-DTA/+ mice obtained from Jackson labs (Stock # 009669) in which a flox-stop module followed by diphtheria toxin is knocked into the Rosa locus. All mice used for experiments were RD8 free. CX3CR1CreER-IresEYFP/CreER-IresEYFP; Rosafs-DTA/fs-DTA mice were bred to CX3CR1+/+; Rosafs-DTA/fs-DTA mice to generate CX3CR1CreER-IresEYFP/+; Rosafs-DTA/fs-DTA offspring for use in experiments. Use of mice that were homozygous for flox-stop diphtheria toxin at the Rosa locus enhanced the consistency of microglial ablation. These mice were maintained on a C57Bl/6 background. Mice used for experiments were between ages P35 – P80.
METHOD DETAILS
Compounds
PLX5622 was provided by Plexxikon Inc. and formulated in AIN-76A standard chow by Research Diets Inc. at a dose of 1200 mg/kg chow. Control AIN-76A standard chow was also provided by Plexxikon Inc.
Microglial ablation and repopulation
Pharmacological microglial ablation
To pharmacologically ablate microglial cells from the CNS, CX3CR1EGFP/+ mice ages P40–55 were treated with the CSF1R antagonist PLX5622 (Plexxikon, Inc.) administered through the diet (1200mg/kg chow). Mice were maintained on PLX5622 or control AIN-76A diet for at least 2 weeks and were then returned to standard NIDA vivarium chow for 3 weeks before tissue collection for immunohistochemistry or preparation of acute brain slices for electrophysiology recordings. Mice that underwent microglial ablation using this approach maintained their body weight during the PLX5622 treatment and subsequent period of microglial repopulation. These mice also appeared normal during qualitative evaluation of motor coordination and exploratory behavior. To confirm microglial cell death and quantify ablation efficacy, tissue was collected from some mice after they had been on PLX5622 diet for 7 or 14 days.
Genetic microglial ablation
To genetically ablate microglial cells from the CNS, CX3CR1CreER-IresEYFP/+; Rosafs-DTA/fs-DTA mice ages P35–38 were given twice daily i.p. injections of 4-hydroxytamoxifen (Sigma, Cat# H7904) prepared in sunflower seed oil (Sigma, Cat#S5007) for 3 consecutive days. Male mice received 1.25mg 4HT per injection for a total of 7.5mg. Female mice received 1mg 4HT per injection for a total of 6mg. Control mice were given i.p. injections of vehicle following the same injection regimen. Mice that underwent microglial ablation using this approach maintained their body weight during the 4HT treatment and subsequent period of microglial ablation/repopulation. These mice also appeared normal during qualitative evaluation of motor coordination and exploratory behavior. To confirm that this protocol caused microglial cell death, tissue was collected from some mice part way through the tamoxifen treatment (after 2 days of 4HT injections). To quantify overall ablation efficacy, tissue was collected from some mice 2 days after the final tamoxifen injection. To assess cell proliferation during the repopulation period, mice were given a complete 4HT injection regimen, were then given 3x daily i.p. injections of 5-bromo-2-doxyuridine (BrdU, 50mg/kg, Sigma, Cat#B5002) for 2 days and tissue was collected 24 hours later. For analysis of microglial repopulation, mice were allowed to survive for 6 weeks after the final 4HT injection before tissue collection.
Immunohistochemistry
Mice aged postnatal day 6 (P6), P12, or P58–60 were deeply anesthetized with Euthasol (sodium pentobarbital 150 mg/kg and sodium phenytoin 19.2 mg/kg, Virbac) and perfused transcardially with 4% paraformaldehyde in 1x PBS. All perfusions for this study were performed between 9:00am–12:00pm. Brain tissue was isolated and postfixed in this solution for 4 h at 4°C, then stored in 1x PBS with 0.1% NaAz. Coronal brain sections (60 μm thick) were prepared on a vibratome in chilled 1x PBS. Free-floating sections were permeabilized/blocked with 0.3% Triton X-100 and 5% normal donkey serum in 1x PBS for 2 h at room temperature. Sections were incubated with primary antibodies prepared in 0.05% Triton X-100 and 5% normal donkey serum in 1x PBS at 4°C overnight. Sections were incubated with secondary antibodies in 5% normal donkey serum in 1x PBS for 2 h at room temperature. Control sections incubated with secondary antibody alone did not result in labeling of cells. For visualization of biocytin-filled cells, acute brain sections were incubated with 4% PFA for 1–3 hours and then processed for immunostaining, as described above. Alexa 594- or Alexa 647-conjugated streptavidin (1:1000) was included during incubation with primary antibodies to label biocytin-filled cells. Primary antibodies used included the following: Guinea pig anti-NG2 (1:200; gift from Dr. Bergles, Johns Hopkins University), chicken anti-GFP (1:1000; Aves, Tigard, OR Cat#GFP-1020), goat anti-GFP (1:1000; Frontier Institute, Hokkaido, Japan, Cat#GFP-Go-Af1480), rabbit anti-Iba1 (1:500; Wako, Richmond, VA, Cat#019-19741), rat anti-CD68 (1:200; clone FA-11, AbD Serotec, Raleigh, NC, Cat#MCA1957), Rabbit anti-Caspase3 (1:200, Cell Signaling, Cat#Asp175), mouse anti-tyrosine hydroxylase (1: 5000; Sigma, St. Louis, MO, Cat#T1299), chicken anti-tyrosine hydroxylase (1:500; Aves, Tigard, OR, Cat#TYH), mouse anti-NeuN (clone A60, 1:500; Millipore, Billerica, MA Cat#MAB377), rat anti-BrdU (1:500; Accurate Chemical and Scientific, Westbury, NY), rabbit anti-Ki67 (1:500; Abcam, Cambridge, MA CAT#ab15580). Primary antibodies have been validated for use in immunohistochemistry in mouse tissue in published literature and on the maunfacturer’s websites. Secondary antibodies used included the following: Alexa Fluor 488-, 594-, or 647-conjugated secondary antibodies to rabbit, mouse, goat, chicken, rat or guinea pig (1:500; all raised in donkey; Jackson ImmunoResearch).
Image acquisition and analysis
For all experiments, confocal fluorescence images were acquired with an Olympus FV1000 microscope. Within the NAc, analyzed images were acquired at the boundary between core and shell (identified anatomically), and include both subregions. In the VTA, analyzed images were medial to the medial lemniscus and included the parabrachial pigmented area, as well as portions of the parafasciculus retroflexus area and paranigral nucleus. For quantification of cell density, stacks of confocal images were acquired using a 20x objective and a 1.5 μm z-interval and analysis was performed on maximum projections of confocal stacks within ImageJ software. For analysis of tissue coverage by microglia, stacks of confocal images were acquired using a 60x objective and 1.5 μm z-interval. Within ImageJ software, mean pixel intensity of the dimmest cell processes was measured at 10–15 locations diagonally across each image. The average of these values was taken as a threshold for determining the % of pixels above (representing microglial cell somas and processes) and below this threshold. For 3D reconstruction of entire microglial cells, stacks of confocal images were acquired throughout the entire brain section using a 60x objective and a 0.3 μm z-interval. Image stacks were imported into Imaris software (Bitplane). 3D reconstruction of individual microglial cells was carried out using the filament tracer module. Territory of reconstructed cells was calculated in image J using area of convex hull bounding the reconstruction. For analysis of intracellular CD68 distribution in naïve mice, stacks of confocal images were acquired throughout the entire brain section using a 60x objective and a 0.3 μm z-interval. Image stacks were imported into Imaris and the surfaces module was used to reconstruct the volume of microglial cells and CD68-labeled lysosomes. For analysis of microglial lysosome content following microglial ablation and repopulation, stacks of confocal images were acquired throughout the entire brain section using a 60x objective and a 0.3 μm z-interval and analysis of maximum projections of confocal stacks was carried out within ImageJ software. For all imaging analyses (except individual microglial cell reconstructions), 2–4 images from separate brain sections were analyzed per mouse to obtain an average value for that mouse. 3–8 mice were analyzed per brain region. Sample sizes were selected to be in the upper range of published immunohistochemistry experiments. Experimenters were not blind to source brain region during image analysis.
Acute brain slice preparation and electrophysiology
EGFP expression in CX3CR1EGFP/+ mice enabled accurate identification of microglia and facilitated recordings from cells deep within the brain slice (40–60 μm). For analyses in naïve mice, CX3CR1EGFP/+ mice age postnatal day (P) 35–45 were anesthetized with isoflurane and decapitated; their brains were dissected into an ice-cold N-methyl-d-glucamine (NMDG)-based solution containing the following (in mM): 92 NMDG, 20 Hepes, 30 NaHCO3, 1.2 NaH2PO4, 2.5 KCl, 5 sodium ascorbate, 3 sodium pyruvate, 2 thiourea, 10 MgSO4, and 0.5 CaCl2, 10 glucose, pH 7.4 (310 mOsm). Horizontal midbrain slices (230 μm thick) were prepared using a vibratome equipped with sapphire blade in ice-cold NMDG-based cutting solution. After sectioning, slices were transferred to artificial cerebral spinal fluid (ACSF) containing the following (in mM): 125 NaCl, 2.5 KCl, 1.25 NaH2PO4*2H2O, 1 MgCl2*6H2O, 26 NaHCO3, 2.4 CaCl2*2H2O, and 11 glucose (298 mOsm, maintained at 37°C for 15 min and at room temperature thereafter). For experiments following microglial ablation/repopulation, CX3CR1EGFP/+ mice age P90–98 were anesthetized with Euthasol (sodium pentobarbital 150 mg/kg and sodium phenytoin 19.2 mg/kg, Virbac) and perfused transcardially with chilled, oxygenated NMDG solution prior to preparation of brain slices. After sectioning, slices were allowed to recover in NMDG solution maintained at 37°C for 10 min and were then transferred to a HEPES-based holding solution containing the following (in mM): 92 NaCl, 20 HEPES, 30 NaHCO3, 1.2 NaH2PO4*2H2O, 2.5 KCl, 5 sodium ascorbate, 3 sodium pyruvate, 2 thiourea, 1 MgSO4, and 2 CaCl2, 25 glucose (pH 7.4, 300 mOsm, room temperature). Once transferred to the recording chamber, sections were perfused with ACSF. All solutions were bubbled continuously with 95% O2/5% CO2. All recordings were performed at room temperature. Microglia were visualized and targeted for whole-cell recording using an upright microscope (Olympus BX51WI) equipped with both differential interference contrast (DIC) optics and filter sets for GFP. A potassium-based internal solution was used that contained the following (in mM): 140 KCH3OSO3 (potassium methyl sulfate), 5 KCl, 5 EGTA, 10 HEPES, 2 MgCl2, 2 sodium ATP, and 0.4 sodium GTP, pH 7.3 (298 mOsm). Pipette resistance was 3.4–4.2 MΩ, and recordings were made without series resistance compensation. Measurements of resting potential were made immediately after breaking into the cell. Membrane capacitance was measured using a 5 mV depolarizing step from a holding potential of −60 mV. For experiments to assess the morphology of recorded microglial cells, biocytin (0.1%, Sigma) was added to the internal solution. The following agents were applied by addition to the superfusing ACSF: 4-Aminopyridine (4AP, 1 mM, Sigma), tetraethylammonium (TEA, 10–20 mM, Sigma). For all analyses, between 5–31 cells were recorded per brain region. To arrive at these totals, 1–3 cells were recorded per region from 2–15 different mice. Sample sizes were selected to be in the upper range of currently published whole-cell patch clamp electrophysiology experiments.
Microdissection of basal ganglia nuclei and cortex
CX3CR1EGFP/+ mice age P40–50 were anesthetized with Euthasol (sodium pentobarbital 150 mg/kg and sodium phenytoin 19.2 mg/kg, Virbac) and perfused transcardially with 10 mL of oxygenated, ice-cold N-methyl-d-glucamine (NMDG)-based solution (described above for preparation of acute brain slices for electrophysiological recording). NMDG perfusion is a critical step for elimination of peripheral macrophages within the vasculature and to minimize injury responses of CNS cells. Brains were then rapidly dissected free and horizontal midbrain sections (230 μm thick) and coronal forebrain sections (300 μm thick) were prepared using a vibratome in ice-cold NMDG-based cutting solution bubbled continuously with 95% O2/5% CO2. After sectioning, slices remained in ice-cold, oxygenated NMDG solution and were transferred one at a time to a glass dissecting surface under a stereoscope maintained at 4°C. VTA and SN were microdissected from horizontal midbrain sections, and NAc and overlying Ctx (containing predominantly M1, M2, S1, S2, and portions of insular and cingulate cortex) were microdissected from coronal forebrain sections using fine tipped forceps. Microdissected tissue was minced using a scalpel under the stereoscope before being transferred to eppendorf tubes containing 1 mL Hibernate A solution (Brain Bits) stored on ice. To minimize tissue loss during processing, “carrier” tissue from a wildtype mouse was added to VTA and SNr samples. For preparation of carrier tissue, a wildtype C57Bl6 mouse was perfused with NMDG, the brain was dissected out and a portion of cortex was block dissected using a scalpel. This tissue was minced thoroughly on a chilled glass surface and then transferred to 1 mL Hibernate A solution on ice. 100 μL of this solution was then added to each VTA and SNr sample.
Tissue dissociation and FACS
Tissues were not pooled; each sample used for downstream applications represents microglia from the BG nucleus of an individual mouse. Microdissected tissues from wildtype and CX3CR1EGFP/+ mice were gently dissociated in Hibernate A solution using sequential trituration with fire-polished glass pipettes with openings of decreasing diameter (final pipette ~ 0.4 mm diameter opening). Resulting cell suspensions were spun down, resuspended in 300 μL 1x PBS and filtered through a 40 μm mesh filter. Throughout the experiment, samples were kept at 4°C on ice. Samples were sorted using a FACS Aria I cell sorter (BD Biosciences). The population of cells containing microglia could be readily identified based on forward scattering (FSC) and side scattering (SSC) properties. A gating strategy based on FSC and SSC width and height was used to select only single cells. Microglial cells within this population were then identified and sorted according to GFP expression (Fig. S3). Cell suspensions from wildtype tissue were used as a GFP-negative control for establishment of GFP-negative gates. Average microglial cell yields collected using this gating strategy were the following: Ctx 3989 ± 583 cells, NAc 916 ± 271 cells, VTA 76 ± 11 cells, SN 359 ± 51 cells. Sort order was varied systematically. GFP-negative cells were collected from Ctx and NAc, but not VTA and SN, due to the presence of carrier tissue in these samples. For immunostaining experiments to verify the identity of GFP positive cells collected with this strategy (Fig. S3F,G), dissociated cells from CX3CR1EGFP/+ brain tissue were resuspended in 1x PBS and incubated for 20 min on ice with the following antibodies: APC conjugated Rat anti-CD11b (1:100, BD Pharmingen), PE-Cy7 conjugated Rat anti-CD45 (1:400, BD Pharmingen), Brilliant Violet – 421 conjugated mouse anti-CX3CR1 (1:200, BioLegend). Cells were then washed once with 1x PBS, resuspended in 300 μL 1x PBS and filtered as above.
RNA isolation for RT-PCR and RNAseq
For all described downstream experiments, RNA from sorted cells was isolated using the PicoPure RNA isolation kit (Arcturus Bioscience). Microglia from individual BG nuclei of individual mice were FACS sorted directly into eppendorf tubes containing 50 μL PicoPure RNA extraction buffer and, following the sort, samples were incubated at 42°C for 30 min, and stored in RNase-free tubes at −80°C until further processing. Column filtration, washing, and elution of RNA from the columns was performed according to manufacturer’s instructions in section C of the PicoPure RNA isolation protocol. Yields of RNA from such small numbers of cells were generally below the limit of Bioanalyzer (Agilent, Santa Clara, CA) detection.
Library preparation and RNA sequencing
For sequencing experiments, RNA samples were amplified using the Single Primer Isothermal Amplification (SPIA) Ovation RNA Seq System kit (Nugen), which utilizes a proprietary strand displacement technology for linear amplification of mRNA to generate between 10 and 1000 nanograms of double stranded cDNA, as per the manufacturer’s recommendations. In samples derived from less than 200 FACS-isolated cells, all RNA was used as input for the SPIA reaction; in samples from greater than 200 cells, half of the RNA was used. Quality and quantity of amplified, double stranded cDNA was monitored using the Bioanalyzer High Sensitivity kit (Agilent). Only those samples which yielded a characteristic smear of cDNA fragments from 50–1500 bp and quantities in the microgram range were used for downstream processing. SPIA-generated cDNA from microglial samples from different brain regions yielded highly similar Bioanalyzer profiles (data not shown). Samples were then sheared to an average of 200 nucleotide fragments using the Covaris S2 sonicator set at 4°C with 6 repetitions of the following program: duty cycle 10%, intensity 5, 100 cycles/burst for a combined time of 60 s. 10 ng of sheared cDNA was used as input for the Ion Xpress Plus HiQ gDNA Fragment Library Preparation kit (Life Technologies). Barcodes from the Ion Xpress Barcode kit (barcodes 1–16) were ligated to the DNA as per manufacturer’s instructions, libraries were quantited using Qubit and/or Bioanalyzer and diluted to a final concentration of 100 pM. A total of 10 pM of pooled libraries were used for bead preparation, emulsion PCR, and enrichment of DNA samples were performed with the Ion DNA Library Express v2 or HiQ kit on the Ion OneTouch 2. Ion Sphere Particles containing libraries were deposited on the Ion PI chip v2 or HiQ, respectively, and sequenced using the Ion Torrent Proton. 3 libraries were sequenced per chip, with a yield of approximately 10 gigabases of sequence generated per run, resulting in 7–33 million reads mapped to the mouse mRNA transcriptome, per sample (Table S1). N = 6 – 8 samples per group. Tissues were not pooled; each sample was derived from microglia isolated from the BG nucleus of an individual mouse.
Transcriptome and bioinformatics analysis
After Ion Torrent sequencing was completed, BAM files containing sequence reads were imported into the CLC Genomics Workbench (version 8.5, Qiagen Inc.) for mapping and downstream analysis. Mouse reference genome Mm10 (22 chromosomes; 2,725,537,669 bp; 45,706 genes, 92,787 transcripts) was used as a mapping template. CLC mapping parameters were the following: Mapping type = Map to gene regions only, Mismatch cost = 2, Insertion cost = 3, Deletion cost = 3, Length fraction = 0.8, Similarity fraction = 0.8, Global alignment = No, Strand specific = Both, Maximum number of hits for a read = 10, Expression value = RPKM, Calculate RPKM for genes without transcripts = No. Quality control assessment tools, including total number of reads, percent reads mapped to host genome, box plots and principle component analysis, were used to select viable datasets for further analysis, for a total of N = 6 Ctx microglia, N = 6 NAc microglia, N = 7 VTA microglia, N = 8 SN microglia, N = 1 Ctx GFP-negative cells, N = 1 NAc GFP-negative cells datasets. These sample sizes were selected to be in the upper range of currently published RNAseq experiments. For microglial RNAseq datasets generated from different brain regions, there were no significant differences in total number of reads (one-way ANOVA, P = 0.83), in the percent of reads mapped (ANOVA P = 0.03, individual comparisons not significant after Bonferroni correction, P > 0.05), or in the appearance of dataset box plots. No correlation was observed between the number of genes detected in individual samples and FACS sort order/length of tissue processing (Ctx R2 = −0.19, P = 0.7; NAc R2 = −0.18, P = 0.65; VTA R2 = −0.02, P = 0.4; SN R2 = −0.07, P = 0.47). Greater sample-to-sample variability was observed within VTA microglia samples (Fig. S5C); this phenomenon is commonly observed in RNAseq analysis of small numbers of cells (Marinov et al., 2014) and does not reflect differences in sample quality, but can dampen the ability to detect differentially expressed genes.
Unless otherwise stated, genes were considered to be expressed in a particular group if mean RPKM was > 2 and normalized SEM (SEM/mean RPKM) was < 0.5. For comparisons, making use of previously published RNAseq data from whole cortex microglia (Zhang et al., 2014), raw data were obtained from web.standord.edu/group/barres_lab/brain_rnaseq.html. Group A versus group B statistical comparisons with associated p-values and fold changes were generated by CLC EDGE test algorithms. Empirical analysis of Digital Gene Expression (EDGE) (Robinson et al., 2010) is similar to Fisher’s Exact Test and was developed specifically for count data where many features are analyzed simultaneously across few biological replicates. Unless otherwise stated, genes were considered to be significantly differentially expressed if EDGE p-values were < 0.05. Functional annotation of gene lists was carried out using Ingenuity Pathway Analysis (Qiagen). For functional annotation of significantly up-regulated genes that most distinguish Ctx, NAc, and SN microglia (Fig. 6D), genes that were significantly up-regulated relative to any other region, or relative to VTA + one additional region, were considered. For functional annotation of significantly up-regulated genes that most distinguish VTA microglia (Fig. 6D), only genes that were significantly up-regulated compared to all three other regions were considered. Venny 2.1 (BioinfoGP) was used for comparison of overlap among gene lists. CIMminer (NCI/NIH) was used for generation of heatmaps and unsupervised clustering of samples. Unsupervised clustering of samples was performed with Euclidean distance method and average linkage cluster algorithm.
cDNA synthesis, pre-amplification, and RT-PCR
For RT-PCR analyses, microglia were collected from an independent cohort of mice and RNA was isolated as described above to obtain N = 5 samples per group. Tissues were not pooled; each sample was derived from microglia isolated from the BG nucleus of an individual mouse. These sample sizes were selected to be at the upper end of currently published RT-PCR experiments.
The PreAmplification-RT-PCR method used is based on previously published approaches (Liu et al., 2014). Single strand cDNAs were synthesized with Superscript III first strand cDNA synthesis kit (Invitrogen, Life Technologies), according to the manufacturer’s protocol. TaqMan PreAmp Master Mix Kit was used for cDNA preamplification (Cat# 4391128; Applied Biosystems, Life Technologies), using pooled primer mixes of 20x dilution of TaqMan Gene Expression Assay and 80 nM of custom-designed primer sets. cDNAs were pre-amplified in an ABI 9700 Thermal Cycler using the program: 95°C hold for 10 min, 14 cycles of 90°C denaturation for 15 s, and 60°C annealing and extension for 4 min. Pre-amplification PCR products were immediately diluted five times with molecular biology grade water and stored at −20°C, or immediately processed for RT-PCR. Duplex RT-PCR assays were performed on technical duplicates using a FAM-labeled probe for each target gene, and a VIC-labeled probe for the endogenous control gene (Gapdh), along with TaqMan Advanced Fast PCR Master Mix (Cat# 4444963; Life Technologies). To avoid amplification of genomic DNA contamination, primers and probes that amplify across target gene exon–exon junctions were selected when possible. RT-PCR reactions were run in a 7500 Fast TaqMan instrument using the program: 95°C hold for 20 s, followed by 40 cycles of 95°C denaturation for 3 s, and 60°C annealing and extension for 30 s. Calculations of relative expression from Ct data were carried out according to User Bulletin #2 for ABI Prism 7900 Sequence Detection System. For each target gene, the average Ct value for the endogenous control (Gapdh) was subtracted from the average Ct value for the target gene, to obtain ΔCt. The relative expression was then plotted as 2−ΔCt. Uniformity of the pre-amplification was verified by comparing cDNA templates from the pre-amplified and unamplified cortex samples. ΔCt values were within range of ± 2 for all target genes between the pre-amplified and unamplified samples, suggesting that pre-amplification does not introduce substantial bias. All TaqMan Assays and custom primers/probes that were used are detailed in Table S4.
QUANTIFICATION AND STATISTICAL ANALYSIS
All graphed values are shown as mean ± SEM. Statistical details of experiments (statistical tests used, exact value of n, what n represents) can be found in the results and figure legends. In general, statistical significance was assessed using one-way ANOVA with sequential Bonferroni correction (Figures 1D–H; 2B,D,E,G; 3B–D; 7A; 8G; S1C–E; S2A–C; S5C;) or, where appropriate, two-way ANOVA (Figure 8D–F; S8F). Data are sufficiently normal and variance within groups is sufficiently similar for use of parametric tests. Linear regression tests were used to test dependence of variable y on variable x (Figures 5D, S2F–H). One-tailed paired T-tests were used for pharmacological experiments in Figure 4E,F to test for an expected reduction in observed currents. For RNAseq data, statistical testing for differentially expressed genes (Figures 6B, S6A,B) was carried out using the Empirical analysis of Digital Gene Expression (EDGE) algorithm within CLC Genomics Workbench software. EDGE is similar to Fisher’s Exact Test and was developed specifically for count data where many features are analyzed simultaneously across few biological replicates (Robinson et al., 2010).
DATA AND SOFTWARE AVAILABILITY
The BAM files for RNA sequencing data have been deposited in the NCBI BioProject Sequence Read Archive (SRA) database under the BioProject ID code PRJNA312525.
Supplementary Material
Up-regulated genes for microglia in each region and associated functional annotation.
Highlights.
We provide an extensive definition of basic properties of basal ganglia microglia
Microglia in the healthy brain exist along a spectrum of functional states
Midbrain microglia differ significantly from their cortical counterparts
Local cues establish and maintain region-specific microglial phenotypes
Acknowledgments
This research was supported by the Intramural Research Program of NIDA and NIAAA. The authors thank D.E. Bergles (Johns Hopkins University) for antibodies to NG2, NIDA IRP Transgenic breeding staff for assistance with animal care, Johns Hopkins Bayview Immunomics Core (supported by NIAMS P30 AR-070254) for FACS services, NIDA IRP Histology Core for use of Imaris software, M. Zemen, P. Gopal, S.P. Ribeiro, S. Scognamiglio, and S. Deshpande for contributions to experiments, J.L. Cadet and C. Brannock for advice in RNAseq analysis, A. De Biase for assistance in PCR primer design and analysis, and B.K. Harvey, R.M. McDevitt, G. Seabold, and W. Xin for advice and editorial suggestions during manuscript preparation.
Footnotes
Publisher's Disclaimer: This is a PDF file of an unedited manuscript that has been accepted for publication. As a service to our customers we are providing this early version of the manuscript. The manuscript will undergo copyediting, typesetting, and review of the resulting proof before it is published in its final citable form. Please note that during the production process errors may be discovered which could affect the content, and all legal disclaimers that apply to the journal pertain.
AUTHOR CONTRIBUTIONS
Conceptualization, L.M.D; Methodology, L.M.D., K.E.S, K.J., R.C.; Investigation, L.M.D., Z.F., I.A.H., R.C., H.Z., K.E.S., K.J., Q.L., H.S.; Formal Analysis, L.M.D., Z.F., I.A.H., K.E.S.; Visualization, L.M.D.; Writing – Original Draft, L.M.D.; Writing – Review & Editing, L.M.D., A.B., K.E.S., R.C.; Resources, A.B., D.G., Z.X.; Funding Acquisition, A.B., D.G., Z.X.; Supervision, A.B.
References
- Albin RL. Basal ganglia neurotoxins. Neurologic clinics. 2000;18:665–680. doi: 10.1016/s0733-8619(05)70217-6. [DOI] [PubMed] [Google Scholar]
- Appelqvist H, Waster P, Kagedal K, Ollinger K. The lysosome: from waste bag to potential therapeutic target. Journal of molecular cell biology. 2013;5:214–226. doi: 10.1093/jmcb/mjt022. [DOI] [PubMed] [Google Scholar]
- Arnoux I, Hoshiko M, Mandavy L, Avignone E, Yamamoto N, Audinat E. Adaptive phenotype of microglial cells during the normal postnatal development of the somatosensory “Barrel” cortex. Glia. 2013;61:1582–1594. doi: 10.1002/glia.22503. [DOI] [PubMed] [Google Scholar]
- Avignone E, Ulmann L, Levavasseur F, Rassendren F, Audinat E. Status epilepticus induces a particular microglial activation state characterized by enhanced purinergic signaling. The Journal of neuroscience : the official journal of the Society for Neuroscience. 2008;28:9133–9144. doi: 10.1523/JNEUROSCI.1820-08.2008. [DOI] [PMC free article] [PubMed] [Google Scholar]
- Bayraktar OA, Fuentealba LC, Alvarez-Buylla A, Rowitch DH. Astrocyte development and heterogeneity. Cold Spring Harbor perspectives in biology. 2015;7:a020362. doi: 10.1101/cshperspect.a020362. [DOI] [PMC free article] [PubMed] [Google Scholar]
- Berger JR, Arendt G. HIV dementia: the role of the basal ganglia and dopaminergic systems. J Psychopharmacol. 2000;14:214–221. doi: 10.1177/026988110001400304. [DOI] [PubMed] [Google Scholar]
- Bergles DE, Richardson WD. Oligodendrocyte Development and Plasticity. Cold Spring Harbor perspectives in biology. 2016;8:a020453. doi: 10.1101/cshperspect.a020453. [DOI] [PMC free article] [PubMed] [Google Scholar]
- Bjorklund A, Dunnett SB. Dopamine neuron systems in the brain: an update. Trends in neurosciences. 2007;30:194–202. doi: 10.1016/j.tins.2007.03.006. [DOI] [PubMed] [Google Scholar]
- Boucsein C, Kettenmann H, Nolte C. Electrophysiological properties of microglial cells in normal and pathologic rat brain slices. The European journal of neuroscience. 2000;12:2049–2058. doi: 10.1046/j.1460-9568.2000.00100.x. [DOI] [PubMed] [Google Scholar]
- Boucsein C, Zacharias R, Farber K, Pavlovic S, Hanisch UK, Kettenmann H. Purinergic receptors on microglial cells: functional expression in acute brain slices and modulation of microglial activation in vitro. The European journal of neuroscience. 2003;17:2267–2276. doi: 10.1046/j.1460-9568.2003.02663.x. [DOI] [PubMed] [Google Scholar]
- Brix K. In: Lysosomal Proteases: Revival of the Sleeping Beauty. Lysosomes, Saftig P, editors. New York, New York: Springer Science + Buisness Media; 2005. pp. 50–59. [Google Scholar]
- Butovsky O, Jedrychowski MP, Moore CS, Cialic R, Lanser AJ, Gabriely G, Koeglsperger T, Dake B, Wu PM, Doykan CE, et al. Identification of a unique TGF-beta-dependent molecular and functional signature in microglia. Nature neuroscience. 2014;17:131–143. doi: 10.1038/nn.3599. [DOI] [PMC free article] [PubMed] [Google Scholar]
- Chiu IM, Morimoto ET, Goodarzi H, Liao JT, O’Keeffe S, Phatnani HP, Muratet M, Carroll MC, Levy S, Tavazoie S, et al. A neurodegeneration-specific gene-expression signature of acutely isolated microglia from an amyotrophic lateral sclerosis mouse model. Cell reports. 2013;4:385–401. doi: 10.1016/j.celrep.2013.06.018. [DOI] [PMC free article] [PubMed] [Google Scholar]
- Crawford AH, Tripathi RB, Richardson WD, Franklin RJ. Developmental Origin of Oligodendrocyte Lineage Cells Determines Response to Demyelination and Susceptibility to Age-Associated Functional Decline. Cell reports. 2016 doi: 10.1016/j.celrep.2016.03.069. [DOI] [PMC free article] [PubMed] [Google Scholar]
- Davalos D, Grutzendler J, Yang G, Kim JV, Zuo Y, Jung S, Littman DR, Dustin ML, Gan WB. ATP mediates rapid microglial response to local brain injury in vivo. Nature neuroscience. 2005;8:752–758. doi: 10.1038/nn1472. [DOI] [PubMed] [Google Scholar]
- de Haas AH, Boddeke HW, Biber K. Region-specific expression of immunoregulatory proteins on microglia in the healthy CNS. Glia. 2008;56:888–894. doi: 10.1002/glia.20663. [DOI] [PubMed] [Google Scholar]
- Elmore MR, Lee RJ, West BL, Green KN. Characterizing newly repopulated microglia in the adult mouse: impacts on animal behavior, cell morphology, and neuroinflammation. PloS one. 2015;10:e0122912. doi: 10.1371/journal.pone.0122912. [DOI] [PMC free article] [PubMed] [Google Scholar]
- Elmore MR, Najafi AR, Koike MA, Dagher NN, Spangenberg EE, Rice RA, Kitazawa M, Matusow B, Nguyen H, West BL, et al. Colony-stimulating factor 1 receptor signaling is necessary for microglia viability, unmasking a microglia progenitor cell in the adult brain. Neuron. 2014;82:380–397. doi: 10.1016/j.neuron.2014.02.040. [DOI] [PMC free article] [PubMed] [Google Scholar]
- Ferguson SM. Beyond indigestion: emerging roles for lysosome-based signaling in human disease. Current opinion in cell biology. 2015;35:59–68. doi: 10.1016/j.ceb.2015.04.014. [DOI] [PMC free article] [PubMed] [Google Scholar]
- Ferrini F, Trang T, Mattioli TA, Laffray S, Del’Guidice T, Lorenzo LE, Castonguay A, Doyon N, Zhang W, Godin AG, et al. Morphine hyperalgesia gated through microglia-mediated disruption of neuronal Cl(−) homeostasis. Nature neuroscience. 2013;16:183–192. doi: 10.1038/nn.3295. [DOI] [PMC free article] [PubMed] [Google Scholar]
- Garden GA. Epigenetics and the modulation of neuroinflammation. Neurotherapeutics : the journal of the American Society for Experimental NeuroTherapeutics. 2013;10:782–788. doi: 10.1007/s13311-013-0207-4. [DOI] [PMC free article] [PubMed] [Google Scholar]
- Ginhoux F, Lim S, Hoeffel G, Low D, Huber T. Origin and differentiation of microglia. Frontiers in cellular neuroscience. 2013;7:45. doi: 10.3389/fncel.2013.00045. [DOI] [PMC free article] [PubMed] [Google Scholar]
- Ginhoux F, Prinz M. Origin of Microglia: Current Concepts and Past Controversies. Cold Spring Harbor perspectives in biology. 2015;7 doi: 10.1101/cshperspect.a020537. [DOI] [PMC free article] [PubMed] [Google Scholar]
- Gonzalez-Hernandez T, Cruz-Muros I, Afonso-Oramas D, Salas-Hernandez J, Castro-Hernandez J. Vulnerability of mesostriatal dopaminergic neurons in Parkinson’s disease. Frontiers in neuroanatomy. 2010;4:140. doi: 10.3389/fnana.2010.00140. [DOI] [PMC free article] [PubMed] [Google Scholar]
- Gowrishankar S, Yuan P, Wu Y, Schrag M, Paradise S, Grutzendler J, De Camilli P, Ferguson SM. Massive accumulation of luminal protease-deficient axonal lysosomes at Alzheimer’s disease amyloid plaques. Proceedings of the National Academy of Sciences of the United States of America. 2015;112:E3699–3708. doi: 10.1073/pnas.1510329112. [DOI] [PMC free article] [PubMed] [Google Scholar]
- Grabert K, Michoel T, Karavolos MH, Clohisey S, Baillie JK, Stevens MP, Freeman TC, Summers KM, McColl BW. Microglial brain region-dependent diversity and selective regional sensitivities to aging. Nature neuroscience. 2016;19:504–516. doi: 10.1038/nn.4222. [DOI] [PMC free article] [PubMed] [Google Scholar]
- Graybiel AM. Habits, rituals, and the evaluative brain. Annual review of neuroscience. 2008;31:359–387. doi: 10.1146/annurev.neuro.29.051605.112851. [DOI] [PubMed] [Google Scholar]
- Hanisch UK, Kettenmann H. Microglia: active sensor and versatile effector cells in the normal and pathologic brain. Nature neuroscience. 2007;10:1387–1394. doi: 10.1038/nn1997. [DOI] [PubMed] [Google Scholar]
- Hegde AN, Mohan S, Lath N, Lim CC. Differential diagnosis for bilateral abnormalities of the basal ganglia and thalamus. Radiographics : a review publication of the Radiological Society of North America, Inc. 2011;31:5–30. doi: 10.1148/rg.311105041. [DOI] [PubMed] [Google Scholar]
- Hickman SE, Kingery ND, Ohsumi TK, Borowsky ML, Wang LC, Means TK, El Khoury J. The microglial sensome revealed by direct RNA sequencing. Nature neuroscience. 2013;16:1896–1905. doi: 10.1038/nn.3554. [DOI] [PMC free article] [PubMed] [Google Scholar]
- Hong S, Beja-Glasser VF, Nfonoyim BM, Frouin A, Li S, Ramakrishnan S, Merry KM, Shi Q, Rosenthal A, Barres BA, et al. Complement and microglia mediate early synapse loss in Alzheimer mouse models. Science. 2016 doi: 10.1126/science.aad8373. [DOI] [PMC free article] [PubMed] [Google Scholar]
- Hughes EG, Kang SH, Fukaya M, Bergles DE. Oligodendrocyte progenitors balance growth with self-repulsion to achieve homeostasis in the adult brain. Nature neuroscience. 2013;16:668–676. doi: 10.1038/nn.3390. [DOI] [PMC free article] [PubMed] [Google Scholar]
- Joers V, Tansey MG, Mulas G, Carta AR. Progress in neurobiology. 2016. Microglial phenotypes in Parkinson’s disease and animal models of the disease. [DOI] [PMC free article] [PubMed] [Google Scholar]
- Johnson DE, Ostrowski P, Jaumouille V, Grinstein S. The position of lysosomes within the cell determines their luminal pH. The Journal of cell biology. 2016;212:677–692. doi: 10.1083/jcb.201507112. [DOI] [PMC free article] [PubMed] [Google Scholar]
- Kauer JA, Malenka RC. Synaptic plasticity and addiction. Nature reviews Neuroscience. 2007;8:844–858. doi: 10.1038/nrn2234. [DOI] [PubMed] [Google Scholar]
- Kettenmann H, Hanisch UK, Noda M, Verkhratsky A. Physiology of microglia. Physiological reviews. 2011;91:461–553. doi: 10.1152/physrev.00011.2010. [DOI] [PubMed] [Google Scholar]
- Lawson LJ, Perry VH, Dri P, Gordon S. Heterogeneity in the distribution and morphology of microglia in the normal adult mouse brain. Neuroscience. 1990;39:151–170. doi: 10.1016/0306-4522(90)90229-w. [DOI] [PubMed] [Google Scholar]
- Lewitus GM, Konefal SC, Greenhalgh AD, Pribiag H, Augereau K, Stellwagen D. Microglial TNF-alpha Suppresses Cocaine-Induced Plasticity and Behavioral Sensitization. Neuron. 2016;90:483–491. doi: 10.1016/j.neuron.2016.03.030. [DOI] [PMC free article] [PubMed] [Google Scholar]
- Liddelow SA, Guttenplan KA, Clarke LE, Bennett FC, Bohlen CJ, Schirmer L, Bennett ML, Munch AE, Chung WS, Peterson TC, et al. Neurotoxic reactive astrocytes are induced by activated microglia. Nature. 2017;541:481–487. doi: 10.1038/nature21029. [DOI] [PMC free article] [PubMed] [Google Scholar]
- Liu QR, Rubio FJ, Bossert JM, Marchant NJ, Fanous S, Hou X, Shaham Y, Hope BT. Detection of molecular alterations in methamphetamine-activated Fos-expressing neurons from a single rat dorsal striatum using fluorescence-activated cell sorting (FACS) Journal of neurochemistry. 2014;128:173–185. doi: 10.1111/jnc.12381. [DOI] [PMC free article] [PubMed] [Google Scholar]
- Long-Smith CM, Sullivan AM, Nolan YM. The influence of microglia on the pathogenesis of Parkinson’s disease. Progress in neurobiology. 2009;89:277–287. doi: 10.1016/j.pneurobio.2009.08.001. [DOI] [PubMed] [Google Scholar]
- Lyons SA, Pastor A, Ohlemeyer C, Kann O, Wiegand F, Prass K, Knapp F, Kettenmann H, Dirnagl U. Distinct physiologic properties of microglia and blood-borne cells in rat brain slices after permanent middle cerebral artery occlusion. Journal of cerebral blood flow and metabolism : official journal of the International Society of Cerebral Blood Flow and Metabolism. 2000;20:1537–1549. doi: 10.1097/00004647-200011000-00003. [DOI] [PubMed] [Google Scholar]
- Marin O. Developmental timing and critical windows for the treatment of psychiatric disorders. Nature medicine. 2016;22:1229–1238. doi: 10.1038/nm.4225. [DOI] [PubMed] [Google Scholar]
- Marinov GK, Williams BA, McCue K, Schroth GP, Gertz J, Myers RM, Wold BJ. From single-cell to cell-pool transcriptomes: stochasticity in gene expression and RNA splicing. Genome research. 2014;24:496–510. doi: 10.1101/gr.161034.113. [DOI] [PMC free article] [PubMed] [Google Scholar]
- Matcovitch-Natan O, Winter DR, Giladi A, Vargas Aguilar S, Spinrad A, Sarrazin S, Ben-Yehuda H, David E, Zelada Gonzalez F, Perrin P, et al. Microglia development follows a stepwise program to regulate brain homeostasis. Science. 2016;353:aad8670. doi: 10.1126/science.aad8670. [DOI] [PubMed] [Google Scholar]
- Mattapallil MJ, Wawrousek EF, Chan CC, Zhao H, Roychoudhury J, Ferguson TA, Caspi RR. The Rd8 mutation of the Crb1 gene is present in vendor lines of C57BL/6N mice and embryonic stem cells, and confounds ocular induced mutant phenotypes. Investigative ophthalmology & visual science. 2012;53:2921–2927. doi: 10.1167/iovs.12-9662. [DOI] [PMC free article] [PubMed] [Google Scholar]
- Mufaddel AA, Al-Hassani GA. Familial idiopathic basal ganglia calcification (Fahr’s disease) Neurosciences (Riyadh) 2014;19:171–177. [PMC free article] [PubMed] [Google Scholar]
- Nelson AB, Kreitzer AC. Reassessing models of basal ganglia function and dysfunction. Annual review of neuroscience. 2014;37:117–135. doi: 10.1146/annurev-neuro-071013-013916. [DOI] [PMC free article] [PubMed] [Google Scholar]
- Nimmerjahn A, Kirchhoff F, Helmchen F. Resting microglial cells are highly dynamic surveillants of brain parenchyma in vivo. Science. 2005;308:1314–1318. doi: 10.1126/science.1110647. [DOI] [PubMed] [Google Scholar]
- Parkhurst CN, Yang G, Ninan I, Savas JN, Yates JR, 3rd, Lafaille JJ, Hempstead BL, Littman DR, Gan WB. Microglia promote learning-dependent synapse formation through brain-derived neurotrophic factor. Cell. 2013;155:1596–1609. doi: 10.1016/j.cell.2013.11.030. [DOI] [PMC free article] [PubMed] [Google Scholar]
- Pascual O, Ben Achour S, Rostaing P, Triller A, Bessis A. Microglia activation triggers astrocyte-mediated modulation of excitatory neurotransmission. Proceedings of the National Academy of Sciences of the United States of America. 2012;109:E197–205. doi: 10.1073/pnas.1111098109. [DOI] [PMC free article] [PubMed] [Google Scholar]
- Pribiag H, Stellwagen D. Neuroimmune regulation of homeostatic synaptic plasticity. Neuropharmacology. 2014;78:13–22. doi: 10.1016/j.neuropharm.2013.06.008. [DOI] [PubMed] [Google Scholar]
- Ransohoff RM, Perry VH. Microglial physiology: unique stimuli, specialized responses. Annual review of immunology. 2009;27:119–145. doi: 10.1146/annurev.immunol.021908.132528. [DOI] [PubMed] [Google Scholar]
- Reemst K, Noctor SC, Lucassen PJ, Hol EM. The Indispensable Roles of Microglia and Astrocytes during Brain Development. Frontiers in human neuroscience. 2016;10:566. doi: 10.3389/fnhum.2016.00566. [DOI] [PMC free article] [PubMed] [Google Scholar]
- Robinson MD, McCarthy DJ, Smyth GK. edgeR: a Bioconductor package for differential expression analysis of digital gene expression data. Bioinformatics. 2010;26:139–140. doi: 10.1093/bioinformatics/btp616. [DOI] [PMC free article] [PubMed] [Google Scholar]
- Schafer DP, Lehrman EK, Kautzman AG, Koyama R, Mardinly AR, Yamasaki R, Ransohoff RM, Greenberg ME, Barres BA, Stevens B. Microglia sculpt postnatal neural circuits in an activity and complement-dependent manner. Neuron. 2012;74:691–705. doi: 10.1016/j.neuron.2012.03.026. [DOI] [PMC free article] [PubMed] [Google Scholar]
- Sharaf A, Krieglstein K, Spittau B. Distribution of microglia in the postnatal murine nigrostriatal system. Cell and tissue research. 2013;351:373–382. doi: 10.1007/s00441-012-1537-y. [DOI] [PubMed] [Google Scholar]
- Sipe GO, Lowery RL, Tremblay ME, Kelly EA, Lamantia CE, Majewska AK. Microglial P2Y12 is necessary for synaptic plasticity in mouse visual cortex. Nature communications. 2016;7:10905. doi: 10.1038/ncomms10905. [DOI] [PMC free article] [PubMed] [Google Scholar]
- Tremblay ME, Lowery RL, Majewska AK. Microglial interactions with synapses are modulated by visual experience. PLoS biology. 2010;8:e1000527. doi: 10.1371/journal.pbio.1000527. [DOI] [PMC free article] [PubMed] [Google Scholar]
- Wills TJ, Muessig L, Cacucci F. The development of spatial behaviour and the hippocampal neural representation of space. Philosophical transactions of the Royal Society of London Series B, Biological sciences. 2014;369:20130409. doi: 10.1098/rstb.2013.0409. [DOI] [PMC free article] [PubMed] [Google Scholar]
- Yang TT, Lin C, Hsu CT, Wang TF, Ke FY, Kuo YM. Differential distribution and activation of microglia in the brain of male C57BL/6J mice. Brain structure & function. 2013;218:1051–1060. doi: 10.1007/s00429-012-0446-x. [DOI] [PubMed] [Google Scholar]
- Zhang Y, Chen K, Sloan SA, Bennett ML, Scholze AR, O’Keeffe S, Phatnani HP, Guarnieri P, Caneda C, Ruderisch N, et al. An RNA-sequencing transcriptome and splicing database of glia, neurons, and vascular cells of the cerebral cortex. The Journal of neuroscience : the official journal of the Society for Neuroscience. 2014;34:11929–11947. doi: 10.1523/JNEUROSCI.1860-14.2014. [DOI] [PMC free article] [PubMed] [Google Scholar]
- Zhou FM, Lee CR. Intrinsic and integrative properties of substantia nigra pars reticulata neurons. Neuroscience. 2011;198:69–94. doi: 10.1016/j.neuroscience.2011.07.061. [DOI] [PMC free article] [PubMed] [Google Scholar]
- Zuchero JB, Barres BA. Glia in mammalian development and disease. Development. 2015;142:3805–3809. doi: 10.1242/dev.129304. [DOI] [PMC free article] [PubMed] [Google Scholar]
Associated Data
This section collects any data citations, data availability statements, or supplementary materials included in this article.
Supplementary Materials
Up-regulated genes for microglia in each region and associated functional annotation.