Significance
The influenza M2 channel is among the smallest proton-selective channels found in nature. High-resolution structures of this channel further our understanding of how protons are transported across a membrane bilayer through a constricted membrane protein environment. This study also has broader implications for the structural interpretation of water in channels using X-ray crystallographic techniques. Previous crystallographic structure determined using synchrotron radiation with cryocooling were biased by the low temperature, and room temperature data collection was limited by radiation damage. These problems have been avoided through room temperature diffraction at an X-ray free-electron laser (XFEL) source.
Keywords: XFEL, proton channel, influenza, membrane protein
Abstract
The M2 proton channel of influenza A is a drug target that is essential for the reproduction of the flu virus. It is also a model system for the study of selective, unidirectional proton transport across a membrane. Ordered water molecules arranged in “wires” inside the channel pore have been proposed to play a role in both the conduction of protons to the four gating His37 residues and the stabilization of multiple positive charges within the channel. To visualize the solvent in the pore of the channel at room temperature while minimizing the effects of radiation damage, data were collected to a resolution of 1.4 Å using an X-ray free-electron laser (XFEL) at three different pH conditions: pH 5.5, pH 6.5, and pH 8.0. Data were collected on the Inwardopen state, which is an intermediate that accumulates at high protonation of the His37 tetrad. At pH 5.5, a continuous hydrogen-bonded network of water molecules spans the vertical length of the channel, consistent with a Grotthuss mechanism model for proton transport to the His37 tetrad. This ordered solvent at pH 5.5 could act to stabilize the positive charges that build up on the gating His37 tetrad during the proton conduction cycle. The number of ordered pore waters decreases at pH 6.5 and 8.0, where the Inwardopen state is less stable. These studies provide a graphical view of the response of water to a change in charge within a restricted channel environment.
Water molecules in transmembrane protein pores participate in the transport of protons across the membrane bilayer. This process has been extensively studied experimentally and through computational simulations, particularly in small channels such as gramicidin A and influenza A M2. The movement of ions through channels is coupled to the diffusion of water through the pore, but protons are transported at a rate that is faster than the diffusion of H3O+ (1, 2). Instead of diffusing through channels, protons move concertedly across networks of hydrogen-bonded waters through what is known as the Grotthuss mechanism (3–5). This mechanism of proton transport was initially discovered by the behavior of water in solution, and it has also been proposed to occur within membrane proteins containing water-filled pores (6–9). The matrix 2 (M2) protein of influenza A is one of the smallest proton-selective channels found in nature. This makes it an ideal system for studying the involvement of water in the selective transport of protons across the membrane.
The M2 protein of influenza A is a tetramer made up of four 97-residue-long monomers. M2 is multifunctional, with different functions lying in different regions of the sequence. Residues 1–22 make up a conserved N-terminal domain that assists the incorporation of M2 into the virion (10) and is absent in influenza B viruses. The transmembrane domain of M2 (residues 22–46) is necessary for tetramerization (11) and forms a proton-selective channel (12–15) that is the target of the adamantane class of drugs, amantadine and rimantadine (11, 16–18). The transmembrane domain of the M2 proton channel (M2TM) (residues 22–46) is the smallest construct of M2 that retains the functionally important conductance features of the full-length protein (16, 17). When constructs of varying length are expressed and biosynthetically inserted into cell membranes, there is no experimentally significant difference in their proton conduction properties so long as the full transmembrane conduction domain (M2TM) is included (16, 17, 19, 20). The regions C-terminal to the TM helices play different important functional roles. An amphiphilic helix formed by residues 46–60 induces membrane curvature and is involved in viral budding and scission (21–23), and an intrinsically disordered C-terminal tail (residues 62–97) interacts with the matrix 1 protein during the packing and budding of new virus particles (24, 25).
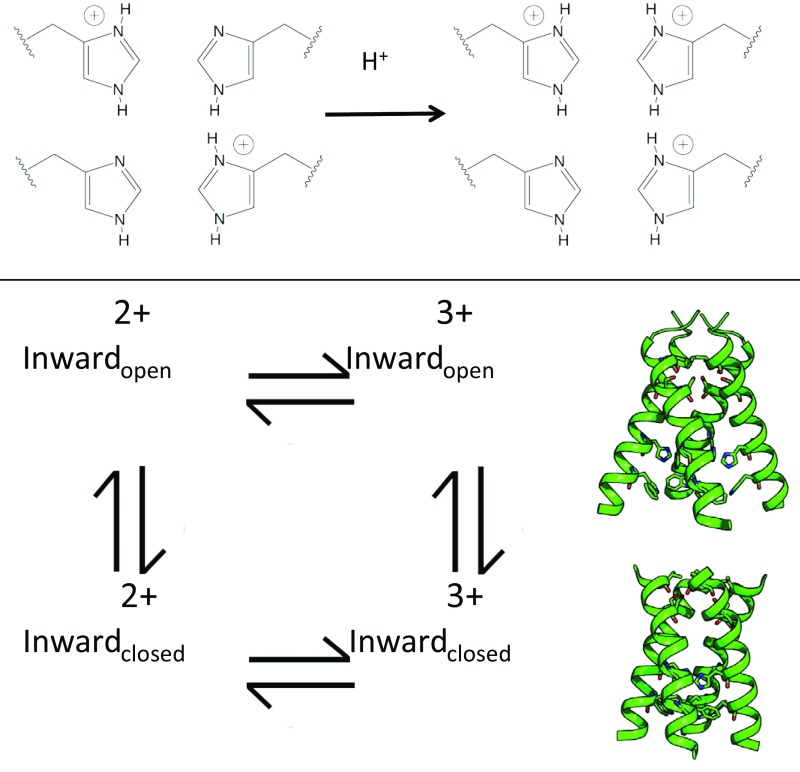
The proton-selective, pH-sensitive gate of the M2 channel consists of residues His37 and Trp41 (26, 27). Four gating histidine residues face the pore of the channel; each His within the gate can be protonated, so the gating His tetrad can have a total charge of 0 to +4, with the charge states existing in equilibrium at a given pH (Fig. S1, Top). The pKa values for adding successive protons to the His tetrad have been experimentally determined using solid-state NMR of samples in phospholipid bilayers (28–32). Although there is some variation of the reported pKa values depending on the type of lipid mimetic used, the first two protonation events occur with a pKa > 6, resulting in a +2 to +3 charge on the gating His tetrad at the pH range of an acidifying endosome. Electrophysiological studies of M2 conductance vs. pH report that a saturation of proton conductance within physiologically relevant pH values occurs at pH ∼ 5.5 (12, 27, 33–35). Both of the experimentally determined pKa values for the protonation of the third gating His residue occur near the midpoint of this saturation curve. Proton conduction is hypothesized to occur as the gating His tetrad cycles from a +2 to a +3 charge state.
Fig. S1.
(Top) The gating His37 tetrad of the M2 channel can have a charge state ranging from neutral to +4. Shown here is the transition from the 2+ to the 3+ charge state, which is hypothesized to occur during the proton transport cycle. (Bottom) The charge states of the His tetrad are in equilibrium, and the Inwardopen conformation is in equilibrium with the Inwardclosed conformation.
Multiple conformations of the M2 conductance domain, which reflect distinct intermediates in the conduction cycle, have been structurally observed by X-ray crystallography (35–38). In one conformation, the C terminus of the channel is splayed open (Inwardopen); in the other, the C terminus adopts a more constricted conformation (Inwardclosed). A conformation with hybrid characteristics has also been determined (35). The Inwardclosed state has also been characterized by solution NMR (39, 40) and solid-state NMR (41, 42) studies under high pH conditions. The Inwardclosed conformation can transition to the Inwardopen conformation by straightening a kink in the TM helix near Gly34 (40, 43, 44). This conformational transition provides a pathway for proton transfer past the Trp41 gate into the viral interior. In NMR studies at low pH, both conformations are observed in equilibrium with one another (40, 43, 44). Molecular dynamics simulations suggest that the Inwardopen and Inwardclosed conformations are in equilibrium, with the channel becoming more open at the C terminus as positive charges accumulate on the His37 gate (45–48).
A recent electrophysiological study (49) using inside-out macropatches of Xenopus laevis oocytes at cytosolic pH values of 5.5, 7.5, and 8.2 has demonstrated the interconversion of the Inwardclosed and the Inwardopen conformations in a transporter-like mechanism (Fig. S1, Bottom). This mechanism also explains the high asymmetry of proton conductance with respect to the proton gradient and the sign of the transmembrane potential (49). Protons flowing toward the interior of the virus enter via the Inwardclosed state and diffuse to the His37 tetrad, which is likely in a +2 state when the pHout is near that of the acidifying endosome (pH 5–6). A permeating proton diffuses through the pore and binds to His37, increasing the total charge of the His37 tetrad to a +3 state. This triggers the formation of the Inwardopen state and ultimately the release of the proton into the interior of the virus. Following transfer of the proton into the viral interior, the protein remains in a metastable Inwardopen state, which must be converted to the Inwardclosed state in a “recycling step.” This recycling step can limit the rate of proton conduction under some conditions.
Here, we examine solvent ordering of water in the pore of M2 within crystals containing only the Inwardopen conformation. By collecting structural data at different pH conditions, we probe the structure of the pore’s water network while varying the charge on the gating His37 tetrad. This allows us to access multiple protonation states of His37 in the Inwardopen state representing the conformation of the His37 tetrad before and following the release of a proton into the viral interior. By trapping the Inwardopen conformation in the crystal lattice, we evaluate the structure of the underprotonated form of His37, which occurs only as a metastable intermediate in membranes. Previously, we reported structures of the M2TM solvent network in this Inwardopen conformation at low and high pH (37), using a conventional synchrotron X-ray source under cryogenic conditions. The 1.10-Å resolution high- and low-pH cryogenic structures showed that the waters within the channel form a continuous hydrogen-bonding network under both pH conditions. This network could contribute to the stabilization of positive charges in the pore. This structure also supports a Grotthuss mechanism for proton transport, which has been proposed as a possible method of proton transport by quantum mechanical and molecular dynamics simulations and on the M2 channel (36, 48, 50–52). However, these 1.10-Å structures were collected under cryogenic conditions that could artificially increase the degree of ordering of the water. Indeed, less order was observed at higher temperature (37), but the diffraction was limited by rapid radiation damage near room temperature. Therefore, the actual arrangement of solvent within the M2 channel pore remained ambiguous.
Here, we have used data collection at an X-ray free-electron laser (XFEL) to circumvent these limitations. In XFEL experiments, the energy of the intense X-ray pulses used is large enough to destroy the sample through the effects of radiation damage (53). However, diffraction occurs on a timescale that is faster than the rate at which radiation damage disrupts the crystal lattice and destroys the sample, effectively giving “diffraction before destruction” (54–56). This allows for data collection at ambient temperature while minimizing the effects of radiation damage on the data. The resulting XFEL datasets provide high-resolution insights into the involvement of ordered waters in proton transport and the stabilization of positive charges in the M2 channel.
Results and Discussion
Comparison of Low-pH XFEL Structure to Synchrotron Structures.
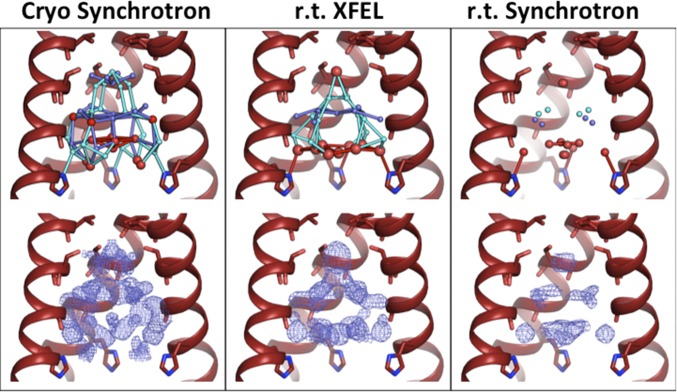
The XFEL structure of M2TM at low pH can be compared with our previous structures collected under the same pH condition using a synchrotron radiation source (Fig. 1). Within the low-pH condition, the previously determined cryogenic synchrotron structure shows the largest number of ordered waters (Table S1) and also the most extensive hydrogen-bonding network, with continuous hydrogen bonds extending throughout the channel from Ser31 to the gating His37 residues. However, the solvent network from the room temperature synchrotron structure contains fewer ordered waters and almost no possible hydrogen bonds to connect those waters. The room temperature XFEL data reveals an intermediate degree of solvent ordering. Fewer ordered waters are observed than in the cryogenic structure. However, unlike the room temperature synchrotron structure, the XFEL data reveal a continuous hydrogen-bonding network that spans the vertical length of the channel pore.
Fig. 1.
Low-pH (pH 5.5) structures of M2TM under cryogenic synchrotron (4QKC, Left), room temperature XFEL (5JOO, Center), and room temperature (r.t.) synchrotron (4QKM, Right) diffraction conditions. (Top) The front helix of each tetramer has been removed; waters are modeled as spheres, with red spheres representing full-occupancy waters and light and dark blue spheres as half-occupancy waters in alternate-occupancy networks A and B. Waters within hydrogen-bonding distance of each other are connected by sticks. The number of ordered waters decreases moving from Left to Right across the figure. (Bottom) Electron density for the pore solvent network (blue mesh) is shown to a contour of 0.5 σ. The largest amount of ordered density is present in the cryogenic synchrotron data collection condition. The volume and shape of the solvent density for the room temperature structures collected using XFEL and synchrotron sources are similar.
Table S1.
Number of modeled waters in the pore region (Val27–His37) of M2 for the structures collected under cryogenic synchrotron, RT synchrotron, and RT XFEL diffraction conditions
| Data collection conditions and PDB code | Full occupancy | Half-occupancy | Total |
| XFEL RT, low pH (5JOO) | 10 | 21 | 20.5 |
| XFEL RT, intermediate pH (5UM1) | 10 | 8 | 14 |
| XFEL RT, high pH (5TTC) | 9 | 4 | 11 |
| Cryogenic low pH (4QKC) | 13 | 34 | 30 |
| Cryogenic high pH (4QK7) | 9 | 34 | 28 |
| RT, low pH (4QKM) | 10 | 8 | 14 |
| RT, high pH (4QKL) | 15 | 8 | 19 |
Total waters are equal to the number of full-occupancy waters plus one-half of the number of half-occupancy waters. For waters located on the fourfold axis of symmetry at the center of the channel, one full-occupancy water is equivalent to four 0.25-occupancy waters, and one half-occupancy water is equivalent to four 0.125-occupancy waters.
The room temperature data from both XFEL and synchrotron sources have pore solvent electron density with a similar shape. In both density maps, there are three layers of solvent density arranged in a pyramid-like shape. This pattern differs from the density observed in the cryogenic synchrotron structure, which contains a larger volume of electron density from ordered solvent. The topmost layer of waters near Ser31 consists of a single full-occupancy water at the center of the channel, which is observed in both of the room temperature structures. Similarly, in the middle solvent layer near Gly34 and the bottom layer immediately above His37, the waters are located in similar positions. However, the XFEL structure can be modeled with additional ordered waters in these layers.
Comparison of High-pH XFEL Structure to Synchrotron Structures.
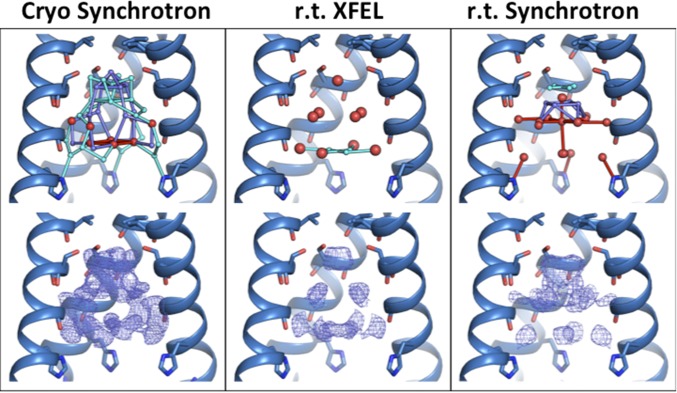
The trends observed comparing the high-pH datasets from XFEL and synchrotron sources are similar to those observed at low pH (Fig. 2). Again, the cryogenic synchrotron structure contains the largest number of modeled ordered waters (Table S1) and, correspondingly, the largest volume of solvent electron density. In both room temperature structures, the waters are separated into three layers. Here, a slightly larger number of ordered waters is present in the room temperature synchrotron structure relative to the room temperature XFEL structure. The total number of ordered solvent molecules and the shape of their resulting electron density is similar for both of the room temperature datasets.
Fig. 2.
High-pH (pH 8.0) structures of M2TM under cryogenic synchrotron (4QK7, Left), room temperature (r.t.) XFEL (5TTC, Center), and room temperature synchrotron (4QKL, Right) diffraction conditions. Waters are shown as spheres (red, full occupancy; light and dark blue, half-occupancy); potential hydrogen bonds are shown as sticks. (Top) The largest number of ordered waters is found in the cryogenic synchrotron diffraction condition; fewer ordered waters are present at room temperature. (Bottom) Electron density for the pore solvent network (blue mesh) is shown to a contour of 0.5 σ. The largest amount of ordered solvent electron density is observed under cryogenic diffraction conditions; the volume and shape of the solvent density for the two room temperature conditions are similar.
The high-pH XFEL structure has a solvent network that consists of mostly full-occupancy waters. These are again separated into three layers, but here there are no hydrogen bonds vertically connecting the layers. The only hydrogen bonds that can be formed within the pore water network are between the waters in the bottom layer above the His37 gate. These waters are not within hydrogen-bonding distance of the His37 side chains.
XFEL Datasets Avoid Artifacts from Both Cryocooling and Radiation Damage.
Our data suggest that the previous structures collected at a conventional synchrotron X-ray source likely suffer from experimental artifacts. In both high- and low-pH conditions, the volume of ordered solvent observed at cryogenic temperatures is much higher than the amount observed in any of the room temperature structures. This reflects tightened enthalpically favored water distributions within the pore induced by freezing the crystals at 100 K (57). The decreased solvent ordering when diffracting at room temperature using a synchrotron source likely reflects resolution-limiting radiation damage. Collecting room temperature data using an XFEL source avoids the effects of both sets of potential experimental artifacts.
Continuous Hydrogen-Bonding Network at Low pH.
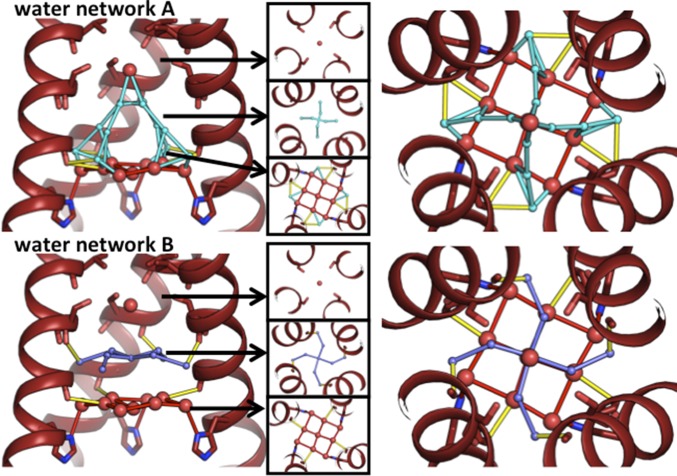
In the low-pH XFEL structure, the ordered waters within the pore form three layers (Fig. 3): a top layer near Ser31, a middle layer near Gly34, and a bottom layer above the His37 gate. The top and bottom layers consist of mostly full-occupancy waters, while many of the waters in the middle layer are modeled as partial occupancy. In the topmost layer of waters, the Ser31 side chain is not within hydrogen-bonding distance of the single water, which is consistent with the fact that this residue can accept a wide range of substitutions to small polar residues with retention of the proton conduction activity (58). In the bottom layer, the pore waters are positioned to act as either hydrogen bond donors or acceptors immediately above His37. The hydrogen-bonding interactions formed by the waters in the bottom solvent layer could stabilize positive charges on the gating His residues, or they could connect the hydrogen-bonded water wire formed by alternate-occupancy network A to a neutral His residue. The pore solvent network has more hydrogen bond-donating interactions with the protein than potential hydrogen bond-accepting interactions, which is consistent with our previously observed structures (37).
Fig. 3.
Alternate-occupancy water networks in the low-pH (pH 5.5) room temperature XFEL structure (5JOO). Full-occupancy waters are red, waters from alternate-occupancy network A are cyan, and waters from alternate-occupancy network B are dark blue. Waters within hydrogen-bonding distance of each other are connected by sticks; yellow sticks indicate hydrogen bonds that can be made between the solvent network and protein carbonyls. (Left) Side view of solvent from alternate-occupancy network A (Top) and B (Bottom), with top-down views of the three layers of water in the pore. (Right) Top-down view of all three layers of water in alternate-occupancy network A (Top) and B (Bottom).
The partial occupancy solvent molecules of the low-pH XFEL structure can be grouped into two self-consistent “alternate-occupancy” networks. “A” and “B” are the minimum number of networks needed to explain the crystallographic positions of the half-occupancy waters within the symmetry constraints of the I4 space group; the waters within network A are too close to those in network B for both to coexist simultaneously. The previously collected single-crystal synchrotron data on this crystal form (37) have been refined with P1 symmetry with no differences observed in the electron density for the protein or the pore water network. From this, we conclude that any possible asymmetric structural features in the water network are averaged within the crystal lattice.
The hydrogen bonds that can be formed by waters from alternate-occupancy networks A and B are shown in Fig. 3. Note that, in the middle layer of waters within network A, 90° rotation about the fourfold crystallographic axis of symmetry produces two clashing interactions and two hydrogen bonds. The waters modeled in this location likely exist as a dimer whose electron density is averaged across the fourfold axis of symmetry. Within alternate-occupancy network A, a continuous chain of hydrogen bonds connects waters from the top of the water network to the gating His37 residues. In contrast, the waters in alternate-occupancy network B do not form hydrogen bonds to vertically connect the three layers of waters. The chain of hydrogen bonds that spans the length of the channel from Ser31 to the gating His37 residues in alternate-occupancy network A is consistent with a continuous pathway for a proton to be shuttled from the top of the network to the gating His37 residues via the Grotthuss transport mechanism.
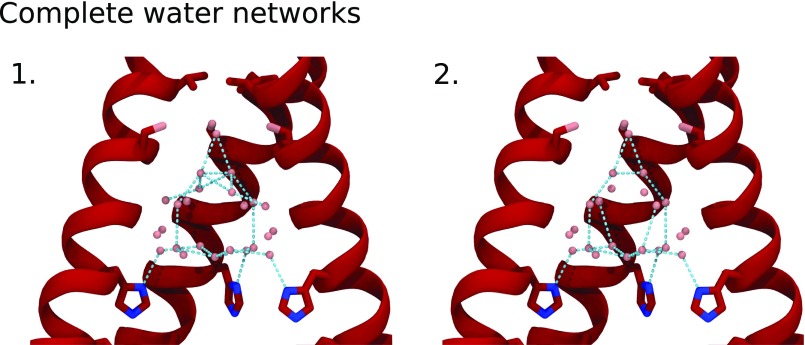
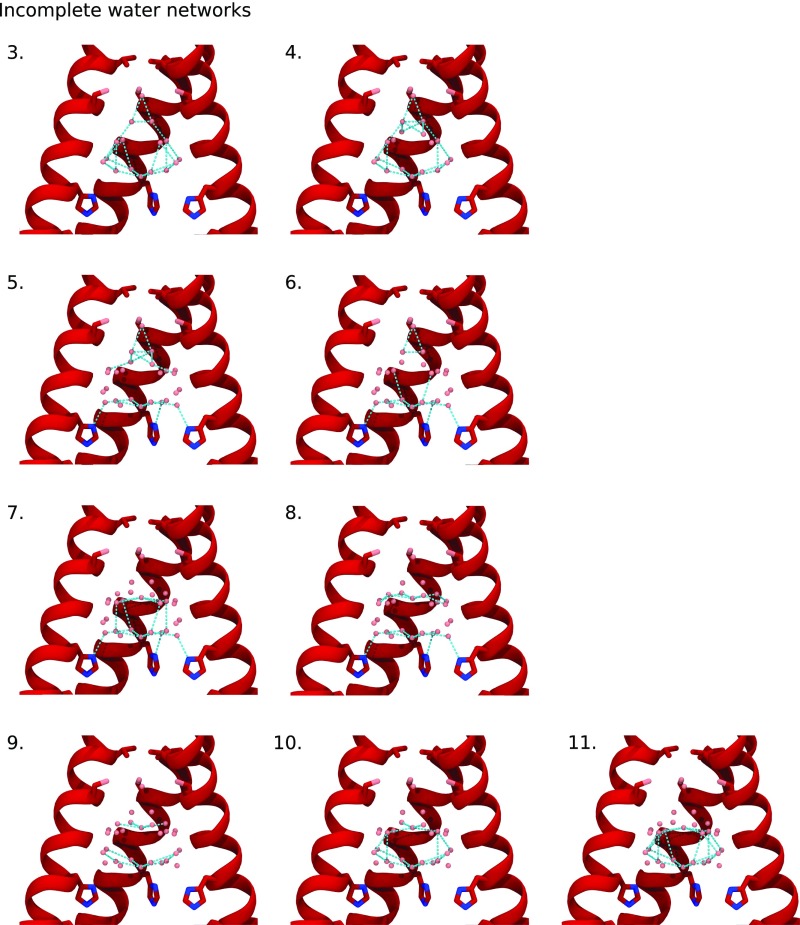
The two alternative networks discussed above represent only two possible interpretations of the ensemble average of all possible water networks within the channel averaged by the fourfold symmetry of the crystal lattice. To examine all possible symmetric and asymmetric water networks that contribute to the observed density, we used graph theory to extract all possible water networks from the crystallographic water positions from the low-pH XFEL structure. Each water molecule represented a node in the graph, and all possible cliques were extracted and filtered for symmetry and total occupancy. We identified 11 unique hydrogen-bonding networks (Figs. S2 and S3), among which only two formed a continuous water wire that would connect a potential hydronium molecule at the top of the water network to one of the four gating His37 residues.
Fig. S2.
Possible water networks 1 and 2 form a continuous chain of hydrogen bonds from the top of the water network to the gating His37 residues.
Fig. S3.
Possible water networks 3–11 form hydrogen bonds that do not continuously link the top of the water network to the gating His37 residues.
Intermediate-pH XFEL Structure Compared with Previous Structures.
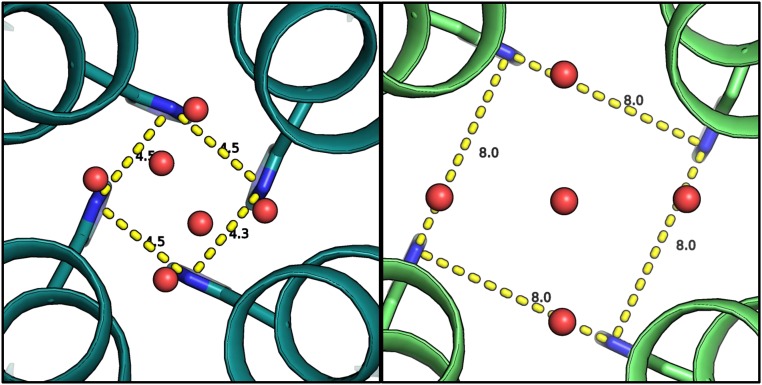
The intermediate-pH (6.5) XFEL structure can be compared with a previous structure collected at a conventional synchrotron source under cryogenic diffraction conditions; in the structure from Acharya et al. (36), the channel adopts the Inwardclosed conformation. Comparison of the two structures reveals that the same general arrangement of solvent layers is observed in both conformational states, although the solvent molecules hydrogen bonded to His37 move away from the central axis by 1.4 Å of the channel in the Inwardopen state (Fig. S4). The radial distances increase from 3.2 Å in the Inwardclosed conformation to 4.6 Å in the Inwardopen conformation. Thus, as the C terminus of the channel dilates to form the Inwardopen conformation, the solvent network within the channel also expands. Interestingly, the degree of dilation is close to the van der Waals radius of a single water molecule.
Fig. S4.
Solvent layer above His37 in the cryogenic structure of the Inwardclosed conformation at pH 6.5 [3LBW (36), Left] and the RT XFEL structure at pH 6.5. The distance between the His37 residues increases from 4.5 to 8.0 Å, and the water network expands.
XFEL Structures at Low, Intermediate, and High pH.
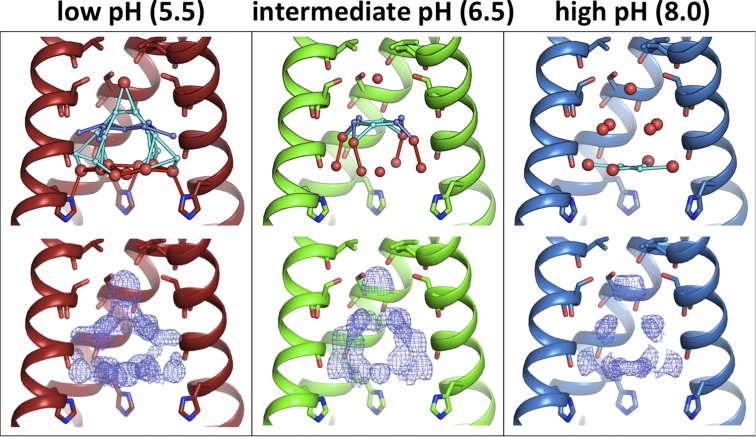
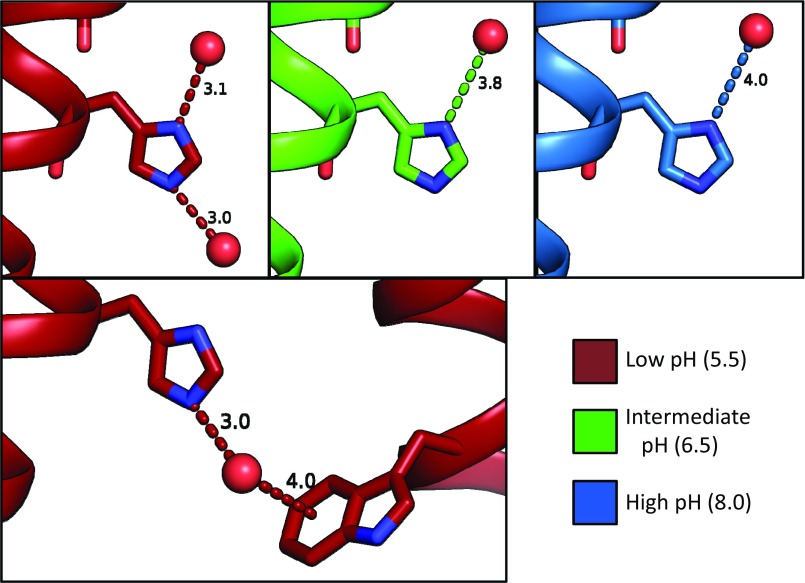
The maximally conducting low pH 5.5 condition has the largest volume of ordered solvent electron density, the largest number of ordered waters (Table S1), and also the most extensive hydrogen-bonding network, with solvent ordering decreasing at intermediate and high pH (Fig. 4). A continuous hydrogen-bonding network is only observed in the low-pH condition and could be consistent with a Grotthuss transport mechanism for proton transport when the channel is at maximally conducting pH conditions. The intermediate pH 6.5 condition shows fewer ordered waters relative to the low-pH state. At intermediate pH, the hydrogen-bonding network spans roughly one-half of the vertical length of the channel pore. The solvent network in the high pH 8.0 condition has more diffuse electron density and the fewest number of ordered waters; at high pH, these waters do not make any hydrogen bonds in a vertical direction. Examining the bottom water layer just above the gating His37 residue reveals that hydrogen bonds between His37 and solvent are only observed in the low-pH condition. At low pH, both the delta and epsilon nitrogens are within 3 Å of an ordered water molecule, but at intermediate and high pH the bottom layer of solvent is too far away from His37 for a hydrogen bond to be formed (Fig. S5).
Fig. 4.
Room temperature XFEL structures of M2TM under all pH conditions: low (pH 5.5, 5JOO, red), intermediate (pH 6.5, 5UM1, green), and high (pH 8.0, 5TTC, blue). Waters are shown as spheres (red, full occupancy; light and dark blue, half-occupancy); potential hydrogen bonds are shown as sticks. (Top) The most ordered waters are observed under the low-pH condition, with fewer waters present at intermediate pH and the smallest number of ordered waters at high pH. Moving from low to high pH, the number of half-occupancy waters decreases and the hydrogen-bonding network becomes less complex. (Bottom) Electron density for the pore solvent network (blue mesh) is shown to a contour of 0.5 σ. The same trend is observed from the electron density maps; the largest volume of solvent density is at low pH, and the smallest volume is at high pH.
Fig. S5.
Distance of waters from His37 residues in XFEL structures at high (8.0), intermediate (6.5), and low (5.5) pH, measured in angstroms. (Top) Side view of one monomer; only the waters in the low-pH XFEL structure are close enough to form hydrogen bonds with His37. (Bottom) The water hydrogen bonding to the epsilon nitrogen of His37 is positioned close enough to the Trp41 of an adjacent monomer to form a cation–pi interaction.
Implications for Proton Conduction.
The conduction of protons through the M2 channel conforms to a transporter-like mechanism in which protonation leads to a conformational change from the Inwardclosed to the Inwardopen state. When a proton passes to the other side of the His37 gate, deprotonation occurs and the channel cycles from the Inwardopen state back to its initial Inwardclosed conformation. Electrophysiological studies have resolved intermediates in the mechanism that reflect these two limiting conformational states (Inwardopen and Inwardclosed) at two different protonation states (49). These states differ in the ease of proton diffusion through the N-terminal as well as the C-terminal ends of the channel, which can be understood in terms of reciprocal opening of the His37 tetrad in parallel with the closing of the Val27 gate.
Under physiological conditions in the acidifying endosome, the protein is predominantly in the Inwardclosed state with an open Val27 gate. This allows rapid equilibration of the His37 gate with the external pH (pHout), but not the pHin. As the pH decreases, His37 reaches a threshold protonation state (probably to +3), which destabilizes packing of His37 residues in the Inwardclosed state and enables transient population of a Inwardopen conformation. The Inwardopen conformation can now equilibrate with the higher pHin leading to the formation of a metastable Inwardopen conformation with one fewer protons bound to the His37 tetrad. The process of inward deprotonation of His37 and recycling of the Inwardopen conformation to the Inwardclosed conformation is sufficiently slow to constitute the rate-limiting step under some conditions.
The ability to crystallize M2TM in the Inwardopen configuration over a wide range of pH conditions allows us to examine the protonated state of His37 after the conformational transition from the Inwardclosed state, as well as the metastable intermediate that occurs following release of the proton to the interior of the virus.
At low pH, the solvent is well ordered and there are multiple pathways to enable rapid proton diffusion and enthalpic stabilization throughout the lumen of the channel reaching to Val27, particularly in the vicinity of His37 and Gly34. This finding is consistent with solid-state NMR (59), molecular dynamics (45), and 2D IR studies (60), which show increased hydration and proton diffusion when the His37 tetrad is highly protonated. In contrast, the extent of ordered solvent decreases as the pH is increased (Fig. 4 and Table S1). These findings clearly show that the water structure seen in the low-pH form of the Inwardopen plays an important role in stabilizing charge in the highly protonated His37 state. Furthermore, these findings indicate that this stabilizing network is lost following the loss of a proton to create the metastable deprotonated state. This loss of specific hydration might contribute to lowering the activation energy for returning to the resting Inwardclosed state during the conduction cycle.
Materials and Methods
The M2TM transmembrane domain (residues 22–46) was reconstituted into the lipidic cubic phase (LCP) (61, 62), and I4 crystals were grown as previously described (37). M2 crystals in concentrations ranging from 106 to 109 crystals per milliliter grew in a sponge phase slurry and were pooled into milliliter quantities (Fig. S6), and then monoolein was added to increase the viscosity of the sample. Preliminary diffraction experiments were carried out at the Linac Coherent Light Source (LCLS) to diffract mounted single crystals and microcrystals grown on grids (63).
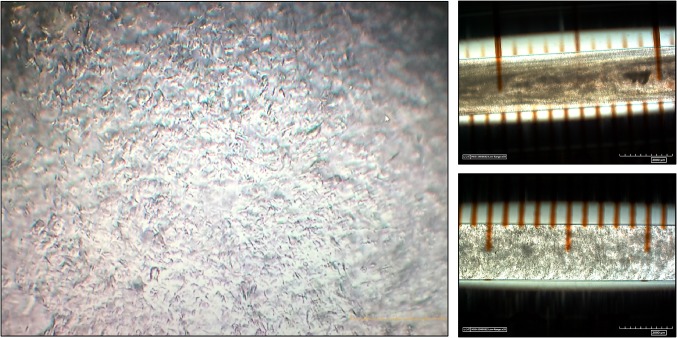
Fig. S6.
(Left) Visible light image of square M2TM (22–46) microcrystals at a concentration of over 1 × 10⁹ per milliliter. (Right) Visible light image of glass syringes full of pooled M2 microcrystals.
XFEL data collection techniques were used to obtain room temperature structures of the M2 channel with minimal radiation damage. By using serial diffraction techniques, we are able to observe the ensemble average of the M2 channel’s water network over tens of thousands of crystals per dataset. The XFEL datasets described in this paper were collected using a Diverse Application Platform for Hard X-Ray Diffraction in SACLA (DAPHNIS) (64) at SPring-8 Angstrom Compact Free-Electron Laser (SACLA) beamline BL3 using a 1.1587-Å beam with a pulse rate of 30 Hz and a multiport charge-coupled device (MPCCD) detector. An LCP injection system (65) was used to continuously deliver sample to the XFEL beam. Three pH conditions were examined: pH 5.5, “low-pH” state, PDB ID code 5JOO (Dataset S1); pH 6.5, “intermediate-pH” state, PDB ID code 5UM1 (Dataset S2); and pH 8.0, “high-pH” state, PDB ID code 5TTC (Dataset S3).
Frames of data containing diffraction patterns were identified using Cheetah (66, 67). Indexing and integration were done using cctbx.xfel (68). Postrefinement and merging were carried out in cctbx.prime (69) (Table S2), and the Brehm and Diederichs algorithm (70) was used to resolve the indexing ambiguity resulting from the I4 space group of the diffracted crystals (Table S3). Molecular replacement and refinement were performed using Phenix (71) (Table S4).
Table S2.
Data processing statistics for RT XFEL datasets
| Data processing | Low pH (5.5) | Intermediate pH (6.5) | High pH (8.0) |
| PDB ID code | 5JOO | 5UM1 | 5TTC |
| Space group | I4 | I4 | I4 |
| Unit cell, Å | 30.1, 30.1, 67.4 | 29.9, 29.9, 67.8 | 29.8, 29.8, 68.0 |
| Resolution range, Å | 1.4–27.45 (1.40–1.42) | 1.45–27.35 (1.45–1.48) | 1.4–27.32 (1.40–1.42) |
| No. of frames | 34,113 | 29,173 | 64,249 |
| Unique reflections | 5,922 | 5,297 | 5,886 |
| Completeness, % | 100 | 100 | 100 |
| Redundancy | 622.87 (177.22) | 624.00 (92.86) | 1,356.36 (73.57) |
| CC1/2 | 0.9540 (0.5266) | 0.9228 (0.5020) | 0.9996 (0.3075) |
| Rsplit | 0.1172 (0.6464) | 0.1016 (0.7420) | 0.0235 (0.1724) |
Postrefinement with Prime calculates I/σ(I) after the integrated intensities are postrefined and merged; scale/partiality factors are applied the SDs of individual partial observations (sigI) including inflation factors (Uervirojnangkoorn et al., 2015, their equation 21) (69). This is different from sigma values from CrystFEL, which are calculated as population sigma, not by error propagation from sigmas of individual partial observations. This results in results in lower I/σ(I) in the highest-resolution shell compared with traditional methods of refinement. As a result, I/σ(I) is not an appropriate statistic in this shell. Data in successively higher-resolution shells were included in a series of refinements as long as CC1/2 was greater than 0.50, and an improvement in Rfree was observed following the procedure of Karplus and Diederichs (72).
Table S3.
Estimated twin fractions for RT XFEL datasets after correction of indexing ambiguity
| Twin test | Low pH (5.5) | Intermediate pH (6.5) | High pH (8.0) |
| Britton analyses | 0.057 | 0.091 | 0.072 |
| H test | 0.185 | 0.244 | 0.166 |
| Maximum-likelihood method | 0.026 | 0.068 | 0.043 |
Table S4.
Refinement statistics for RT XFEL structures
| Refinement | Low pH (5.5) | Intermediate pH (6.5) | High pH (8.0) |
| PDB ID code | 5JOO | 5UM1 | 5TTC |
| Resolution range, Å | 21.25–1.40 | 21.13–1.45 | 21.09–1.40 |
| Reflections refined against | 5,401 | 4,643 | 5,885 |
| Completeness (working + test), % | 94.06 | 87.8 | 99.98 |
| Rwork | 0.2043 | 0.2128 | 0.1981 |
| Rfree | 0.2373 | 0.2296 | 0.2289 |
| No. of nonhydrogen atoms | 226 | 218 | 221 |
| Macromolecules | 192 | 192 | 192 |
| Ligands | 7 | 7 | 7 |
| Water | 25 | 20 | 20 |
| Ramachandran plot favored, % | 100 | 100 | 100 |
| RMS deviations (bonds, Å) | 0.003 | 0.003 | 0.003 |
| RMS deviations (angles, °) | 0.622 | 0.572 | 0.622 |
| Average B factor, Å2 | 21.5 | 27.8 | 21.2 |
| Macromolecules, Å2 | 19 | 26.7 | 19.3 |
| Ligands, Å2 | 18.4 | 26 | 17.4 |
| Solvent, Å2 | 40.4 | 39.2 | 38.8 |
The high- and low-pH datasets are complete to a resolution of 1.40 Å, which was the detector-limited resolution. The intermediate-pH condition was truncated to 1.45 Å because the crystals at this pH condition diffracted to a slightly lower resolution on average. CC1/2 and paired refinement (72, 73) were used to determine the maximum resolution. The water network analysis at low pH was carried out using the NetworkX library in Python (74).
SI Materials and Methods
Peptide Synthesis, Purification, and Reconstitution into Lipid.
Influenza A M2TM (22–46) (Ac-SSDPLVVAASIIGILHLILWILDRL-NH3) was manually synthesized, purified, and reconstituted into the lipidic cubic phase (LCP), and then crystals were grown as previously described (37).
Microcrystal Optimization.
Large concentrations of microcrystals are needed for XFEL experiments. Attempts were made to scale up crystal growth in syringes according to Cherezov’s method (62), but under these conditions the LCP remained separated from the precipitant solution and did not expand into the sponge phase that is necessary for I4 symmetry M2 crystals to form. Instead, a protocol was made to increase the scale of the crystal drops from the initial 96-well conditions. First, the concentration of peptide in the LCP was increased from the initial condition of ≈1 mM peptide in LCP to ≈12 mM peptide in LCP. One microliter of LCP was dispensed onto a screw-cap crystallization support (Qiagen), and then 2 μL of crystallization solution were added on top of the LCP. The crystallization support was screwed into the well to create a hanging drop above an empty reservoir. Exposing the hanging drop to the air inside the sealed crystallization well allowed the LCP to expand into the sponge phase and create a high concentration of M2 crystals. The solution containing these crystals was pipetted into syringes and stored at −20 °C.
The composition of the crystal solution was as follows: LCP: 60% monoolein, 40% 50 mM OG in water, 12 mM M2TM (22–46); precipitant solution: 0.2 M CaCl2, 44% PEG 400, plus either 0.1 M Tris, pH 8.0, or 0.1 M Tris, pH 6.5, or 0.1 M Mes, pH 5.5, depending on the desired pH condition. Crystals formed at a LCP:ppt solution ratio of 1:2.
Because crystals formed after the LCP transitioned into a sponge phase with an oil-like consistency, the sample’s viscosity was increased to make it compatible with an LCP injection system. Monoolein was added to the crystal-containing solution at a 1:1–2:1 ratio and mixed using a metal syringe coupler. The crystals within the sample were stable after the addition of monoolein, with no damage to the crystals observed immediately after mixing or after storing the sponge phase/monoolein mixture for multiple days. Before data collection, the pH of the sample was confirmed using a pH meter and pH paper. For the high-pH sample, the pH was adjusted by adding Tris, pH 8.5, precipitant solution (described above) and using a syringe coupler to homogenize the sample.
XFEL Data Collection.
Preliminary data were collected at the Linac Coherent Light Source (LCLS) at the SLAC National Accelerator Laboratory; these data consisted of frames of data from fixed target data collection and also frames of data from crystallization on goniometer-mountable grids (63).
Data collection was carried out at ambient temperature (20 °C) at SACLA in Hyogo, Japan, using SACLA BL3. Data were collected continuously with a pulse repetition rate of 30 Hz in a helium chamber using an LCP injector to flow crystals to the beam. The injector nozzle size was 100 µm, and the sample flow rate was 0.42 µL/min. The beam size used was 1.5 μm; the beam stop was 3 mm. For the low- and intermediate-pH datasets, the beam energy was 10.7 keV, which in combination with the multiport charge-coupled device (MPCCD) detector geometry limited the resolution of the data to 1.4 Å. Hit rates ranged from 3% to 10% for these samples. The high-pH dataset was collected using SACLA’s LCP injection system in a He chamber with a beam energy of 10.5 keV. Hit rates ranged from 30% to 70% because of the high-pH sample’s large concentration of crystals. A portion of the diffraction from each dataset was collected using a 0.025-mm Al attenuator so that low-resolution spots could be observed without saturating the detector signal.
Data Processing.
Frames of data containing diffraction were identified using Cheetah (66, 67). Indexing and integration were done using cctbx.xfel (68) on dark-subtracted images. The Brehm and Diederichs algorithm (70) was used to resolve the indexing ambiguity resulting from the I4 space group of the diffracted crystals. Table S3 lists the predicted twin fraction for the datasets after this correction was applied. The number of frames used for data processing in each pH condition is as follows: 34,113 frames at low pH, 29,173 frames at intermediate pH, and 64,249 frames at high pH. Postrefinement and merging were carried out with cctbx.prime (69). Resolution cutoffs were determined by monitoring CC1/2 and Rfree in paired refinements following the procedure of Karplus and Diederichs (72). For the high- and low-pH conditions, the 1.40-Å resolution cutoff was limited only by the detector. The intermediate-pH condition data were truncated to 1.45 Å because the crystals prepared in this pH condition diffracted to a slightly lower resolution on average.
Molecular Replacement and Refinement.
Molecular replacement and refinement were carried out in Phenix (71). The model used for molecular replacement was PDB structure 4QK7. The inclusion of alternate side-chain conformers did not significantly improve the fit of the model to the electron density, so these were omitted in the final model. Waters were added to the model where positive Fo-Fc indicated they should be; those that occupied smaller Fo-Fc density peaks were modeled as half occupancy, creating alternate-occupancy water networks A and B. Solvent and ions located on the axis of fourfold symmetry at the center of the channel were modeled as having an occupancy of 0.25.
R and free R factors are poorer for the XFEL structures relative to previous structures from synchrotron diffraction experiments because of the difficulty of getting good intensity estimates from serial diffraction. The same effect can be seen in Uervirojnangkoorn et al. (69), where myoglobin data at 1.45 Å yields R factors comparable with the ones presented in this work. Despite the poorer refinement R factors, we observe an increased volume of solvent electron density in the room temperature (RT) XFEL structures relative to the RT synchrotron structures. This is likely an effect of minimizing radiation damage.
RMSDs to Previous Structures.
RMSDs were calculated for all main-chain and side-chain atoms, excluding solvent and ions.
Monomer RMSDs were as follows: low pH: 5JOO to 4QKM (0.091 Å), 5JOO to 4QKC (0.155 Å); high pH: 5TTC to 4QKL (0.081 Å), 5TTC to 4QK7 (0.179 Å). Tetramer RMSDs were as follows: low pH: 5JOO to 4QKM (0.194 Å), 5JOO to 4QKC (0.192 Å); high pH: 5TTC to 4QKL (0.147 Å), 5TTC to 4QK7 (0.241 Å).
Analysis of Hydrogen-Bonding Networks in the Low-pH XFEL Structure.
The water network analysis at low pH was carried out using the NetworkX library in Python (74). Each water molecule corresponded to one node in the graph. An edge connected two nodes if they were at least 2.6 Å apart. The largest cliques that contained water molecules with partial occupancy were then extracted. The corresponding networks were finally filtered for symmetry and consistent total occupancy.
Supplementary Material
Acknowledgments
We acknowledge computational support from SACLA high-performance computing system and Mini-K supercomputer system. J.L.T., W.F.D., and experimental work were supported by NIH Grants GM122603 and GM117593. N.K.S. acknowledges NIH Grant GM117126 for computational methods. R.A.W. is supported by the National Science Foundation (NSF) Graduate Research Fellowship Program; J.S.F. is a Searle Scholar, Pew Scholar, and Packard Fellow, and is supported by NIH Grants OD009180 and GM110580 and NSF Grant STC-1231306. S.I., O.N., and F.Y. were supported by the X-Ray Free-Electron Laser Priority Strategy Program (Ministry of Education, Culture, Sports, Science and Technology). Use of the LCP crystallization robot was made possible by National Center for Research Resources Grant 1S10RR027234-01. Preliminary XFEL diffraction experiments were carried out at Linac Coherent Light Source (LCLS) X-ray pump–probe (Protein Crystal Screening Proposal LG53). Use of the LCLS, SLAC National Accelerator Laboratory, is supported by the US Department of Energy, Office of Science, Office of Basic Energy Sciences, under Contract DE-AC02-76SF00515. The XFEL datasets described in this paper were collected at BL3 of SACLA with the approval of the Japan Synchrotron Radiation Research Institute (Proposals 2015A8048, 2015B8028, and 2016A8030).
Footnotes
The authors declare no conflict of interest.
This article is a PNAS Direct Submission.
Data deposition: The atomic coordinates and structure factors have been deposited in the Protein Data Bank, www.wwpdb.org (PDB ID codes 5JOO, 5UM1, and 5TTC).
This article contains supporting information online at www.pnas.org/lookup/suppl/doi:10.1073/pnas.1705624114/-/DCSupplemental.
References
- 1.Levitt DG, Elias SR, Hautman JM. Number of water molecules coupled to the transport of sodium, potassium and hydrogen ions via gramicidin, nonactin or valinomycin. Biochim Biophys Acta. 1978;512:436–451. doi: 10.1016/0005-2736(78)90266-3. [DOI] [PubMed] [Google Scholar]
- 2.Rosenberg PA, Finkelstein A. Interaction of ions and water in gramicidin A channels: Streaming potentials across lipid bilayer membranes. J Gen Physiol. 1978;72:327–340. doi: 10.1085/jgp.72.3.327. [DOI] [PMC free article] [PubMed] [Google Scholar]
- 3.Agmon N. The Grotthuss mechanism. Chem Phys Lett. 1995;244:456–462. [Google Scholar]
- 4.Bernal JD, Fowler RH. A theory of water and ionic solution, with particular reference to hydrogen and hydroxyl ions. J Chem Phys. 1933;1:515–548. [Google Scholar]
- 5.de Grotthuss CJT. Mémoire sur la décomposition de l’eau et des corps qu’elle tient en dissolution à l’aide de l’électricité galvanique. Ann Chim. 1806;58:54–74. [Google Scholar]
- 6.Brewer ML, Schmitt UW, Voth GA. The formation and dynamics of proton wires in channel environments. Biophys J. 2001;80:1691–1702. doi: 10.1016/S0006-3495(01)76140-1. [DOI] [PMC free article] [PubMed] [Google Scholar]
- 7.Day TJF, Schmitt UW, Voth GA. The mechanism of hydrated proton transport in water. J Am Chem Soc. 2000;122:12027–12028. [Google Scholar]
- 8.Nagle JF, Morowitz HJ. Molecular mechanisms for proton transport in membranes. Proc Natl Acad Sci USA. 1978;75:298–302. doi: 10.1073/pnas.75.1.298. [DOI] [PMC free article] [PubMed] [Google Scholar]
- 9.Pomès R, Roux B. Structure and dynamics of a proton wire: A theoretical study of H+ translocation along the single-file water chain in the gramicidin A channel. Biophys J. 1996;71:19–39. doi: 10.1016/S0006-3495(96)79211-1. [DOI] [PMC free article] [PubMed] [Google Scholar]
- 10.Park EK, Castrucci MR, Portner A, Kawaoka Y. The M2 ectodomain is important for its incorporation into influenza A virions. J Virol. 1998;72:2449–2455. doi: 10.1128/jvi.72.3.2449-2455.1998. [DOI] [PMC free article] [PubMed] [Google Scholar]
- 11.Salom D, Hill BR, Lear JD, DeGrado WF. pH-dependent tetramerization and amantadine binding of the transmembrane helix of M2 from the influenza A virus. Biochemistry. 2000;39:14160–14170. doi: 10.1021/bi001799u. [DOI] [PMC free article] [PubMed] [Google Scholar]
- 12.Chizhmakov IV, et al. Selective proton permeability and pH regulation of the influenza virus M2 channel expressed in mouse erythroleukaemia cells. J Physiol. 1996;494:329–336. doi: 10.1113/jphysiol.1996.sp021495. [DOI] [PMC free article] [PubMed] [Google Scholar]
- 13.Lin TI, Schroeder C. Definitive assignment of proton selectivity and attoampere unitary current to the M2 ion channel protein of influenza A virus. J Virol. 2001;75:3647–3656. doi: 10.1128/JVI.75.8.3647-3656.2001. [DOI] [PMC free article] [PubMed] [Google Scholar]
- 14.Mould JA, et al. Permeation and activation of the M2 ion channel of influenza A virus. J Biol Chem. 2000;275:31038–31050. doi: 10.1074/jbc.M003663200. [DOI] [PubMed] [Google Scholar]
- 15.Shimbo K, Brassard DL, Lamb RA, Pinto LH. Ion selectivity and activation of the M2 ion channel of influenza virus. Biophys J. 1996;70:1335–1346. doi: 10.1016/S0006-3495(96)79690-X. [DOI] [PMC free article] [PubMed] [Google Scholar]
- 16.Duff KC, Ashley RH. The transmembrane domain of influenza A M2 protein forms amantadine-sensitive proton channels in planar lipid bilayers. Virology. 1992;190:485–489. doi: 10.1016/0042-6822(92)91239-q. [DOI] [PubMed] [Google Scholar]
- 17.Ma C, et al. Identification of the functional core of the influenza A virus A/M2 proton-selective ion channel. Proc Natl Acad Sci USA. 2009;106:12283–12288. doi: 10.1073/pnas.0905726106. [DOI] [PMC free article] [PubMed] [Google Scholar]
- 18.Pinto LH, Lamb RA. Controlling influenza virus replication by inhibiting its proton channel. Mol Biosyst. 2007;3:18–23. doi: 10.1039/b611613m. [DOI] [PubMed] [Google Scholar]
- 19.Holsinger LJ, Nichani D, Pinto LH, Lamb RA. Influenza A virus M2 ion channel protein: A structure-function analysis. J Virol. 1994;68:1551–1563. doi: 10.1128/jvi.68.3.1551-1563.1994. [DOI] [PMC free article] [PubMed] [Google Scholar]
- 20.Wang C, Lamb RA, Pinto LH. Direct measurement of the influenza A virus M2 protein ion channel activity in mammalian cells. Virology. 1994;205:133–140. doi: 10.1006/viro.1994.1628. [DOI] [PubMed] [Google Scholar]
- 21.Roberts KL, Leser GP, Ma C, Lamb RA. The amphipathic helix of influenza A virus M2 protein is required for filamentous bud formation and scission of filamentous and spherical particles. J Virol. 2013;87:9973–9982. doi: 10.1128/JVI.01363-13. [DOI] [PMC free article] [PubMed] [Google Scholar]
- 22.Rossman JS, Jing X, Leser GP, Lamb RA. Influenza virus M2 protein mediates ESCRT-independent membrane scission. Cell. 2010;142:902–913. doi: 10.1016/j.cell.2010.08.029. [DOI] [PMC free article] [PubMed] [Google Scholar]
- 23.Schmidt NW, Mishra A, Wang J, DeGrado WF, Wong GCL. Influenza virus A M2 protein generates negative Gaussian membrane curvature necessary for budding and scission. J Am Chem Soc. 2013;135:13710–13719. doi: 10.1021/ja400146z. [DOI] [PMC free article] [PubMed] [Google Scholar]
- 24.Martin K, Helenius A. Nuclear transport of influenza virus ribonucleoproteins: The viral matrix protein (M1) promotes export and inhibits import. Cell. 1991;67:117–130. doi: 10.1016/0092-8674(91)90576-k. [DOI] [PubMed] [Google Scholar]
- 25.McCown MF, Pekosz A. Distinct domains of the influenza A virus M2 protein cytoplasmic tail mediate binding to the M1 protein and facilitate infectious virus production. J Virol. 2006;80:8178–8189. doi: 10.1128/JVI.00627-06. [DOI] [PMC free article] [PubMed] [Google Scholar]
- 26.Tang Y, Zaitseva F, Lamb RA, Pinto LH. The gate of the influenza virus M2 proton channel is formed by a single tryptophan residue. J Biol Chem. 2002;277:39880–39886. doi: 10.1074/jbc.M206582200. [DOI] [PubMed] [Google Scholar]
- 27.Wang C, Lamb RA, Pinto LH. Activation of the M2 ion channel of influenza virus: A role for the transmembrane domain histidine residue. Biophys J. 1995;69:1363–1371. doi: 10.1016/S0006-3495(95)80003-2. [DOI] [PMC free article] [PubMed] [Google Scholar]
- 28.Colvin MT, Andreas LB, Chou JJ, Griffin RG. Proton association constants of His 37 in the Influenza-A M218-60 dimer-of-dimers. Biochemistry. 2014;53:5987–5994. doi: 10.1021/bi5005393. [DOI] [PMC free article] [PubMed] [Google Scholar]
- 29.Hu F, Schmidt-Rohr K, Hong M. NMR detection of pH-dependent histidine-water proton exchange reveals the conduction mechanism of a transmembrane proton channel. J Am Chem Soc. 2012;134:3703–3713. doi: 10.1021/ja2081185. [DOI] [PMC free article] [PubMed] [Google Scholar]
- 30.Hu J, et al. Histidines, heart of the hydrogen ion channel from influenza A virus: Toward an understanding of conductance and proton selectivity. Proc Natl Acad Sci USA. 2006;103:6865–6870. doi: 10.1073/pnas.0601944103. [DOI] [PMC free article] [PubMed] [Google Scholar]
- 31.Liao SY, Yang Y, Tietze D, Hong M. The influenza M2 cytoplasmic tail changes the proton-exchange equilibria and the backbone conformation of the transmembrane histidine residue to facilitate proton conduction. J Am Chem Soc. 2015;137:6067–6077. doi: 10.1021/jacs.5b02510. [DOI] [PMC free article] [PubMed] [Google Scholar]
- 32.Miao Y, Fu R, Zhou H-X, Cross TA. Dynamic short hydrogen bonds in histidine tetrad of full-length M2 proton channel reveal tetrameric structural heterogeneity and functional mechanism. Structure. 2015;23:2300–2308. doi: 10.1016/j.str.2015.09.011. [DOI] [PMC free article] [PubMed] [Google Scholar]
- 33.Leiding T, Wang J, Martinsson J, DeGrado WF, Arsköld SP. Proton and cation transport activity of the M2 proton channel from influenza A virus. Proc Natl Acad Sci USA. 2010;107:15409–15414. doi: 10.1073/pnas.1009997107. [DOI] [PMC free article] [PubMed] [Google Scholar]
- 34.Pielak RM, Chou JJ. Kinetic analysis of the M2 proton conduction of the influenza virus. J Am Chem Soc. 2010;132:17695–17697. doi: 10.1021/ja108458u. [DOI] [PMC free article] [PubMed] [Google Scholar]
- 35.Stouffer AL, et al. Structural basis for the function and inhibition of an influenza virus proton channel. Nature. 2008;451:596–599. doi: 10.1038/nature06528. [DOI] [PMC free article] [PubMed] [Google Scholar]
- 36.Acharya R, et al. Structure and mechanism of proton transport through the transmembrane tetrameric M2 protein bundle of the influenza A virus. Proc Natl Acad Sci USA. 2010;107:15075–15080. doi: 10.1073/pnas.1007071107. [DOI] [PMC free article] [PubMed] [Google Scholar]
- 37.Thomaston JL, et al. High-resolution structures of the M2 channel from influenza A virus reveal dynamic pathways for proton stabilization and transduction. Proc Natl Acad Sci USA. 2015;112:14260–14265. doi: 10.1073/pnas.1518493112. [DOI] [PMC free article] [PubMed] [Google Scholar]
- 38.Thomaston JL, DeGrado WF. Crystal structure of the drug-resistant S31N influenza M2 proton channel. Protein Sci. 2016;25:1551–1554. doi: 10.1002/pro.2937. [DOI] [PMC free article] [PubMed] [Google Scholar]
- 39.Schnell JR, Chou JJ. Structure and mechanism of the M2 proton channel of influenza A virus. Nature. 2008;451:591–595. doi: 10.1038/nature06531. [DOI] [PMC free article] [PubMed] [Google Scholar]
- 40.Wang J, et al. Structure and inhibition of the drug-resistant S31N mutant of the M2 ion channel of influenza A virus. Proc Natl Acad Sci USA. 2013;110:1315–1320. doi: 10.1073/pnas.1216526110. [DOI] [PMC free article] [PubMed] [Google Scholar]
- 41.Cady SD, et al. Structure of the amantadine binding site of influenza M2 proton channels in lipid bilayers. Nature. 2010;463:689–692. doi: 10.1038/nature08722. [DOI] [PMC free article] [PubMed] [Google Scholar]
- 42.Sharma M, et al. Insight into the mechanism of the influenza A proton channel from a structure in a lipid bilayer. Science. 2010;330:509–512. doi: 10.1126/science.1191750. [DOI] [PMC free article] [PubMed] [Google Scholar]
- 43.Hu F, Luo W, Cady SD, Hong M. Conformational plasticity of the influenza A M2 transmembrane helix in lipid bilayers under varying pH, drug binding, and membrane thickness. Biochim Biophys Acta. 2011;1808:415–423. doi: 10.1016/j.bbamem.2010.09.014. [DOI] [PMC free article] [PubMed] [Google Scholar]
- 44.Li C, Qin H, Gao FP, Cross TA. Solid-state NMR characterization of conformational plasticity within the transmembrane domain of the influenza A M2 proton channel. Biochim Biophys Acta. 2007;1768:3162–3170. doi: 10.1016/j.bbamem.2007.08.025. [DOI] [PMC free article] [PubMed] [Google Scholar]
- 45.Khurana E, et al. Molecular dynamics calculations suggest a conduction mechanism for the M2 proton channel from influenza A virus. Proc Natl Acad Sci USA. 2009;106:1069–1074. doi: 10.1073/pnas.0811720106. [DOI] [PMC free article] [PubMed] [Google Scholar]
- 46.Liang R, Li H, Swanson JMJ, Voth GA. Multiscale simulation reveals a multifaceted mechanism of proton permeation through the influenza A M2 proton channel. Proc Natl Acad Sci USA. 2014;111:9396–9401. doi: 10.1073/pnas.1401997111. [DOI] [PMC free article] [PubMed] [Google Scholar]
- 47.Liang R, et al. Acid activation mechanism of the influenza A M2 proton channel. Proc Natl Acad Sci USA. 2016;113:E6955–E6964. doi: 10.1073/pnas.1615471113. [DOI] [PMC free article] [PubMed] [Google Scholar]
- 48.Yi M, Cross TA, Zhou HX. A secondary gate as a mechanism for inhibition of the M2 proton channel by amantadine. J Phys Chem B. 2008;112:7977–7979. doi: 10.1021/jp800171m. [DOI] [PMC free article] [PubMed] [Google Scholar]
- 49.DiFrancesco ML, Hansen U-P, Thiel G, Moroni A, Schroeder I. Effect of cytosolic pH on inward currents reveals structural characteristics of the proton transport cycle in the influenza A protein M2 in cell-free membrane patches of Xenopus oocytes. PLoS One. 2014;9:e107406. doi: 10.1371/journal.pone.0107406. [DOI] [PMC free article] [PubMed] [Google Scholar]
- 50.Carnevale V, Fiorin G, Levine BG, Degrado WF, Klein ML. Multiple proton confinement in the M2 channel from the influenza A virus. J Phys Chem C Nanomater Interfaces. 2010;114:20856–20863. doi: 10.1021/jp107431g. [DOI] [PMC free article] [PubMed] [Google Scholar]
- 51.Chen H, Wu Y, Voth GA. Proton transport behavior through the influenza A M2 channel: Insights from molecular simulation. Biophys J. 2007;93:3470–3479. doi: 10.1529/biophysj.107.105742. [DOI] [PMC free article] [PubMed] [Google Scholar]
- 52.Wei C, Pohorille A. Activation and proton transport mechanism in influenza A M2 channel. Biophys J. 2013;105:2036–2045. doi: 10.1016/j.bpj.2013.08.030. [DOI] [PMC free article] [PubMed] [Google Scholar]
- 53.Lomb L, et al. Radiation damage in protein serial femtosecond crystallography using an x-ray free-electron laser. Phys Rev B. 2011;84:214111. doi: 10.1103/PhysRevB.84.214111. [DOI] [PMC free article] [PubMed] [Google Scholar]
- 54.Barty A, et al. Self-terminating diffraction gates femtosecond X-ray nanocrystallography measurements. Nat Photonics. 2012;6:35–40. doi: 10.1038/nphoton.2011.297. [DOI] [PMC free article] [PubMed] [Google Scholar]
- 55.Chapman HN, et al. Femtosecond X-ray protein nanocrystallography. Nature. 2011;470:73–77. doi: 10.1038/nature09750. [DOI] [PMC free article] [PubMed] [Google Scholar]
- 56.Neutze R, Wouts R, van der Spoel D, Weckert E, Hajdu J. Potential for biomolecular imaging with femtosecond X-ray pulses. Nature. 2000;406:752–757. doi: 10.1038/35021099. [DOI] [PubMed] [Google Scholar]
- 57.Halle B. Biomolecular cryocrystallography: Structural changes during flash-cooling. Proc Natl Acad Sci USA. 2004;101:4793–4798. doi: 10.1073/pnas.0308315101. [DOI] [PMC free article] [PubMed] [Google Scholar]
- 58.Balannik V, et al. Functional studies and modeling of pore-lining residue mutants of the influenza A virus M2 ion channel. Biochemistry. 2010;49:696–708. doi: 10.1021/bi901799k. [DOI] [PMC free article] [PubMed] [Google Scholar]
- 59.Hu F, Luo W, Hong M. Mechanisms of proton conduction and gating in influenza M2 proton channels from solid-state NMR. Science. 2010;330:505–508. doi: 10.1126/science.1191714. [DOI] [PMC free article] [PubMed] [Google Scholar]
- 60.Ghosh A, Qiu J, DeGrado WF, Hochstrasser RM. Tidal surge in the M2 proton channel, sensed by 2D IR spectroscopy. Proc Natl Acad Sci USA. 2011;108:6115–6120. doi: 10.1073/pnas.1103027108. [DOI] [PMC free article] [PubMed] [Google Scholar]
- 61.Briggs J, Chung H, Caffrey M. The temperature-composition phase diagram and mesophase structure characterization of the monoolein/water system. J Phys II. 1996;6:723–751. [Google Scholar]
- 62.Liu W, Ishchenko A, Cherezov V. Preparation of microcrystals in lipidic cubic phase for serial femtosecond crystallography. Nat Protoc. 2014;9:2123–2134. doi: 10.1038/nprot.2014.141. [DOI] [PMC free article] [PubMed] [Google Scholar]
- 63.Baxter EL, et al. High-density grids for efficient data collection from multiple crystals. Acta Crystallogr D Struct Biol. 2016;72:2–11. doi: 10.1107/S2059798315020847. [DOI] [PMC free article] [PubMed] [Google Scholar]
- 64.Tono K, et al. Diverse application platform for hard X-ray diffraction in SACLA (DAPHNIS): Application to serial protein crystallography using an X-ray free-electron laser. J Synchrotron Radiat. 2015;22:532–537. doi: 10.1107/S1600577515004464. [DOI] [PMC free article] [PubMed] [Google Scholar]
- 65.Weierstall U, et al. Lipidic cubic phase injector facilitates membrane protein serial femtosecond crystallography. Nat Commun. 2014;5:3309. doi: 10.1038/ncomms4309. [DOI] [PMC free article] [PubMed] [Google Scholar]
- 66.Barty A, et al. Cheetah: Software for high-throughput reduction and analysis of serial femtosecond X-ray diffraction data. J Appl Cryst. 2014;47:1118–1131. doi: 10.1107/S1600576714007626. [DOI] [PMC free article] [PubMed] [Google Scholar]
- 67.Nakane T, et al. Data processing pipeline for serial femtosecond crystallography at SACLA. J Appl Cryst. 2016;49:1035–1041. doi: 10.1107/S1600576716005720. [DOI] [PMC free article] [PubMed] [Google Scholar]
- 68.Sauter NK, Hattne J, Grosse-Kunstleve RW, Echols N. New Python-based methods for data processing. Acta Crystallogr D Biol Crystallogr. 2013;69:1274–1282. doi: 10.1107/S0907444913000863. [DOI] [PMC free article] [PubMed] [Google Scholar]
- 69.Uervirojnangkoorn M, et al. Enabling X-ray free electron laser crystallography for challenging biological systems from a limited number of crystals. eLife. 2015;4:e05421. doi: 10.7554/eLife.05421. [DOI] [PMC free article] [PubMed] [Google Scholar]
- 70.Brehm W, Diederichs K. Breaking the indexing ambiguity in serial crystallography. Acta Crystallogr D Biol Crystallogr. 2014;70:101–109. doi: 10.1107/S1399004713025431. [DOI] [PubMed] [Google Scholar]
- 71.Adams PD, et al. PHENIX: A comprehensive Python-based system for macromolecular structure solution. Acta Crystallogr D Biol Crystallogr. 2010;66:213–221. doi: 10.1107/S0907444909052925. [DOI] [PMC free article] [PubMed] [Google Scholar]
- 72.Karplus PA, Diederichs K. Linking crystallographic model and data quality. Science. 2012;336:1030–1033. doi: 10.1126/science.1218231. [DOI] [PMC free article] [PubMed] [Google Scholar]
- 73.Lyubimov AY, et al. Advances in X-ray free electron laser (XFEL) diffraction data processing applied to the crystal structure of the synaptotagmin-1/SNARE complex. eLife. 2016;5:e18740. doi: 10.7554/eLife.18740. [DOI] [PMC free article] [PubMed] [Google Scholar]
- 74.Hagberg AA, Schult DA, Swart PJ. 2008. Exploring network structure, dynamics, and function using NetworkX. Proceedings of the 7th Python in Science Conference (SciPy2008), pp 11–15.
Associated Data
This section collects any data citations, data availability statements, or supplementary materials included in this article.


