Fig. 2.

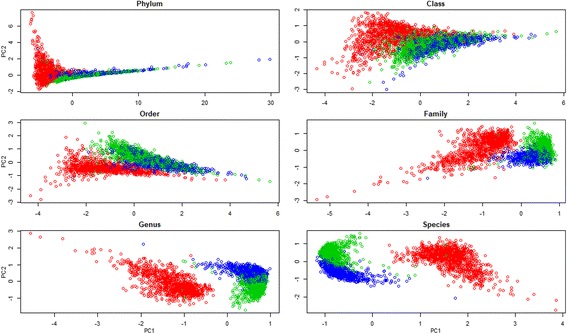
Scatter plots of samples at weaning (red circles), week 15 (green circles), and off-test (blue circles) by principal component 1 (PC1) and principal component 2 (PC2) at six taxonomic levels

Scatter plots of samples at weaning (red circles), week 15 (green circles), and off-test (blue circles) by principal component 1 (PC1) and principal component 2 (PC2) at six taxonomic levels